Habersham County in northeast Georgia is overwhelmingly green on the 2025 land-cover map, but the county is not uniform. Forest accounts for 66.12% of the mapped area, while agriculture makes up 16.34% and developed cover 15.37%. The four maps on this page separate those broad patterns into general land cover, forest and farmland, impervious surface, and mapped change from 1985 to 2025.
The same four maps are available as original JPG files in one ZIP download below. They work well when you need a larger reference image for printing, a presentation, a class project, or a closer comparison than the page preview allows.
Table of Contents
A county where forest dominates, but the southern half looks much busier
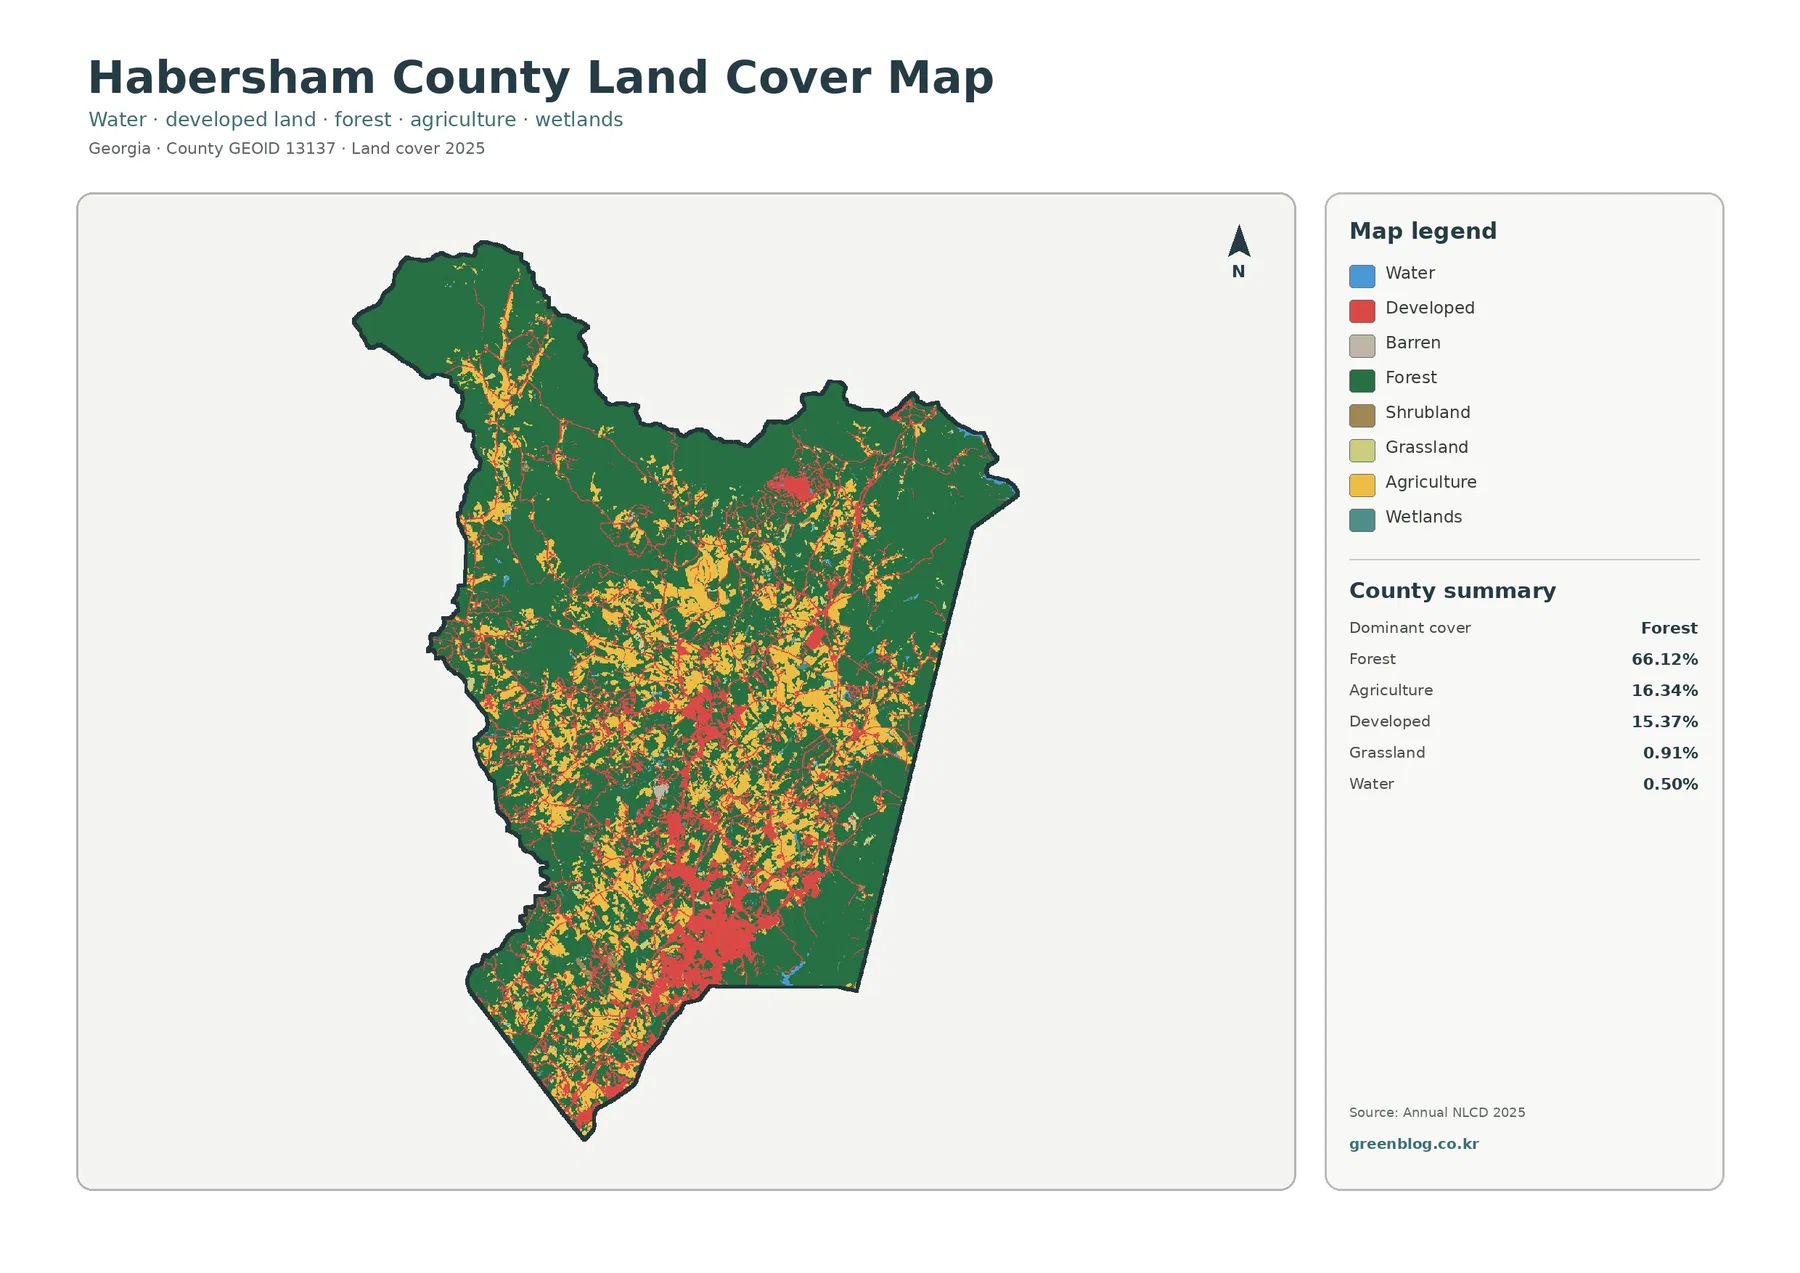
The most useful first reading is the contrast between the relatively continuous forest in the north and the more mixed pattern farther south. Habersham County describes itself as lying in the foothills of the Blue Ridge Mountains in northeast Georgia. On the map, that northern setting coincides with broad forest cover, while agriculture and developed land appear more often through the central and southern portions of the county. The map does not prove why those patterns formed, but the contrast is strong enough to guide a closer look.
Developed cover is not spread evenly. Red areas cluster most clearly in the south and south-central portion of the county, with smaller connected traces extending through the middle and toward the east. The far northern projection has comparatively little developed color. This makes Habersham different from a county where development forms one large continuous urban block; here, built areas are interwoven with forest and agricultural cover over much of the inhabited landscape.
Water occupies only 0.50% of the 2025 summary, so blue areas are visually minor at county scale. That does not mean streams and rivers are unimportant. Habersham County identifies the Chattahoochee, Soque, Tallulah, and Tugaloo among its major rivers. A narrow river can be significant even when it contributes little to the county-wide area total, which is why the land-cover map is best used as a surrounding-cover reference rather than a detailed hydrography map.
What the 2025 percentages look like on the ground pattern
A table of percentages can hide how fragmented each class is. Forest is the majority class, yet it appears in two different ways: as large connected areas in the north and along parts of the county edge, and as smaller pieces mixed among farms and developed land in the center and south. Agriculture is not one continuous block either. Its yellow tones form scattered patches, many of them embedded in the same part of the county where settlement and roads are more visible.
The smaller classes require a different reading scale. Grassland is 0.91%, water 0.50%, shrubland 0.44%, and wetlands 0.23% in the supplied summary. At the full-county view, those categories can disappear beside the much larger forest, agriculture, and developed classes. If one of the smaller classes matters to your project, use the legend first and then zoom in rather than assuming the absence of a bold color means the class is missing.
Land cover should also be kept separate from zoning or legal land use. Annual NLCD classifies the physical cover of the land surface—forest, developed cover, agriculture, water, wetlands, and related categories. It does not tell you who owns a parcel, whether a property can be subdivided, or which zoning district applies. Habersham County maintains separate planning and GIS information for parcels, zoning, streams, flood zones, and other local layers.
Forest and farmland become easier to compare when the legend is simplified
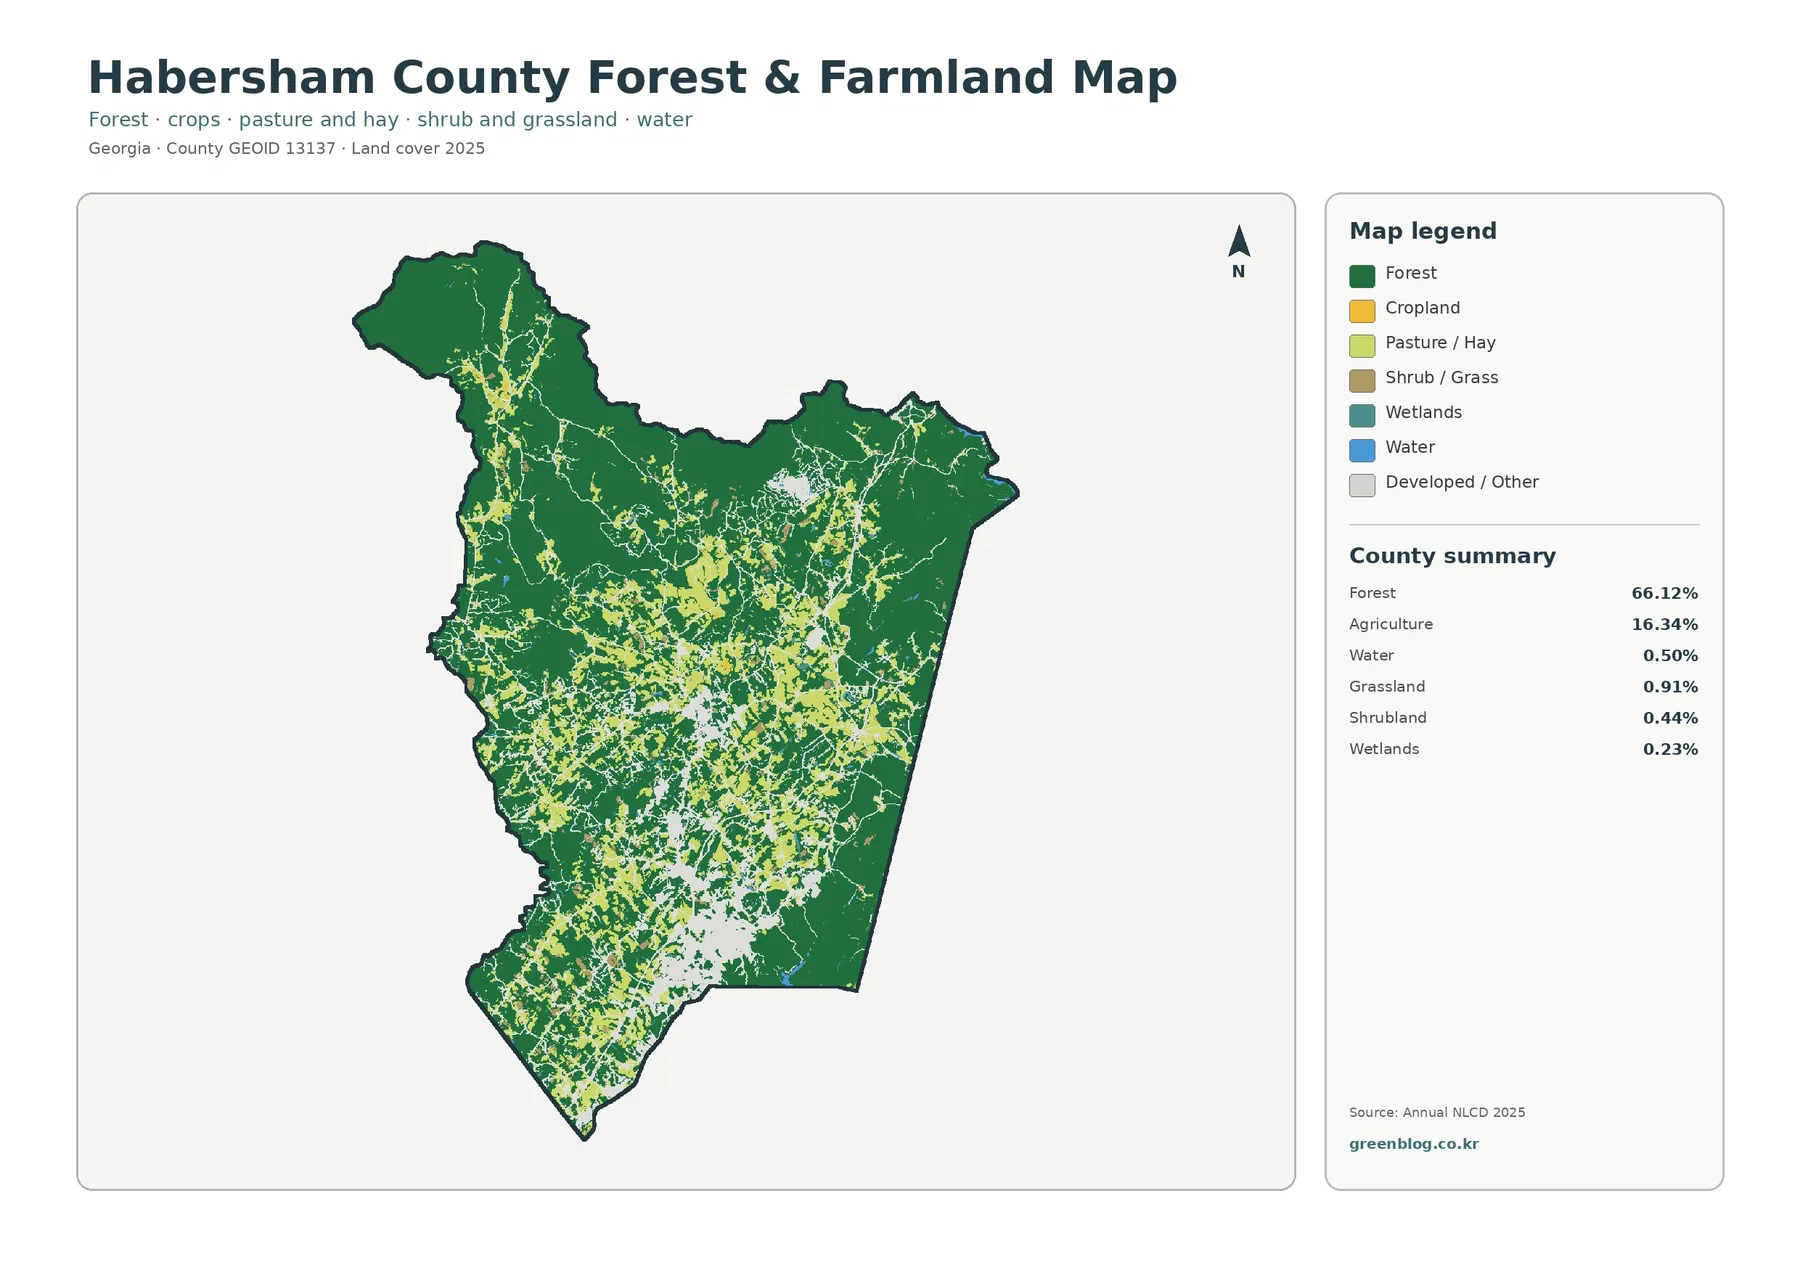
The forest-and-farmland version removes much of the visual competition from the general map. Dark green dominates the north and remains extensive along the county edges. Agricultural cover becomes more obvious through the middle and south, where it breaks into many irregular patches rather than forming a single agricultural belt. That patchwork is one of the clearest Habersham-specific features in the set: farming and developed or other open surfaces are repeatedly surrounded by forest.
The 16.34% agricultural share is large enough to shape the county map, even though forest still covers about four times as much area. UGA Extension maintains an Agriculture and Natural Resources program in Habersham County that provides soil, water, forage, plant, and other testing and educational services. That county-specific program is useful context for why an agricultural layer matters here, but the map itself should not be read as a field-by-field farm inventory.
Likewise, the dark-green forest category does not identify ownership. A green cell can represent forest on public or private land, and this map is not a boundary map for national forest property. The correct question is simply where tree-covered land is classified across the county. Ownership, easements, management rules, and parcel boundaries require separate authoritative records.
Impervious surface reveals the compact built centers inside a mostly green county
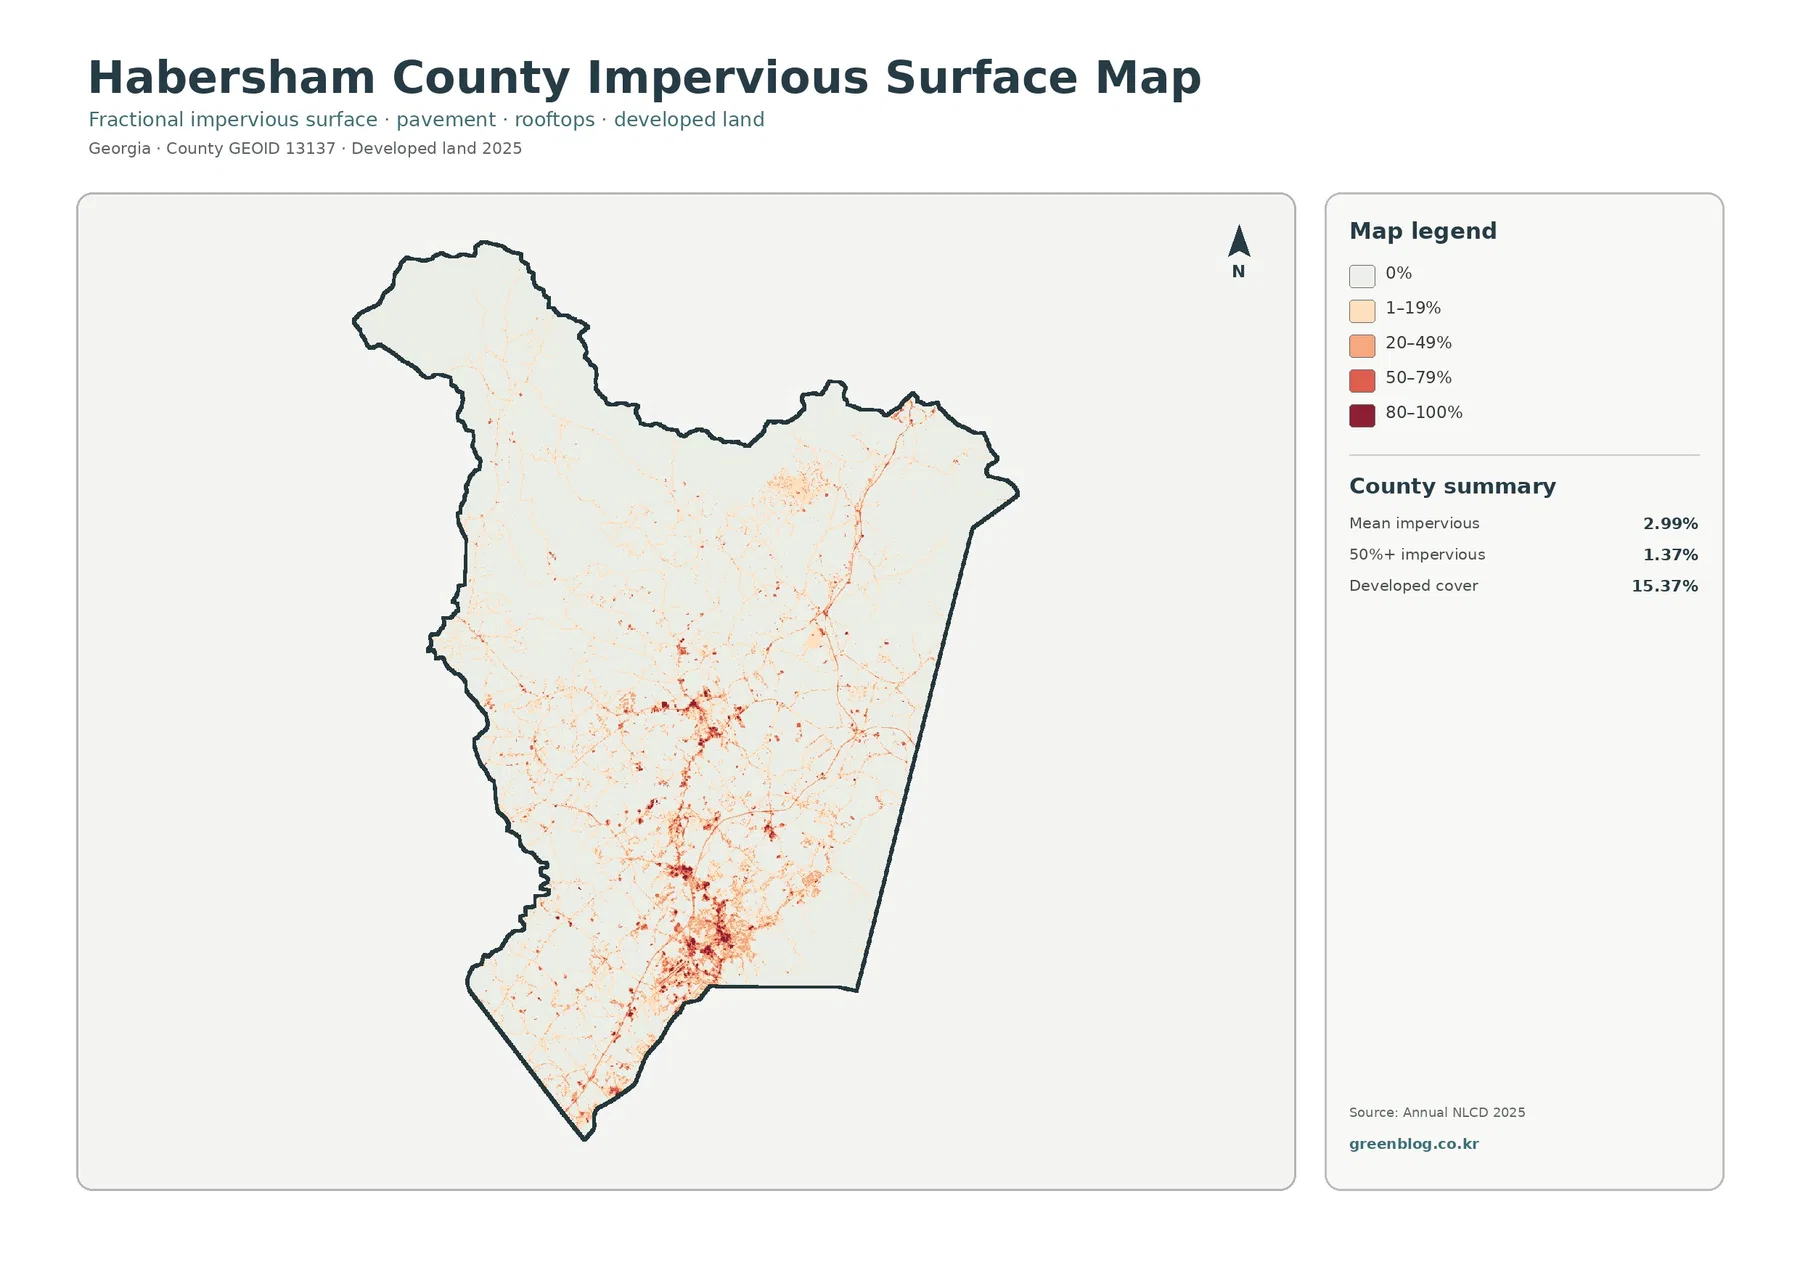
Impervious surface means hard cover such as pavement and rooftops that does not readily absorb rainfall. The supplied map reports a county-wide mean impervious value of 2.99%, while cells with at least 50% impervious surface account for 1.37%. Those figures are much lower than the 15.37% developed-cover share because a developed land-cover class can include lawns, trees, and other vegetation mixed with buildings and pavement.
The strongest impervious colors are concentrated in small southern and south-central clusters. Thin lines and smaller spots connect or extend away from those centers, while the northern part of the county remains mostly pale. Comparing this map with the general land-cover view is useful because it separates “mapped as developed” from “covered by a high percentage of hard surface.” A low-density developed area can appear clearly on the land-cover map without becoming a dark impervious area.
For watershed or stormwater discussions, impervious surface is an important clue, not a complete risk map. Runoff depends on slope, soil, drainage infrastructure, stream position, rainfall, and many other conditions. The map can identify places where hard surfaces are relatively concentrated, but it should not be used by itself to assign flood risk or drainage problems to a specific property.
The 1985–2025 map is a change screen, not a parcel history
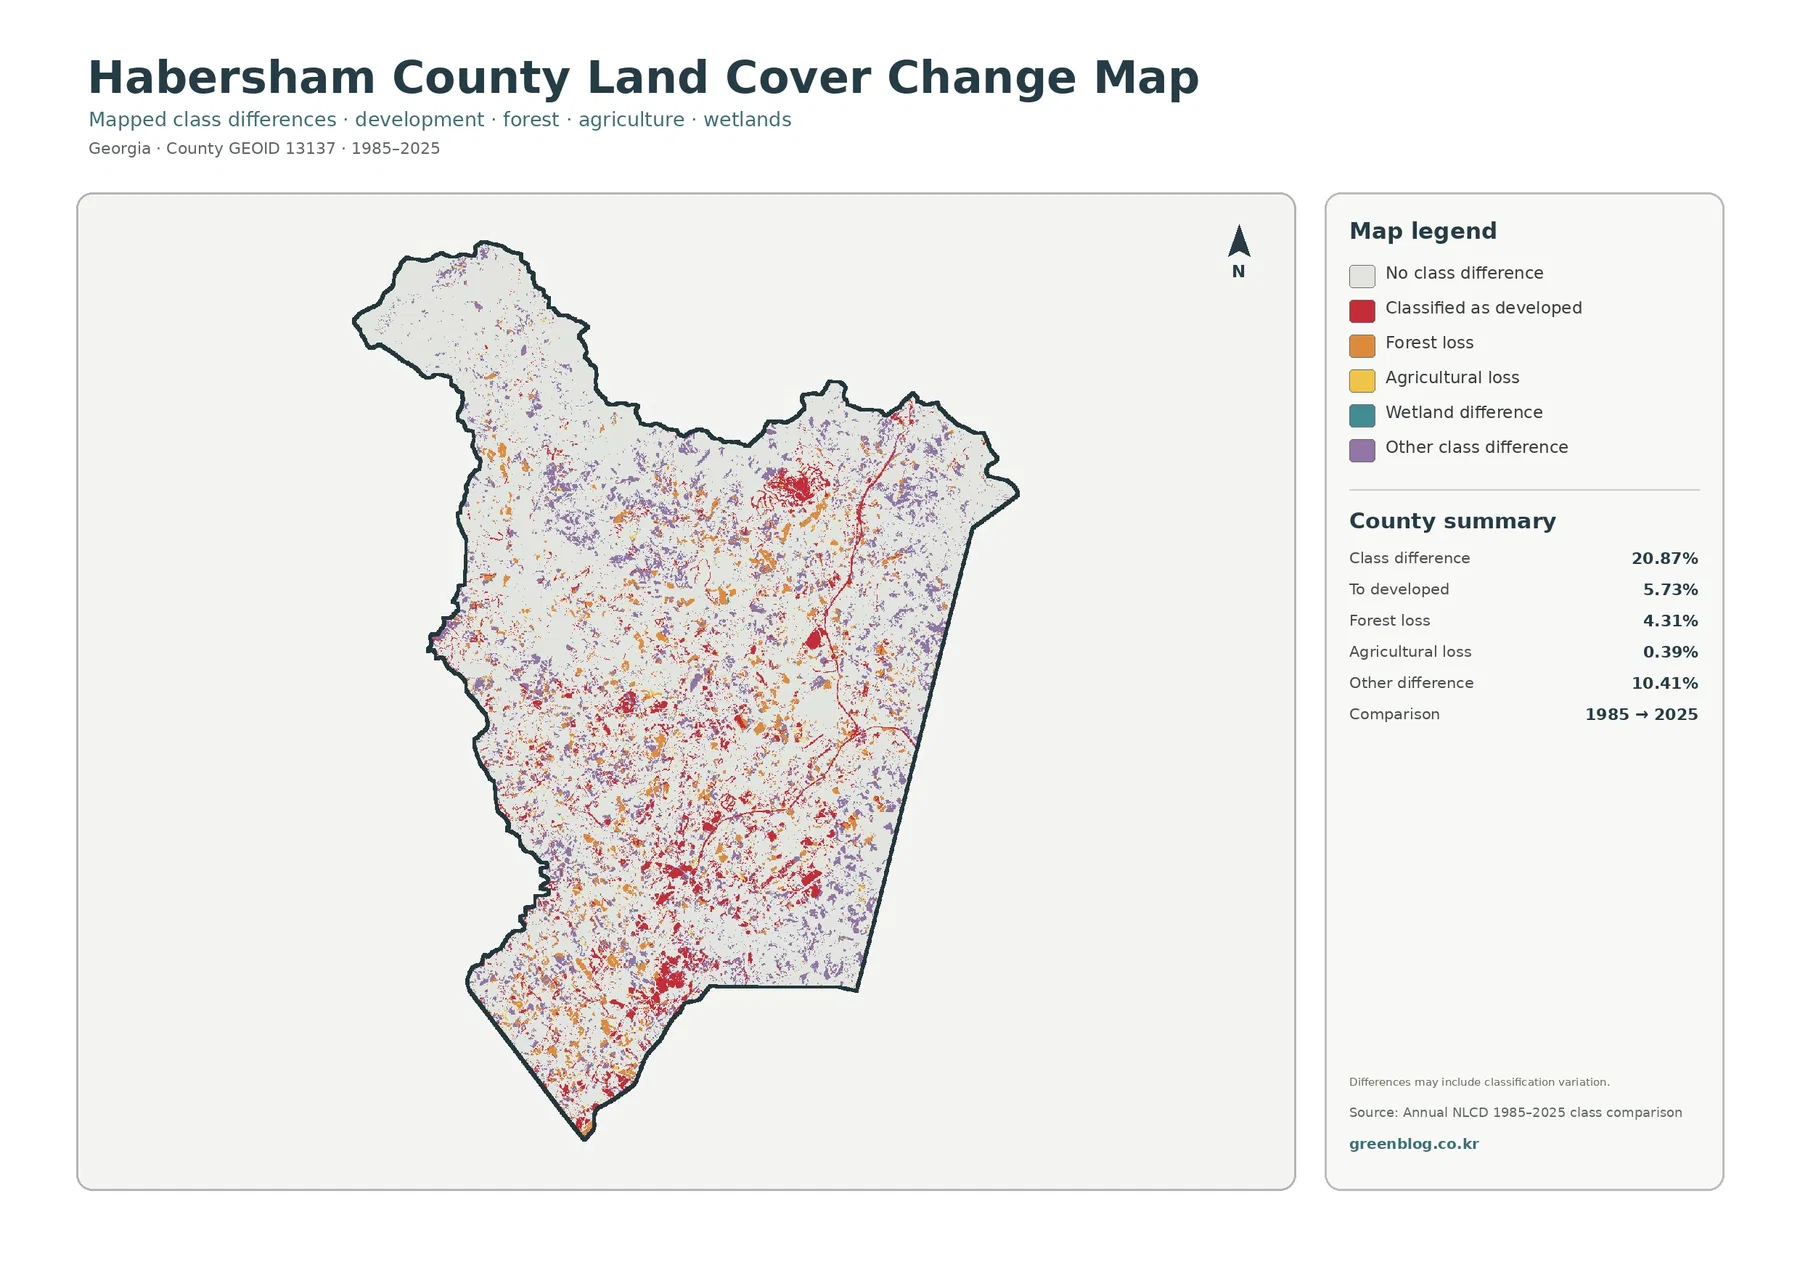
The change map marks a 20.87% overall class difference between 1985 and 2025. Within the supplied summary, 5.73% is classified as change to developed, 4.31% as forest loss, 0.39% as agricultural loss, and 10.41% as other difference. Colored change cells are scattered across the county, but red change-to-developed areas appear more often near the current southern and central developed pattern and along a narrower eastern corridor.
The map itself warns that differences may include classification variation. That caution matters. Annual NLCD is a raster product, and small changes can reflect mixed land-cover cells, observation conditions, or classification differences as well as actual landscape change. A red or orange patch therefore should be treated as a place to investigate, not automatic proof that a specific parcel was developed or cleared during the period.
A better workflow is to use the change map to locate broad concentrations, then compare those locations with the 2025 land-cover and impervious maps. If an area appears as change to developed and also contains current developed cover or a stronger impervious signal, the maps provide a consistent reason to look closer. Determining the cause still requires dated aerial imagery, permits, parcel records, or another source that documents what happened there.
How local geography adds context without over-explaining the map
Habersham County’s official background page places the county in the foothills of the Appalachian and Blue Ridge Mountains and gives a general elevation range of about 1,400 to 2,000 feet, with Young Lick Mountain reaching 3,800 feet. Those facts help explain why a reader may want to compare land cover with terrain, but the four maps in this package do not contain contours or elevation labels. The safest interpretation is that the northern portion is visibly more forested, while any detailed link between individual slopes and land-cover classes should be checked on an elevation map.
The same discipline applies to development. The southern concentration is obvious, yet land cover alone cannot identify the policy, road project, population change, or private decision that produced a particular developed patch. Habersham County’s Planning and Development Department works with growth, land-use districting, subdivision review, and long-range planning, while its GIS program maintains separate layers such as parcels, street centerlines, contours, streams, city limits, flood zones, and zoning. Those sources answer different questions than this land-cover set.
That distinction is practical for map users. Use these four images to compare surface cover and mapped change across the whole county. Use the county GIS when you need an address, parcel, stream, municipal boundary, or zoning layer. Keeping those purposes separate prevents a common mistake: treating a satellite-based land-cover class as if it were a legal land-use designation.
Choosing the right map for a report, lesson, or local reference
Start with the general 2025 land-cover map when you need the whole picture. It is the quickest way to compare the forest majority with agriculture and developed cover and to see where the smaller classes fit. For a discussion focused on farming or tree cover, the forest-and-farmland version removes extra categories and makes the north-to-south contrast easier to see. For built surfaces, the impervious map is more precise than the general developed class because it highlights where pavement and rooftops occupy more of each cell.
The change map works best as the last step rather than the first. Once you understand the 2025 pattern, the 1985–2025 colors have a clearer reference point. In a presentation, placing the current land-cover map beside the change map lets an audience distinguish present condition from mapped difference. In a classroom setting, pairing the developed-cover and impervious maps is a useful way to show why “developed” and “completely paved” are not equivalent.
For printed use, keep the legend large enough to read. The small categories are easy to lose when the map is reduced too far, especially water, wetlands, and high-impervious cells. If your goal is to discuss a small site, crop a copy for presentation but keep the full county map nearby so the local example remains connected to the broader Habersham pattern.
A watershed project can also use the set as a background layer. With only 0.50% mapped water, river and stream corridors occupy little area compared with forest and agriculture, but linear waterways can still connect many parts of the county. The land-cover maps are most useful for asking what surrounds those corridors. Detailed stream location, floodplain boundaries, or channel measurements should come from hydrography or county GIS sources instead.
Resolution, classification, and other limits to keep in mind
Annual NLCD products are raster datasets produced at 30-meter spatial resolution. In simple terms, the landscape is divided into grid cells, and each cell receives a land-cover classification or a surface value. A 30-meter cell can contain more than one real feature—a road beside trees, a house with lawn, or a field edge next to forest. That mixed-pixel effect is one reason the map is excellent for county-scale patterns but not a substitute for a parcel survey.
The observation year matters as well. The general, forest/farmland, and impervious summaries in this package are tied to 2025, while the change product compares 1985 with 2025. Construction, vegetation change, timber activity, storm effects, or agricultural changes occurring after the mapped observation period will not appear until a later dataset captures them. For current site decisions, check recent aerial imagery and local records in addition to this map.
Comparisons should stay within a consistent NLCD product generation whenever possible. MRLC notes that older Legacy NLCD releases and the newer Annual NLCD can differ because their methods, inputs, and ancillary data are not identical. Mixing numbers from different generations can create apparent changes that are methodological rather than physical. The figures on this page are therefore kept to the supplied Annual NLCD-based maps and their stated 1985–2025 comparison.
Frequently Asked Questions
What is the clearest land-cover pattern in Habersham County?
Forest is the dominant 2025 class at 66.12%, and the broadest connected forest is visible in the northern part of the county. Agriculture and developed cover become more frequent through the center and south, creating a more fragmented pattern than the northern forest. That contrast is more informative than the county-wide percentages alone.
Why is developed cover 15.37% when mean impervious surface is only 2.99%?
A developed land-cover class can contain vegetation along with buildings and pavement, especially in lower-density residential areas. Impervious surface measures the hard, water-resistant portion more directly. The two maps therefore describe related but different features, and the much smaller mean impervious value is not a contradiction.
Does every colored cell on the 1985–2025 change map represent a confirmed real-world conversion?
No. The supplied change map explicitly notes that mapped differences may include classification variation. A change cell is best treated as evidence that the class result differs between the two mapped years. Confirming the history of a specific place requires additional imagery, parcel information, permits, or field evidence.
Sources and reference data
- MRLC Annual NLCD Data – access to the current Annual NLCD product suite, including 2025 products.
- USGS Annual NLCD Collection 1.2 Land Cover – 30-meter raster resolution and land-cover product documentation.
- Habersham County – About Habersham – county setting in the Blue Ridge foothills, elevation context, and major rivers.
- UGA Extension Habersham County – Agriculture & Natural Resources – county-specific agriculture and natural-resource services.
- Habersham County GIS Department – local parcel, street, contour, stream, city-limit, flood-zone, and zoning layers.
Map File Information
The ZIP contains the four original JPG maps for Habersham County: land cover, forest and farmland, impervious surface, and 1985–2025 land-cover change.
- Included Files: 4 original JPG land cover map files shown in this article
- File Type: JPG files in a ZIP archive
- Intended Use: Printing, education, presentations, and map-based projects
Related Maps
- Appling County Georgia Land Cover Map
- Atkinson County Georgia Land Cover Map
- Bacon County Georgia Land Cover Map
Green Map creates custom-edited map images using open geographic data sources such as geoBoundaries, Natural Earth, OpenStreetMap, and government open data. These maps are edited visual materials, not raw data files, and are provided for education, documents, presentations, and graphic reference.