Pottawattamie County stretches from Council Bluffs on the Missouri River to Avoca, Walnut, Oakland, and other smaller communities across western Iowa. I-29 and I-80 meet near Council Bluffs, and I-80 continues east through Underwood and Neola toward the northeastern part of the county. U.S. 6, 59, 83, 275, and Iowa 92 provide additional references for the rural interior. This page explains the supplied county, city, terrain-and-water, and elevation maps, and high-resolution JPG copies can be downloaded in a ZIP near the end of the article. High-resolution map files are available for download in the section below.
The county’s terrain changes sharply from west to east. Broad, low ground lies along the Missouri River, while narrow ridges and creek valleys dominate the interior. Keg Creek and the Silver Creek system cut through the center, and the Nishnabotna rivers create additional lower corridors in the east. The supplied elevation map spans 278 to 414 meters, making those contrasts easy to compare.
Table of Contents
Council Bluffs anchors the interstate network on the western edge
Council Bluffs is the clearest starting point on the general county map. I-29 follows the western side near the Missouri River, and I-80 turns east across the county. Carter Lake lies immediately north of the Council Bluffs area, while Crescent provides another reference farther north.
Underwood and Neola sit along the I-80 corridor farther east. Shelby and Avoca appear in the northeastern part of the county, with Hancock to the south and Walnut close to the eastern boundary. Oakland and Carson mark the southeastern interior, while Treynor provides a south-central reference along Iowa 92.
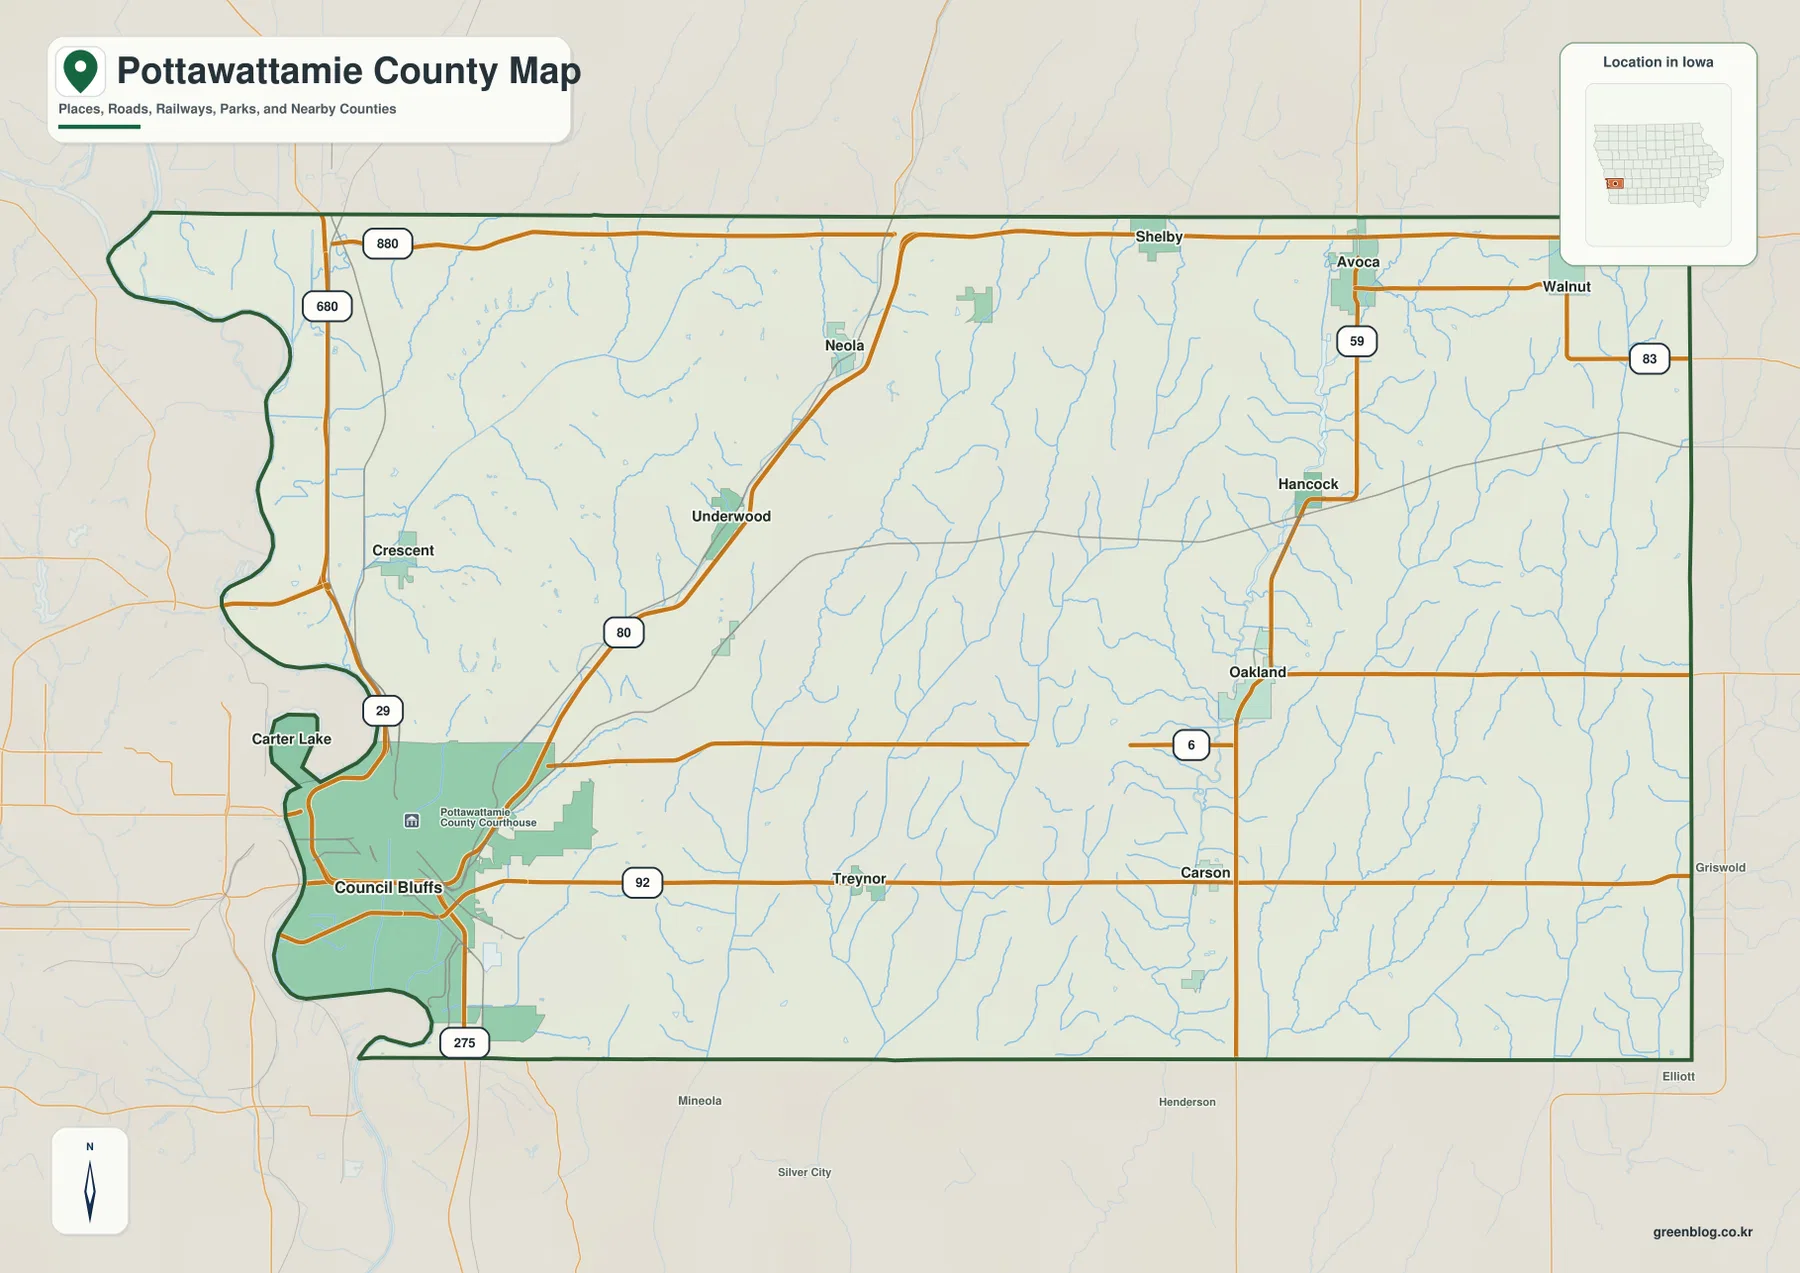
The western county line follows the Missouri River and is noticeably more irregular than the straighter southern and eastern boundaries. U.S. 275 helps locate the southern Council Bluffs side, while U.S. 59 and U.S. 83 provide north-south references in the eastern half. The map is designed for county-scale orientation rather than live traffic conditions.
Council Bluffs dominates a city pattern spread across the county
The city map ranks Council Bluffs first with a mapped population of 62,586. Carter Lake is second at 3,767, Avoca third at 1,444, Oakland fourth at 1,408, Walnut fifth at 1,342, and Treynor sixth at 1,126. The gap between Council Bluffs and the other highlighted places is large, which makes the western urban concentration immediately visible.
Council Bluffs and Carter Lake are clustered on the Missouri River side, while Avoca and Walnut sit in the northeast. Oakland is farther southeast and Treynor lies south of the county center. This arrangement gives the map a strong west-versus-east contrast rather than a single chain of similarly sized towns.
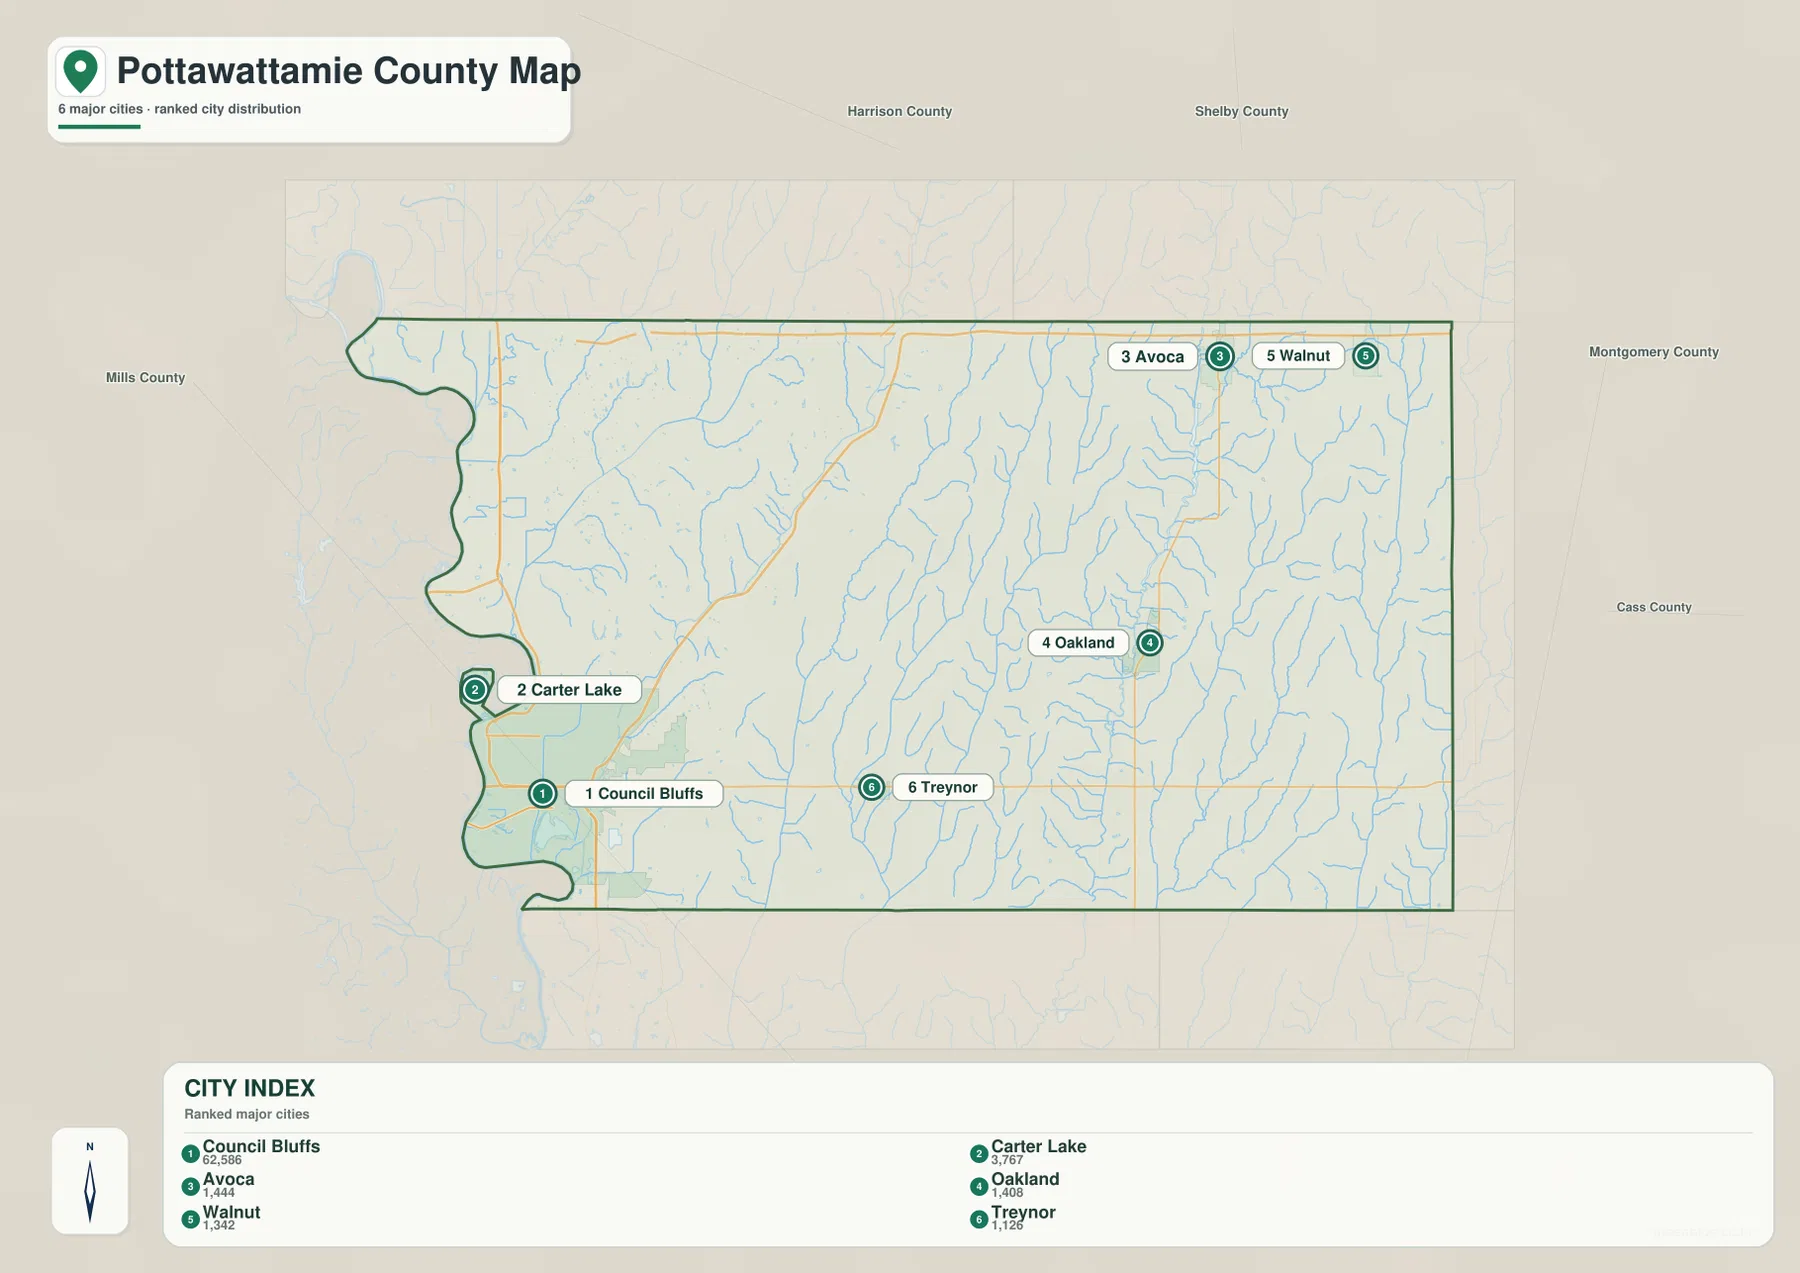
Neighboring labels include Harrison and Shelby counties to the north, Mills County to the southwest, and Montgomery and Cass counties to the east. Those labels make it easier to see how the eastern communities connect to the surrounding rural counties while Council Bluffs sits at the western river edge.
Missouri River and Boyer River define the broad western lowland
Missouri River is the dominant water feature along the western edge. The land around Council Bluffs and Carter Lake is broad and low compared with the deeply dissected interior, and the elevation map shows this area in the darkest green tones. Boyer River enters the northwestern side and adds another low corridor near the county boundary.
Lake Manawa is the clearest named lake on the supplied water map, located south of Council Bluffs. Indian Creek crosses the same western side and helps connect the urban river lowland with the first hills farther inland. Together, these features make the western part of the county look very different from the central and eastern uplands.
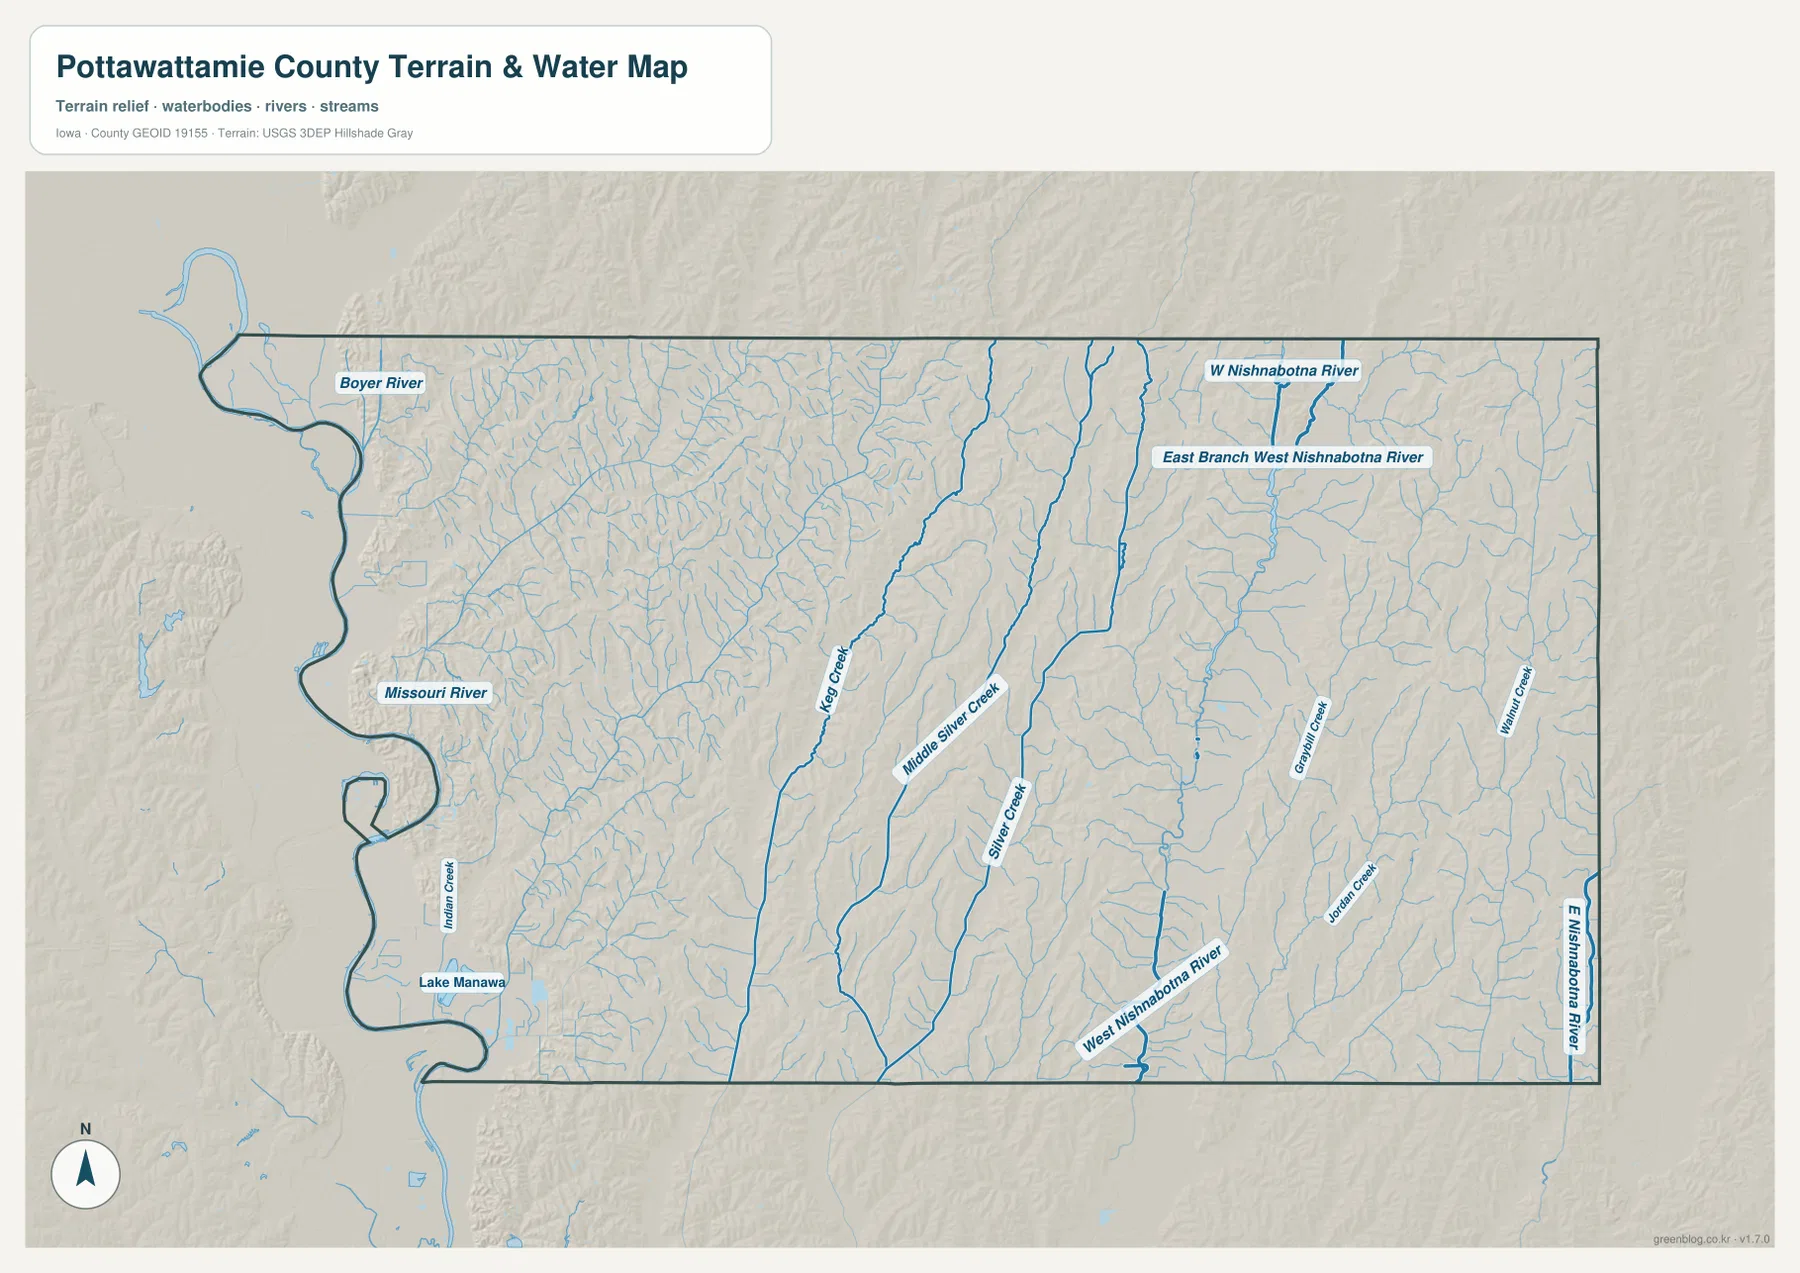
This water-and-terrain sheet is for general geographic reference. It does not show current flood conditions, water depth, navigation limits, parcel boundaries, or legal water boundaries, so those questions require current agency data.
Keg Creek and the Silver Creek system divide the central ridges
Keg Creek runs through the central part of the county as a long north-south valley. Middle Silver Creek and Silver Creek form neighboring lower corridors farther east. On the elevation map, the three valleys appear as green bands separated by narrow brown ridges.
This pattern is especially clear south of the Underwood and Neola area. Roads may look fairly straight on the general map, but the terrain underneath them is much more broken because numerous small tributaries cut into the ridges. The center of the county therefore acts as a transition between the broad Missouri River lowland and the larger eastern river valleys.
The Silver Creek corridor also helps orient the Oakland and Carson side. Moving east from those central valleys leads toward the wider low ground associated with the Nishnabotna river system.
Nishnabotna waterways create a second set of low corridors in the east
W Nishnabotna River appears in the northeastern part of the terrain map, with East Branch West Nishnabotna River continuing nearby. West Nishnabotna River becomes a major reference farther south and helps define the lower terrain east of the county center.
Along the far eastern side, E Nishnabotna River forms another north-south corridor. Graybill Creek, Jordan Creek, and Walnut Creek cut through adjacent uplands and provide useful local references around the Walnut, Avoca, and Oakland parts of the county.
The eastern lowlands differ from the Missouri River side. Instead of one extremely broad flat plain, the Nishnabotna valleys are more often enclosed by long ridges. That contrast is one of the clearest terrain differences visible across the supplied map set.
Elevation rises from 278 meters to 414 meters
The supplied elevation map shows an actual range of about 278 to 414 meters, with a mean elevation of 359 meters. The lowest ground occupies the Missouri River side and several major stream valleys, while higher brown ridges become common almost immediately east of the western lowland.
Keg Creek and the Silver Creek system create repeated green corridors through the center. Higher ground between those waterways often reaches the upper part of the map’s color scale, and the eastern county repeats the same ridge-and-valley pattern around the Nishnabotna system. The total mapped relief is about 136 meters.
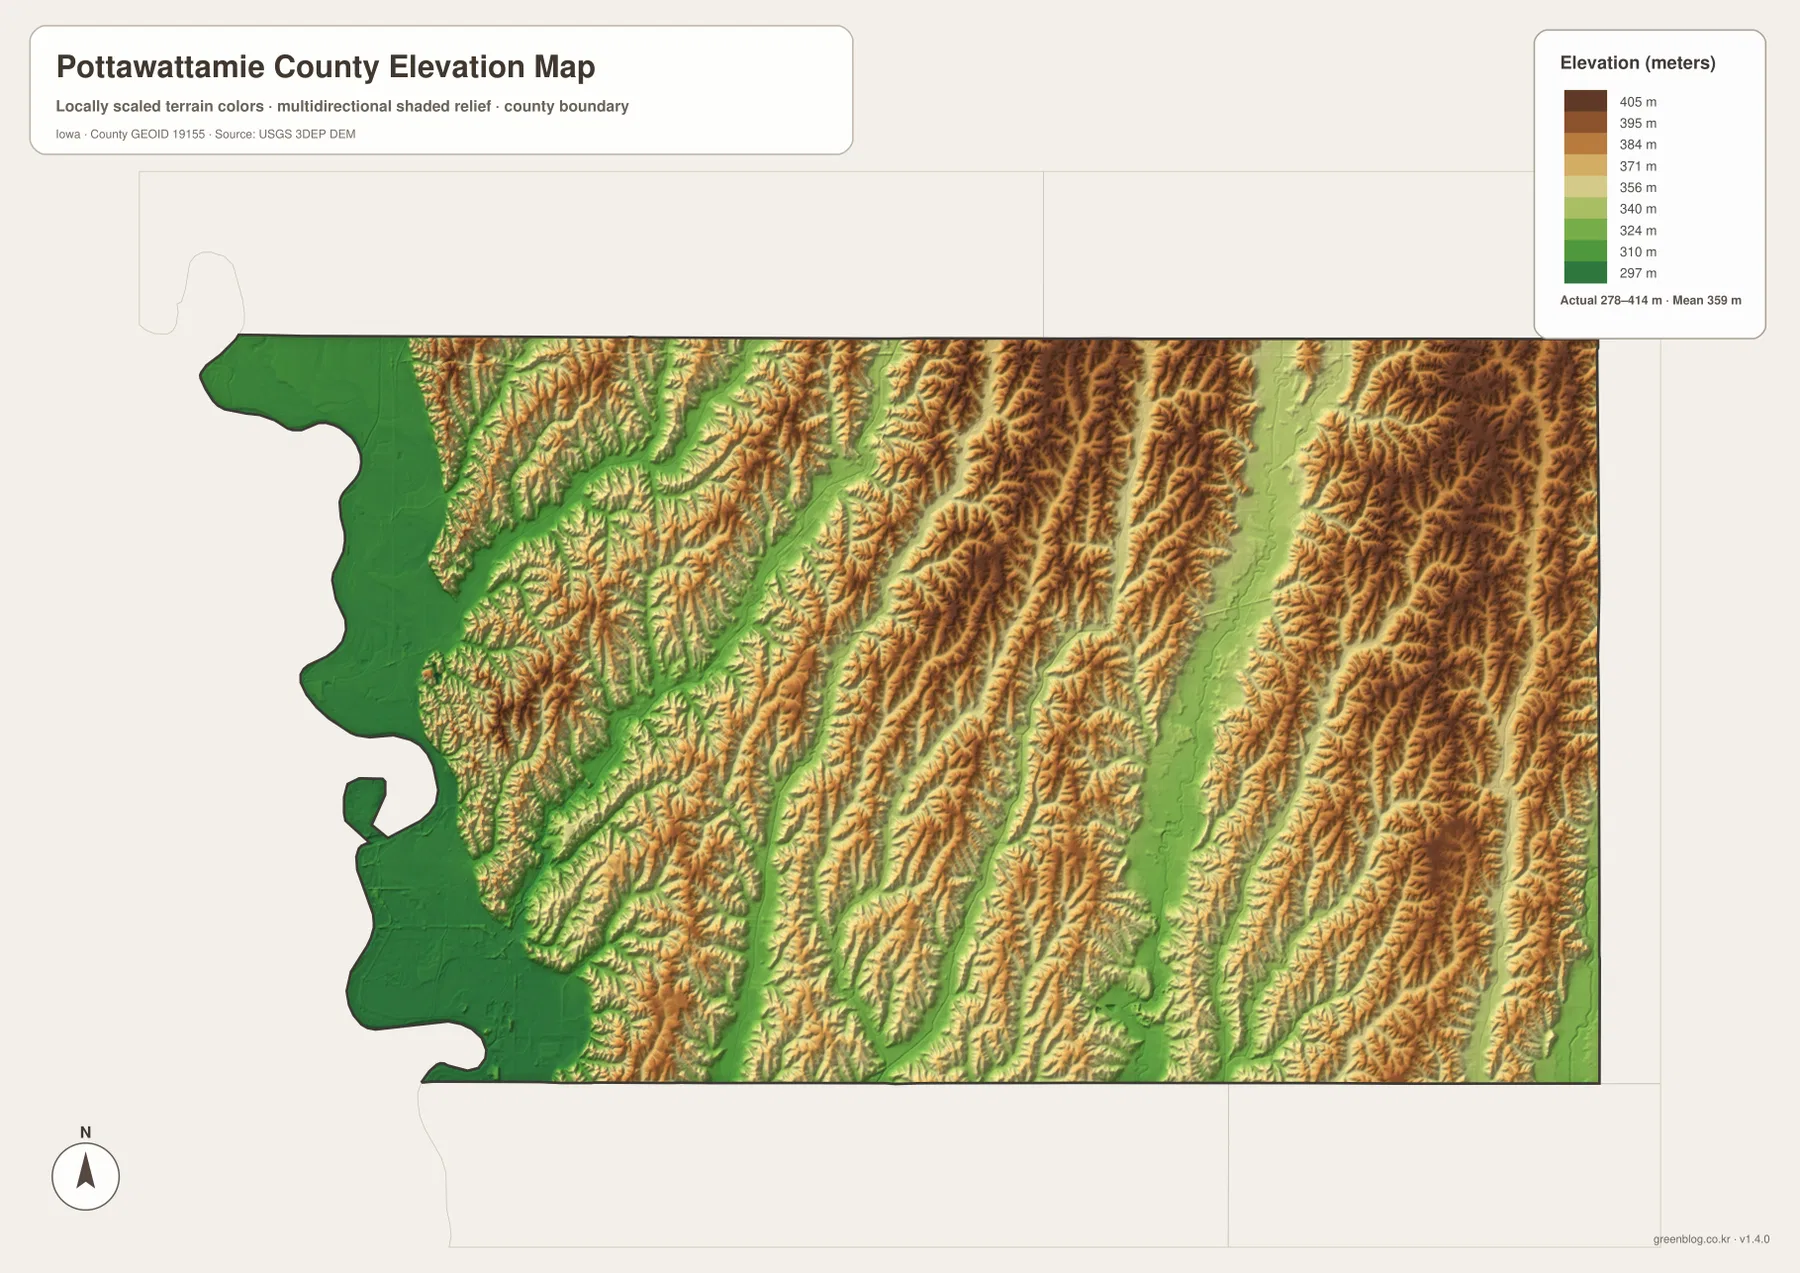
The elevation colors are intended for broad terrain comparison rather than survey-grade measurement. Exact parcel elevations, road grades, engineering design, and construction work require original elevation data or professional surveying.
An I-80 trip reveals the county’s west-to-east terrain change
Following I-80 east from Council Bluffs provides a simple way to understand the county. The route begins near the broad Missouri River lowland, reaches increasingly dissected hills around Underwood and Neola, and then approaches another set of valleys and ridges near Avoca and the Nishnabotna system.
A similar pattern appears along Iowa 92 through Treynor and Carson. The road leaves the lower Council Bluffs side, crosses central ridges, and approaches eastern creek valleys. Comparing these roads with the water and elevation maps shows that east-west travel crosses several distinct terrain zones rather than one uniform plain.
Choose the Pottawattamie County map that matches your question
Use the general county map for towns and major routes. It is the fastest way to compare Council Bluffs, Carter Lake, Underwood, Neola, Avoca, Walnut, Oakland, Carson, and Treynor with I-80, I-29, U.S. 6, U.S. 59, U.S. 83, U.S. 275, and Iowa 92. The city map is better for comparing the six highlighted communities and their population ranking.
The terrain-and-water map is best for Missouri River, Boyer River, Lake Manawa, Keg Creek, the Silver Creek system, West Nishnabotna River, E Nishnabotna River, and smaller eastern tributaries. The elevation map adds the 278–414 m range and makes the contrast between the western lowland and the central-eastern ridges immediately visible.
The WebP images in the article are optimized for quick browser viewing. For printing, classroom use, presentations, or closer regional comparison, the ZIP below contains the county, major-city, terrain-and-water, and elevation maps as high-resolution JPG files. They are general-reference maps rather than legal, flood, navigation, or engineering products.
Frequently Asked Questions
Which map best shows the difference between Council Bluffs and Avoca?
The general county map is the best starting point. Council Bluffs is on the western Missouri River side, while Avoca lies in the northeastern interior. I-80 provides a clear east-west route between the two areas through Underwood and Neola.
Why does the central county look so strongly ridged on the elevation map?
Keg Creek, Middle Silver Creek, Silver Creek, and many smaller tributaries cut long valleys through the central uplands. The ridges between those valleys remain much higher, creating the repeated brown-and-green pattern visible on the elevation sheet.
What does the 278–414 m elevation range mean?
The lowest terrain is concentrated near the Missouri River and major stream valleys, while many central and eastern ridges are higher. The mapped mean elevation is 359 meters. Precise site elevations require original elevation data or professional survey information.
Map File Information
The ZIP contains four high-resolution JPG maps for Pottawattamie County, Iowa: county, major cities, terrain and water, and elevation.
- Included Files: Use only the versions confirmed in the article and supplied images
- File Type: Use the confirmed download contents
- Intended Use: Printing, education, presentations, and map-based projects
Related Maps
Sources and reference data
Pottawattamie County’s official GIS department provides county-specific mapping resources, while the federal links below support boundary, hydrography, and elevation reference data.
- Pottawattamie County Geographic Information Systems
- U.S. Census Bureau TIGER/Line Shapefiles
- USGS National Hydrography
- USGS 3D Elevation Program
These maps are intended for general geographic reference, learning, printing, and visual comparison. Legal boundaries, ownership, current road conditions, flood risk, water levels, and precise elevations should be checked against the responsible agency’s current records.
Green Map creates custom-edited map images using open geographic data sources such as geoBoundaries, Natural Earth, OpenStreetMap, and government open data.
These maps are edited visual materials, not raw data files, and are provided for education, documents, presentations, and graphic reference.