Pennsylvania has two major metropolitan anchors at opposite ends of the state, but its settlement pattern is more complex than a Philadelphia-versus-Pittsburgh contrast. Philadelphia dominates the southeast, Pittsburgh anchors the southwest, and a chain of regional centers runs through the interior and northeast, including Harrisburg, Lancaster, Reading, State College, Scranton, and Wilkes-Barre. The supplied 2024 ACS 5-year estimates put the state population at 13,018,639. The county data imply about 44,742 square miles of land and an average density near 291 people per square mile.
That statewide average hides enormous variation. Philadelphia County averages more than 11,700 people per square mile, while Cameron, Sullivan, and Forest counties are below 16. The five maps also separate current population size, density, small-area settlement, and historical change. A large proportional circle represents total residents, not people per square mile. The 2010–2020 change map compares two decennial censuses and should not be described as a 2024 growth rate.
Table of Contents
Philadelphia forms the broadest and darkest tract-level concentration in the state
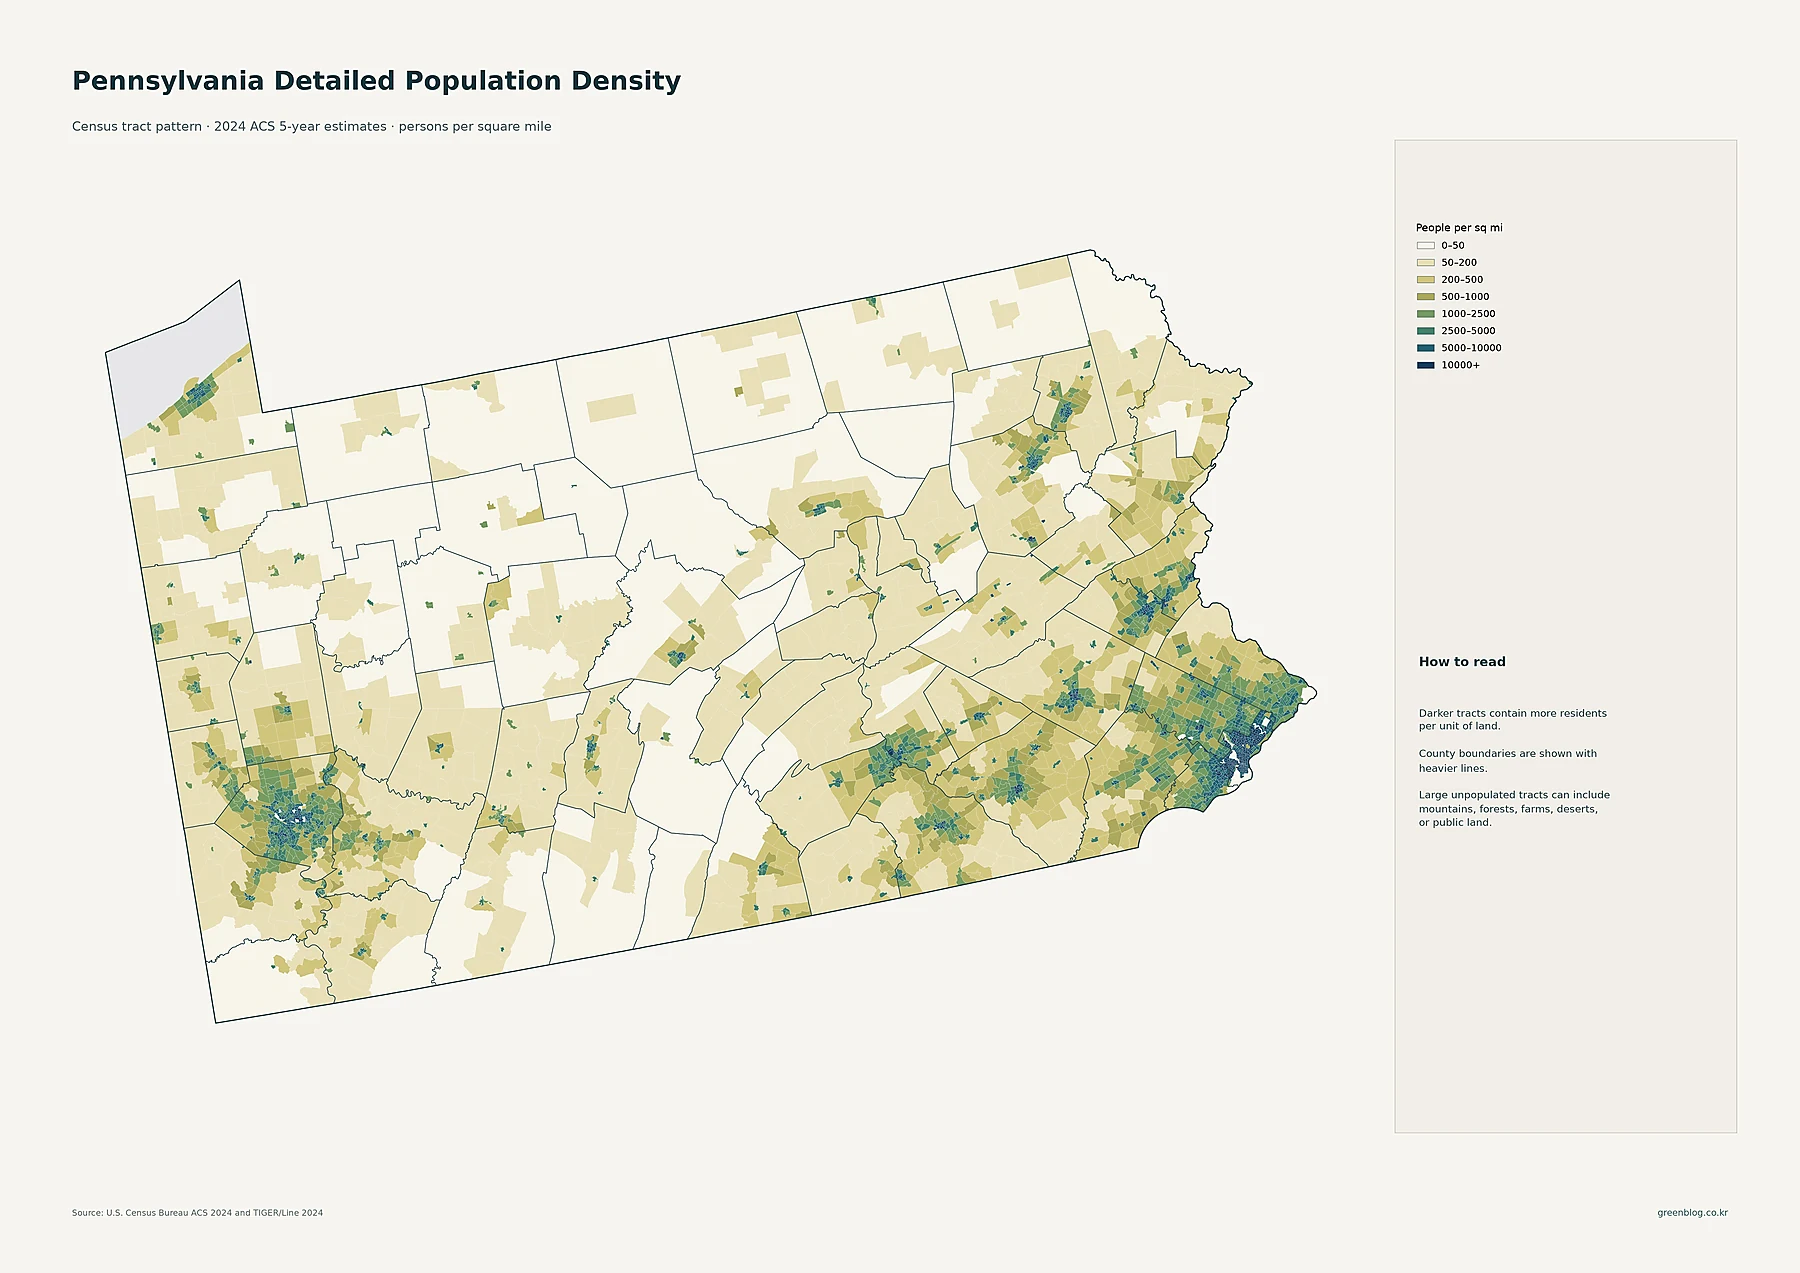
The darkest census tracts cluster in Philadelphia and continue into Delaware, Montgomery, and Bucks counties. Large portions of the city fall into the 5,000–10,000 and 10,000+ people-per-square-mile classes, while the surrounding suburbs contain many tracts above 1,000. The map therefore presents southeastern Pennsylvania as one extended settlement region rather than a single dense city surrounded immediately by rural land.
Farther north, the Lehigh Valley creates another visible concentration around Allentown, Bethlehem, and Easton. Reading, Lancaster, York, and Harrisburg each form distinct clusters across south-central and eastern Pennsylvania. In the northeast, Scranton and Wilkes-Barre appear within a longer urbanized valley pattern. Erie stands apart in the northwest along Lake Erie.
Pittsburgh is the major western concentration. Dense tracts fill central Allegheny County and extend along the river valleys and surrounding communities. Between these metropolitan and regional centers, much of northern and north-central Pennsylvania remains in the 0–50 or 50–200 people-per-square-mile classes. The tract map is especially useful because it reveals these urban pockets inside counties whose averages may otherwise look moderate or low.
Philadelphia is by far the largest census place, with Pittsburgh a distant second
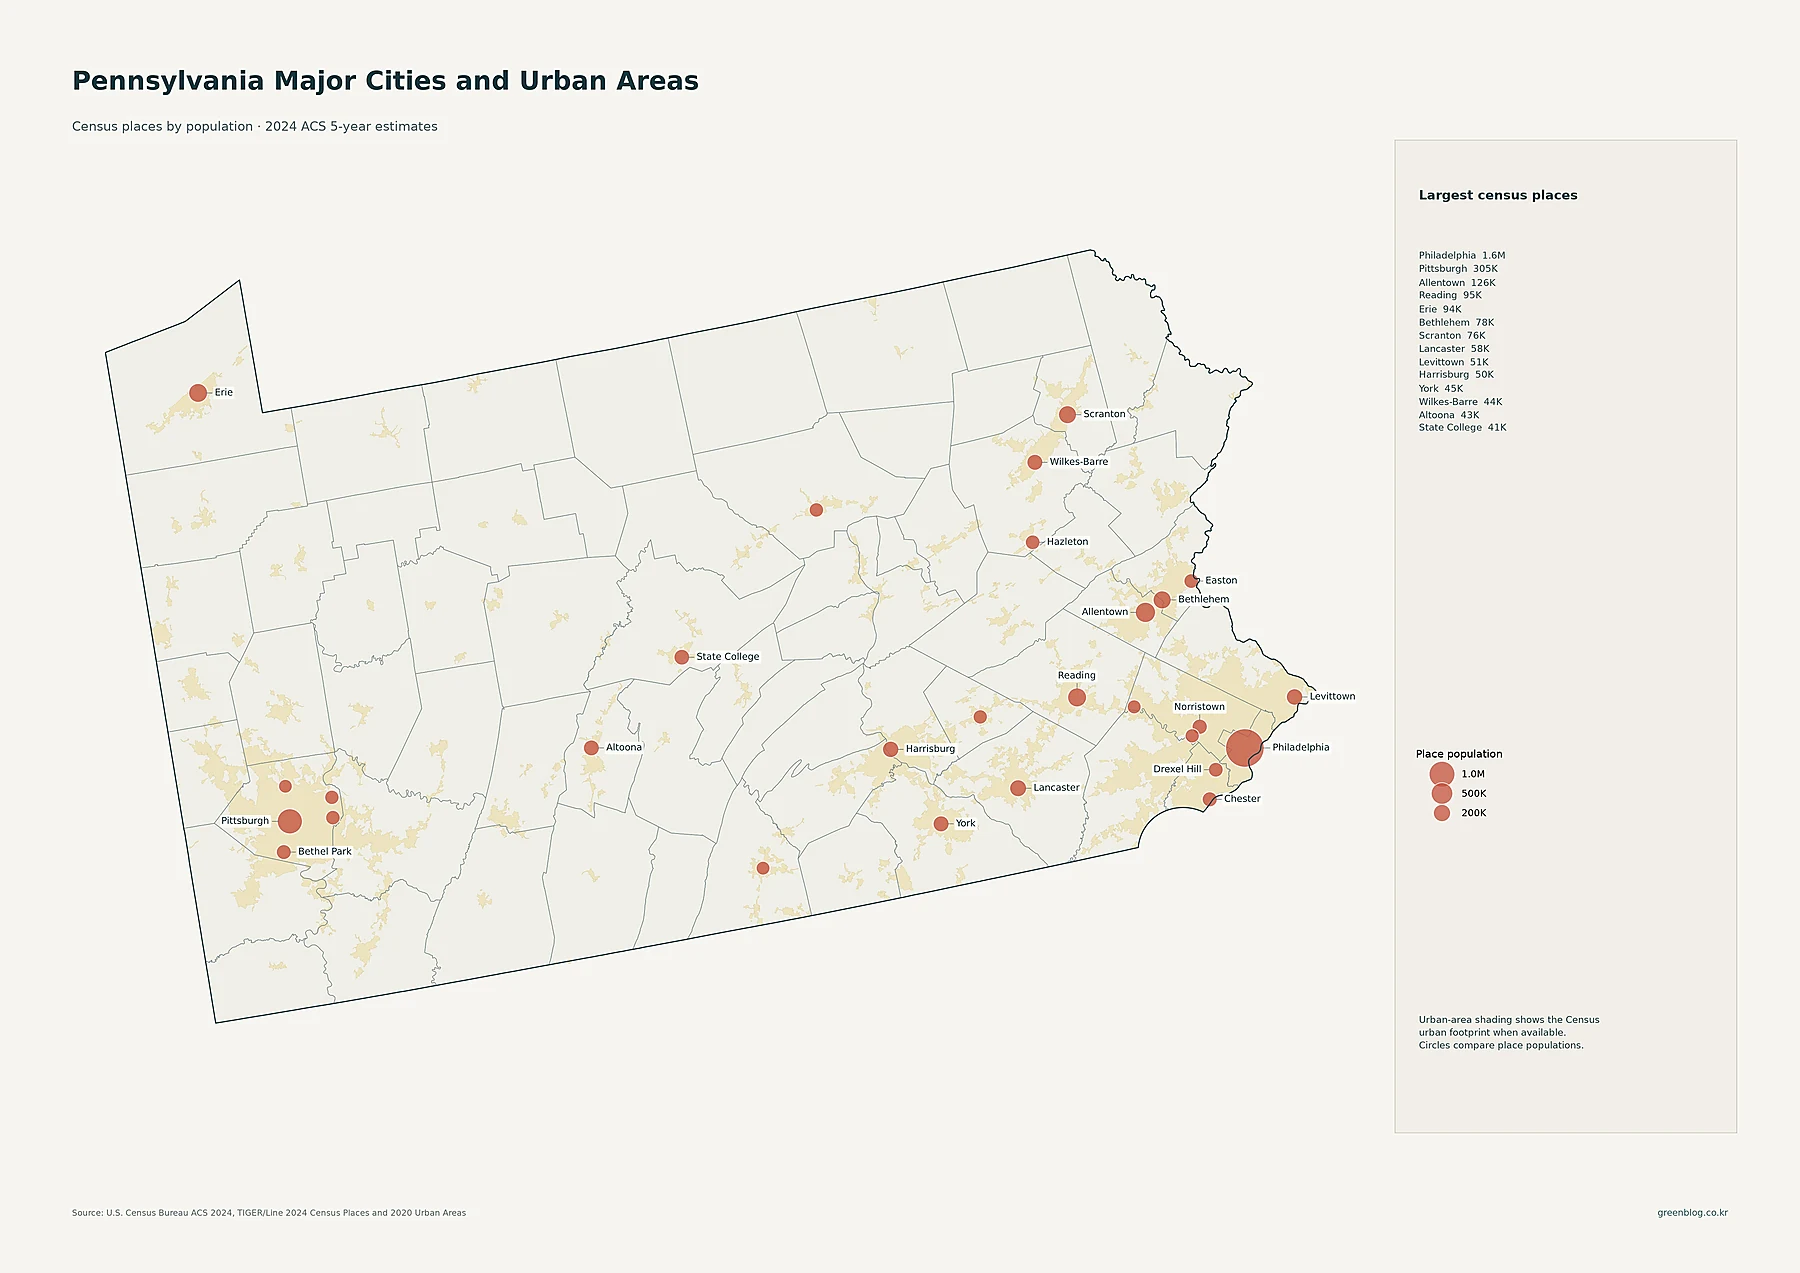
Philadelphia has 1,579,706 residents in the supplied census-place data. Pittsburgh is second at 304,759, followed by Allentown at 125,976. Reading has 95,242 residents, Erie 93,850, Bethlehem 77,956, and Scranton 76,033. Lancaster has 57,719, Levittown 50,926, Harrisburg 50,287, York 44,938, Wilkes-Barre 44,423, Altoona 43,196, and State College 41,050.
These proportional circles represent total place population, not density. Philadelphia’s circle is exceptionally large because far more residents live within its city boundary than in any other census place shown. Pittsburgh is the clear western city anchor, but much of the Pittsburgh metropolitan population lives outside the city proper. That is why the Allegheny County total is far larger than Pittsburgh’s census-place population.
Philadelphia and Allegheny counties anchor opposite ends of the county population map
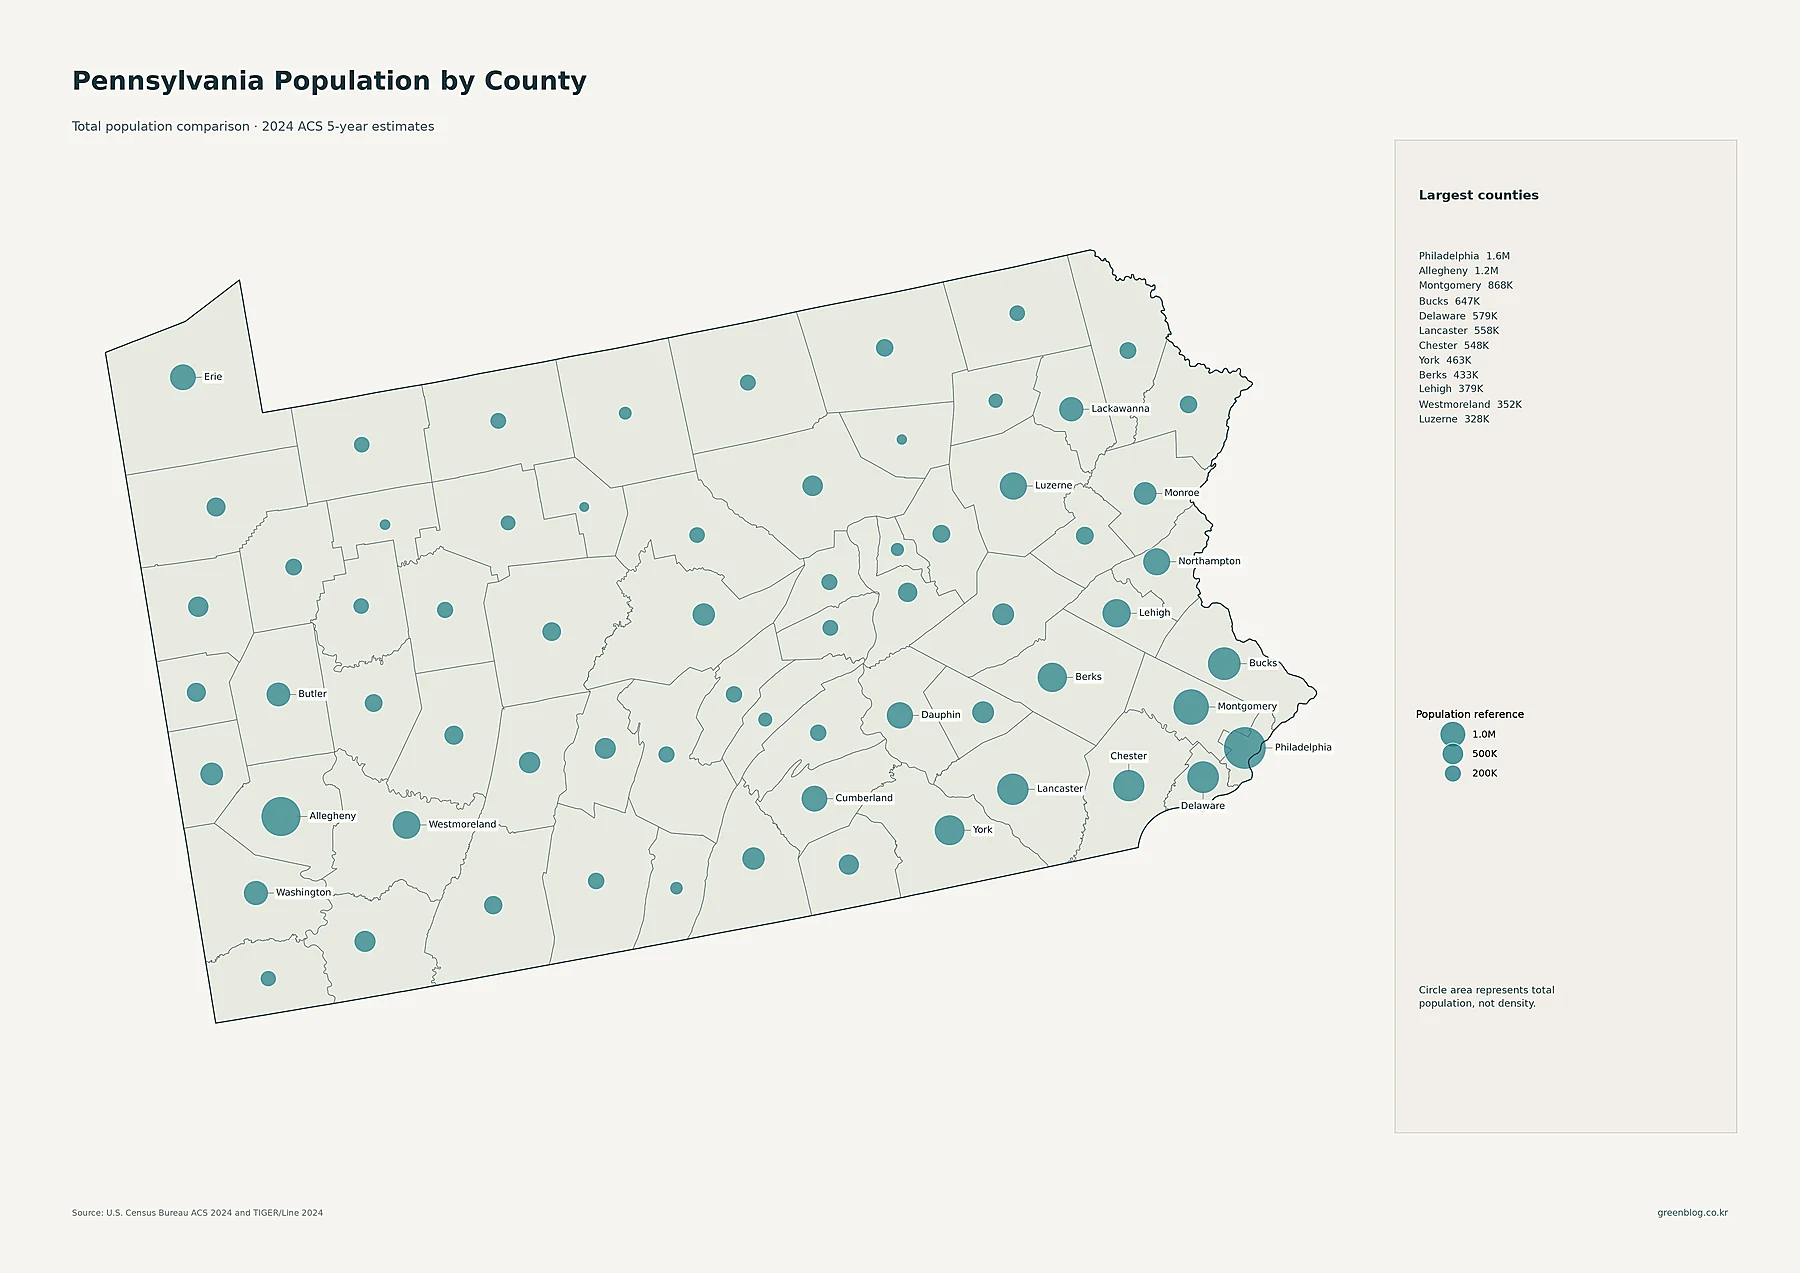
Philadelphia County has the largest current county population at 1,579,706. Allegheny County follows with 1,238,177. Montgomery County has 867,573 residents, Bucks 647,461, Delaware 579,222, Lancaster 557,931, Chester 547,840, York 462,924, and Berks 433,015. Lehigh has 378,792, Westmoreland 352,500, Luzerne 327,675, Northampton 318,580, Dauphin 289,593, and Erie 269,052.
The southeastern concentration is obvious because several of the state’s largest counties sit next to one another. The western map is dominated by Allegheny, with Westmoreland and Butler adding smaller but important totals around it. The Lehigh Valley, northeast, and south-central corridor contain several medium-sized county populations. County totals show how many people live inside each boundary, but they do not account for the size of that boundary.
Philadelphia County’s average density exceeds 11,700 people per square mile
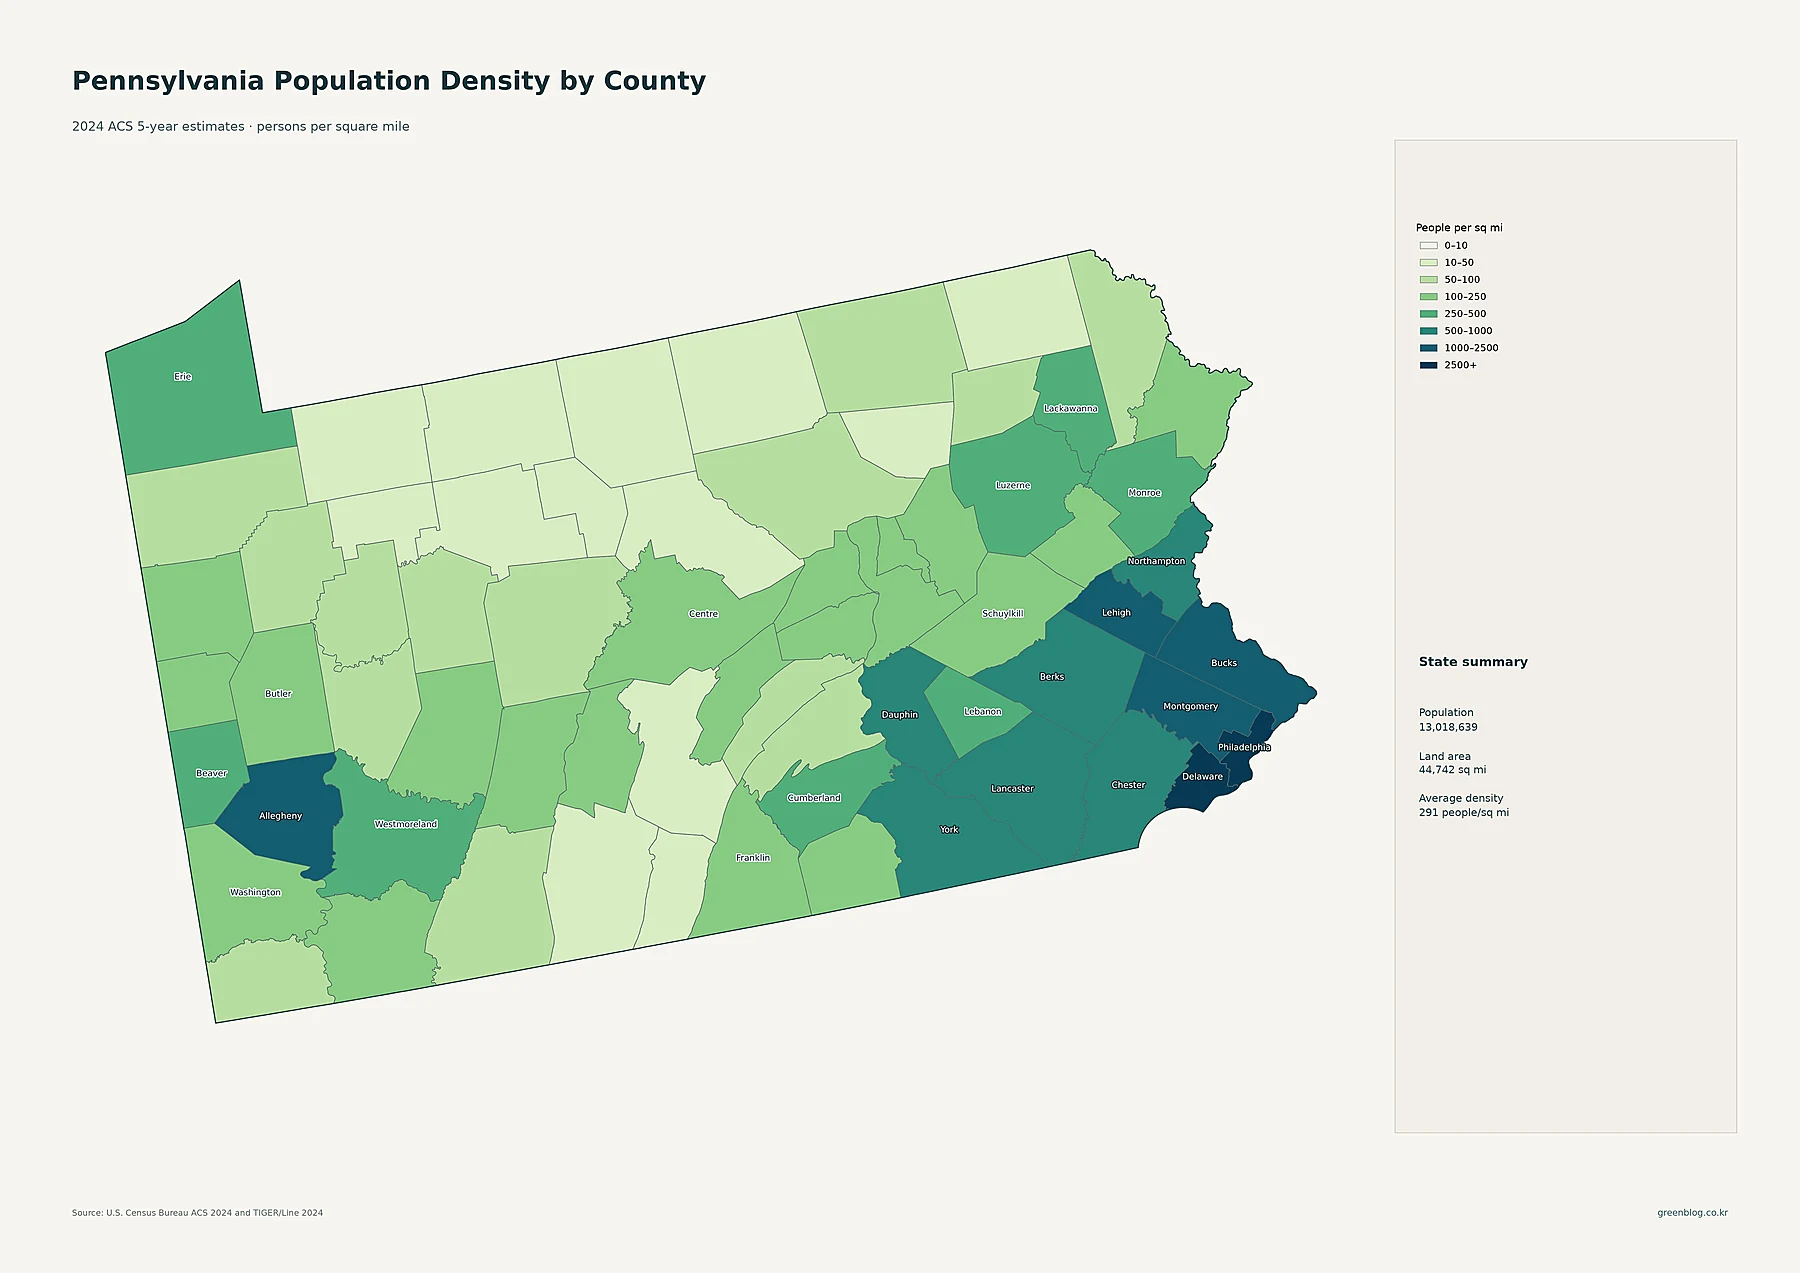
Philadelphia County has the highest county-average density at about 11,760.3 people per square mile. Delaware County is second at about 3,151.2. Montgomery County averages about 1,796.5 and Allegheny about 1,696.2. Lehigh is about 1,096.9, Bucks 1,071.2, Northampton 861.5, and Chester 729.9 people per square mile.
Lancaster County averages about 591.1 people per square mile, Dauphin 551.7, York 511.9, Berks 505.6, and Cumberland 491.9. The sparsest county averages are dramatically lower: Cameron is about 11.2, Sullivan 13.1, and Forest 15.7 people per square mile. Pennsylvania’s statewide average of roughly 291 therefore combines one of the country’s densest urban counties with broad rural and forested areas that are only lightly settled.
| Measure | Leading area | Value in supplied data |
|---|---|---|
| State population | Pennsylvania | 13,018,639 |
| Largest county population | Philadelphia County | 1,579,706 |
| Highest county density | Philadelphia County | about 11,760.3/sq mi |
| Fastest 2010–2020 growth | Cumberland County | +10.2% |
| Largest 2010–2020 decline | Susquehanna County | -11.4% |
South-central and eastern counties led growth during the 2010s
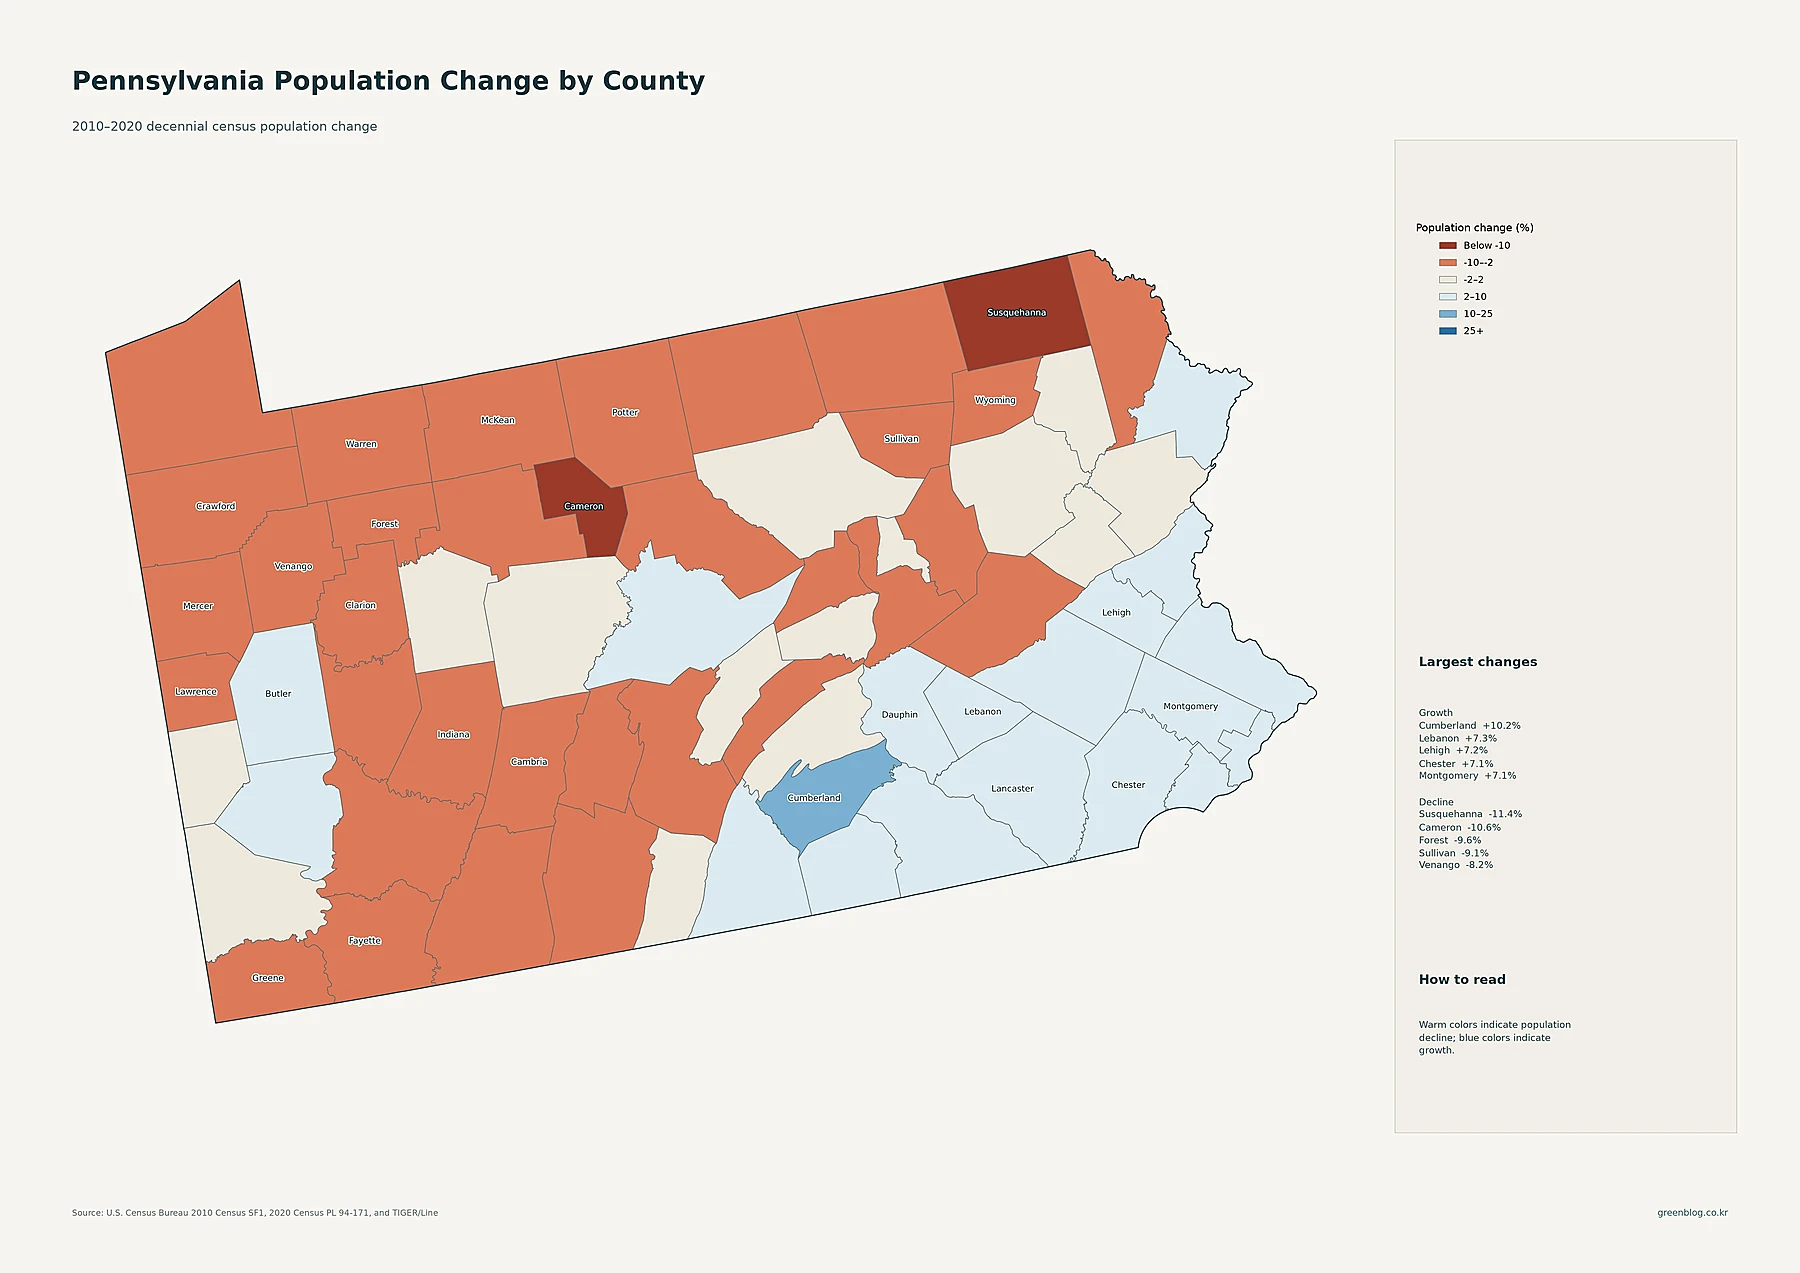
Cumberland County recorded the fastest percentage growth in the supplied decade data. Its population increased from 235,406 in 2010 to 259,469 in 2020, a gain of about 10.2%. Lebanon grew 7.3%, Lehigh 7.2%, Chester 7.1%, Montgomery 7.1%, Dauphin 6.8%, and Lancaster 6.5%. Philadelphia County rose from 1,526,006 to 1,603,797, an increase of about 5.1%.
The map therefore highlights a belt of growth around Harrisburg and across parts of eastern and southeastern Pennsylvania. Cumberland, Dauphin, and Lebanon stand out in the south-central region. Chester and Montgomery grew around the Philadelphia metro, while Lehigh and Northampton added population in the Lehigh Valley. Butler County, at about +5.4%, is one of the stronger growth counties in western Pennsylvania.
The strongest declines appear in northern and north-central counties. Susquehanna County fell from 43,356 residents in 2010 to 38,434 in 2020, a decrease of about 11.4%. Cameron declined 10.6%, Forest 9.6%, Sullivan 9.1%, Venango 8.2%, Wyoming 7.8%, and Warren 7.7%. These are 2010–2020 decennial-census changes and should not be presented as changes in the 2024 ACS estimate.
Pennsylvania’s settlement pattern combines an extreme southeast core, a western metro anchor, and a growing south-central corridor
Taken together, the maps separate several important dimensions of Pennsylvania’s population geography. Philadelphia is the largest census place and Philadelphia County leads both county population and county-average density. Pittsburgh is the major western city, while Allegheny County contains the state’s second-largest county population. The Lehigh Valley, Reading, Lancaster, Harrisburg, York, Scranton–Wilkes-Barre, Erie, and State College create additional regional concentrations across the state.
The historical map adds a different ranking. Cumberland grew fastest in percentage terms during the 2010s, with Lebanon, Lehigh, Chester, Montgomery, Dauphin, and Lancaster also among the strongest gains. At the same time, Susquehanna, Cameron, Forest, Sullivan, and several other northern counties lost population. The most accurate reading therefore keeps place totals, county totals, county density, tract-level density, and historical population change separate. Together they explain both where Pennsylvanians live now and which parts of the state changed most during the decade.
Download the Pennsylvania population map collection
The ZIP includes detailed census-tract density, major cities and urban areas, county population totals, 2010–2020 county population change, and county population density.
FAQ
Which Pennsylvania county has the largest population?
Philadelphia County is the largest in the supplied 2024 ACS 5-year estimates, with 1,579,706 residents. Allegheny County has 1,238,177 and Montgomery County 867,573.
Which Pennsylvania county has the highest population density?
Philadelphia County has the highest county-average density at about 11,760.3 people per square mile. Delaware County is about 3,151.2 and Montgomery County about 1,796.5 people per square mile.
Which Pennsylvania county grew fastest from 2010 to 2020?
Cumberland County grew about 10.2%, followed by Lebanon at 7.3%, Lehigh at 7.2%, and Chester and Montgomery at about 7.1%. These percentages compare the 2010 and 2020 decennial censuses.
Related Maps
Sources
- U.S. Census Bureau — American Community Survey (ACS): 2024 5-year population and density estimates
- U.S. Census Bureau — TIGER/Line Shapefiles: 2024 state, county, census tract, place geography and mapped boundaries
- U.S. Census Bureau — Decennial Census: 2010 and 2020 county population comparison
Green Map creates custom-edited map images using open geographic data sources such as geoBoundaries, Natural Earth, OpenStreetMap, and government open data.
These maps are edited visual materials, not raw data files, and are provided for education, documents, presentations, and graphic reference.