Oklahoma’s population is organized around two large metropolitan anchors rather than spread evenly across the state. Oklahoma City and its suburbs form the broadest concentration in central Oklahoma. Tulsa and nearby Broken Arrow, Owasso, Bixby, and Jenks create a second dense cluster in the northeast. Lawton, Enid, Stillwater, Muskogee, Bartlesville, and Ardmore stand out as smaller regional centers separated by much more lightly populated land.
The supplied 2024 ACS 5-year estimates put Oklahoma’s population at 4,028,634. The county-density map reports about 68,597 square miles of land and a statewide average of roughly 59 people per square mile. That average hides a large internal gap: Tulsa and Oklahoma counties exceed 1,100 people per square mile, while several western counties average fewer than five. The maps also show that the largest county population, the highest county density, and the fastest 2010–2020 growth belong to three different counties.
Table of Contents
The tract map makes Oklahoma City and Tulsa the two dominant settlement clusters
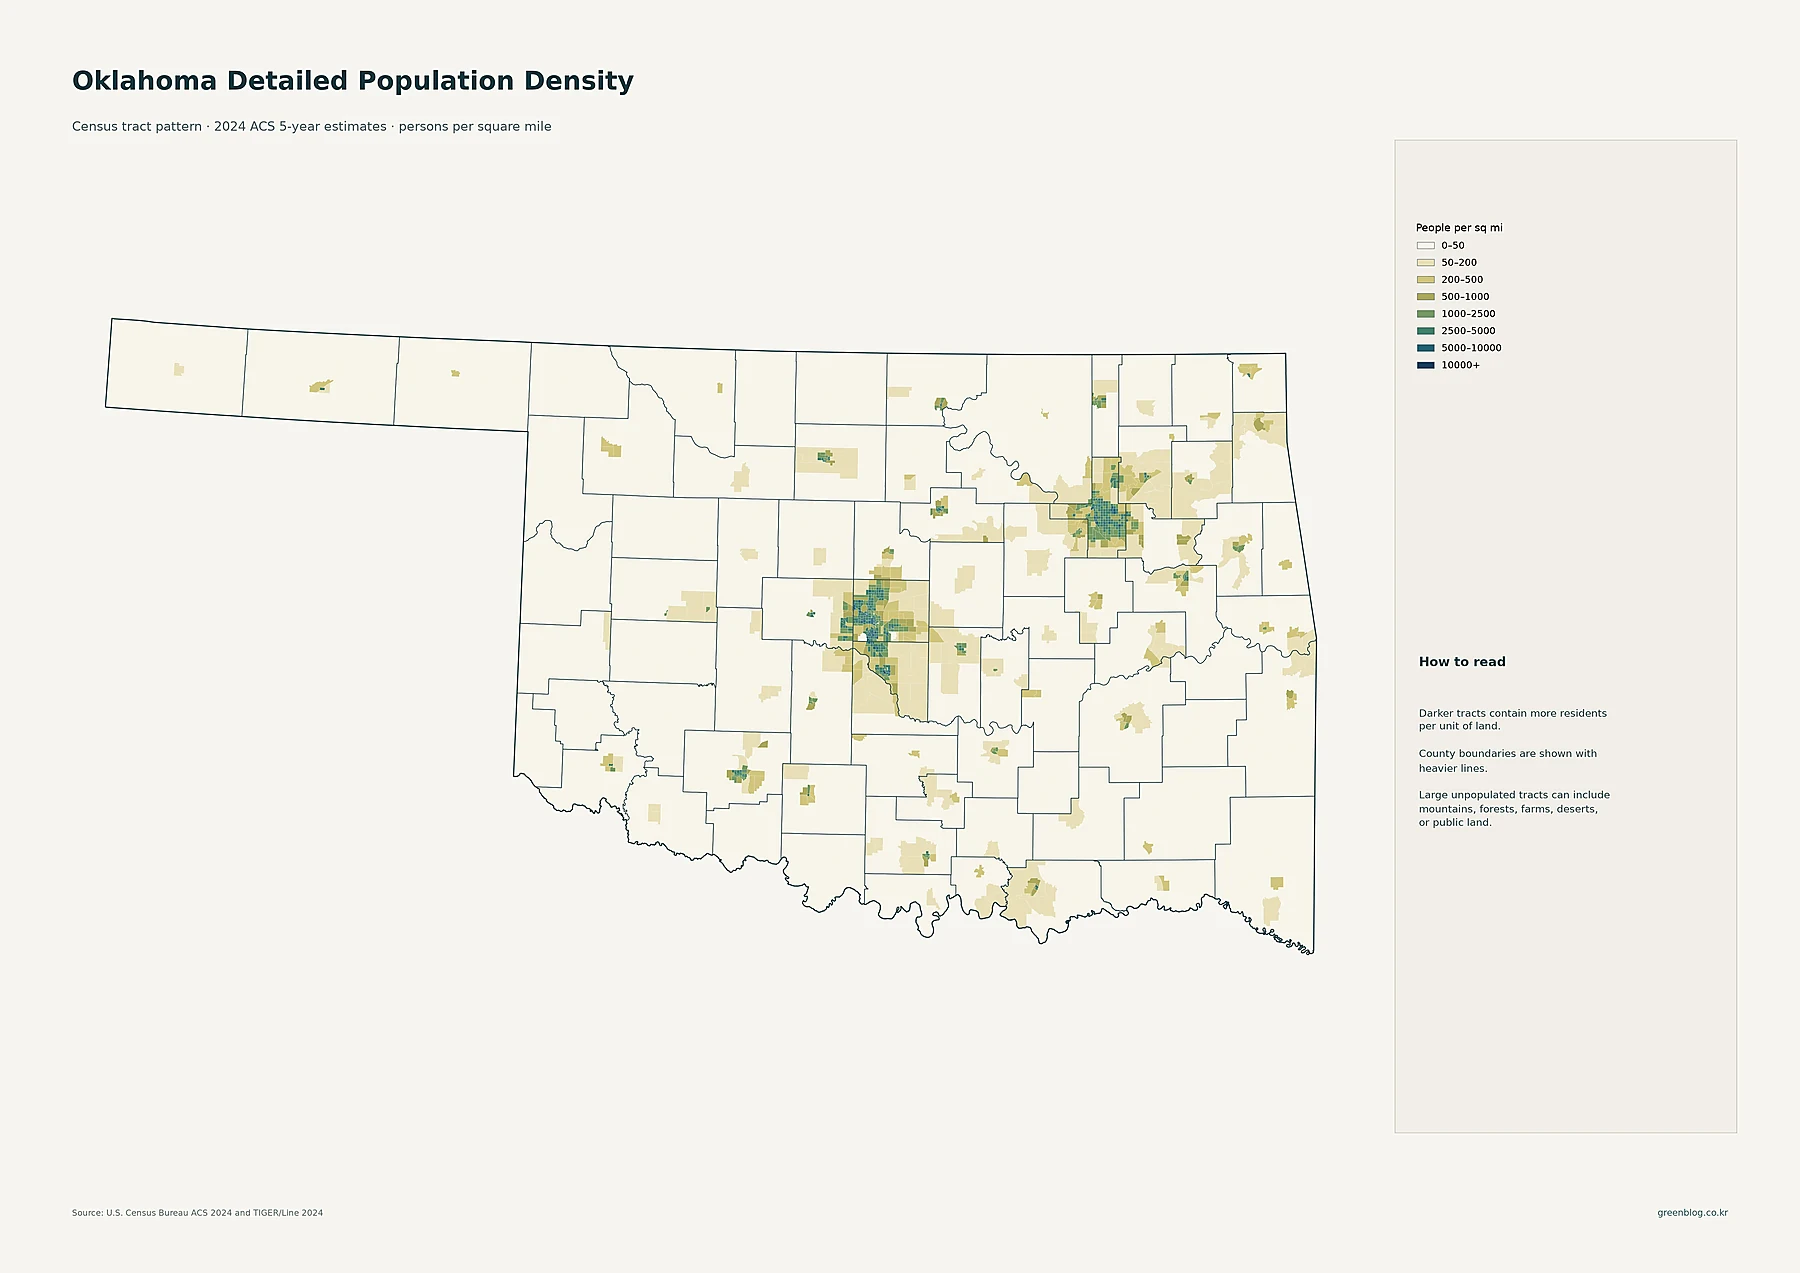
The broadest continuous group of darker tracts surrounds Oklahoma City. Dense tracts across Oklahoma County extend south toward Moore and Norman in Cleveland County and west toward Yukon in Canadian County. Edmond and Midwest City create additional concentrations around the metropolitan core. The pattern shows a large central settlement area crossing county and municipal boundaries rather than a single compact city.
Northeastern Oklahoma has a second strong cluster around Tulsa. Tulsa’s dense tracts are joined by higher-density areas around Broken Arrow, Owasso, Bixby, and Jenks. Stillwater and Enid appear as smaller concentrations farther west, while Lawton stands out in the southwest. Muskogee, Shawnee, Bartlesville, and Ardmore are also visible as localized pockets of settlement. In contrast, most of the Panhandle and large parts of western Oklahoma remain in the lightest density classes.
Census tracts are smaller than counties, so they reveal the urban-rural contrast inside a single county. A county can have a moderate or high average density while still containing extensive low-density land outside its cities. The tract layer is therefore the best map in the set for seeing the actual footprint of Oklahoma’s built-up population centers.
Oklahoma City is the largest place, while Tulsa anchors the northeast
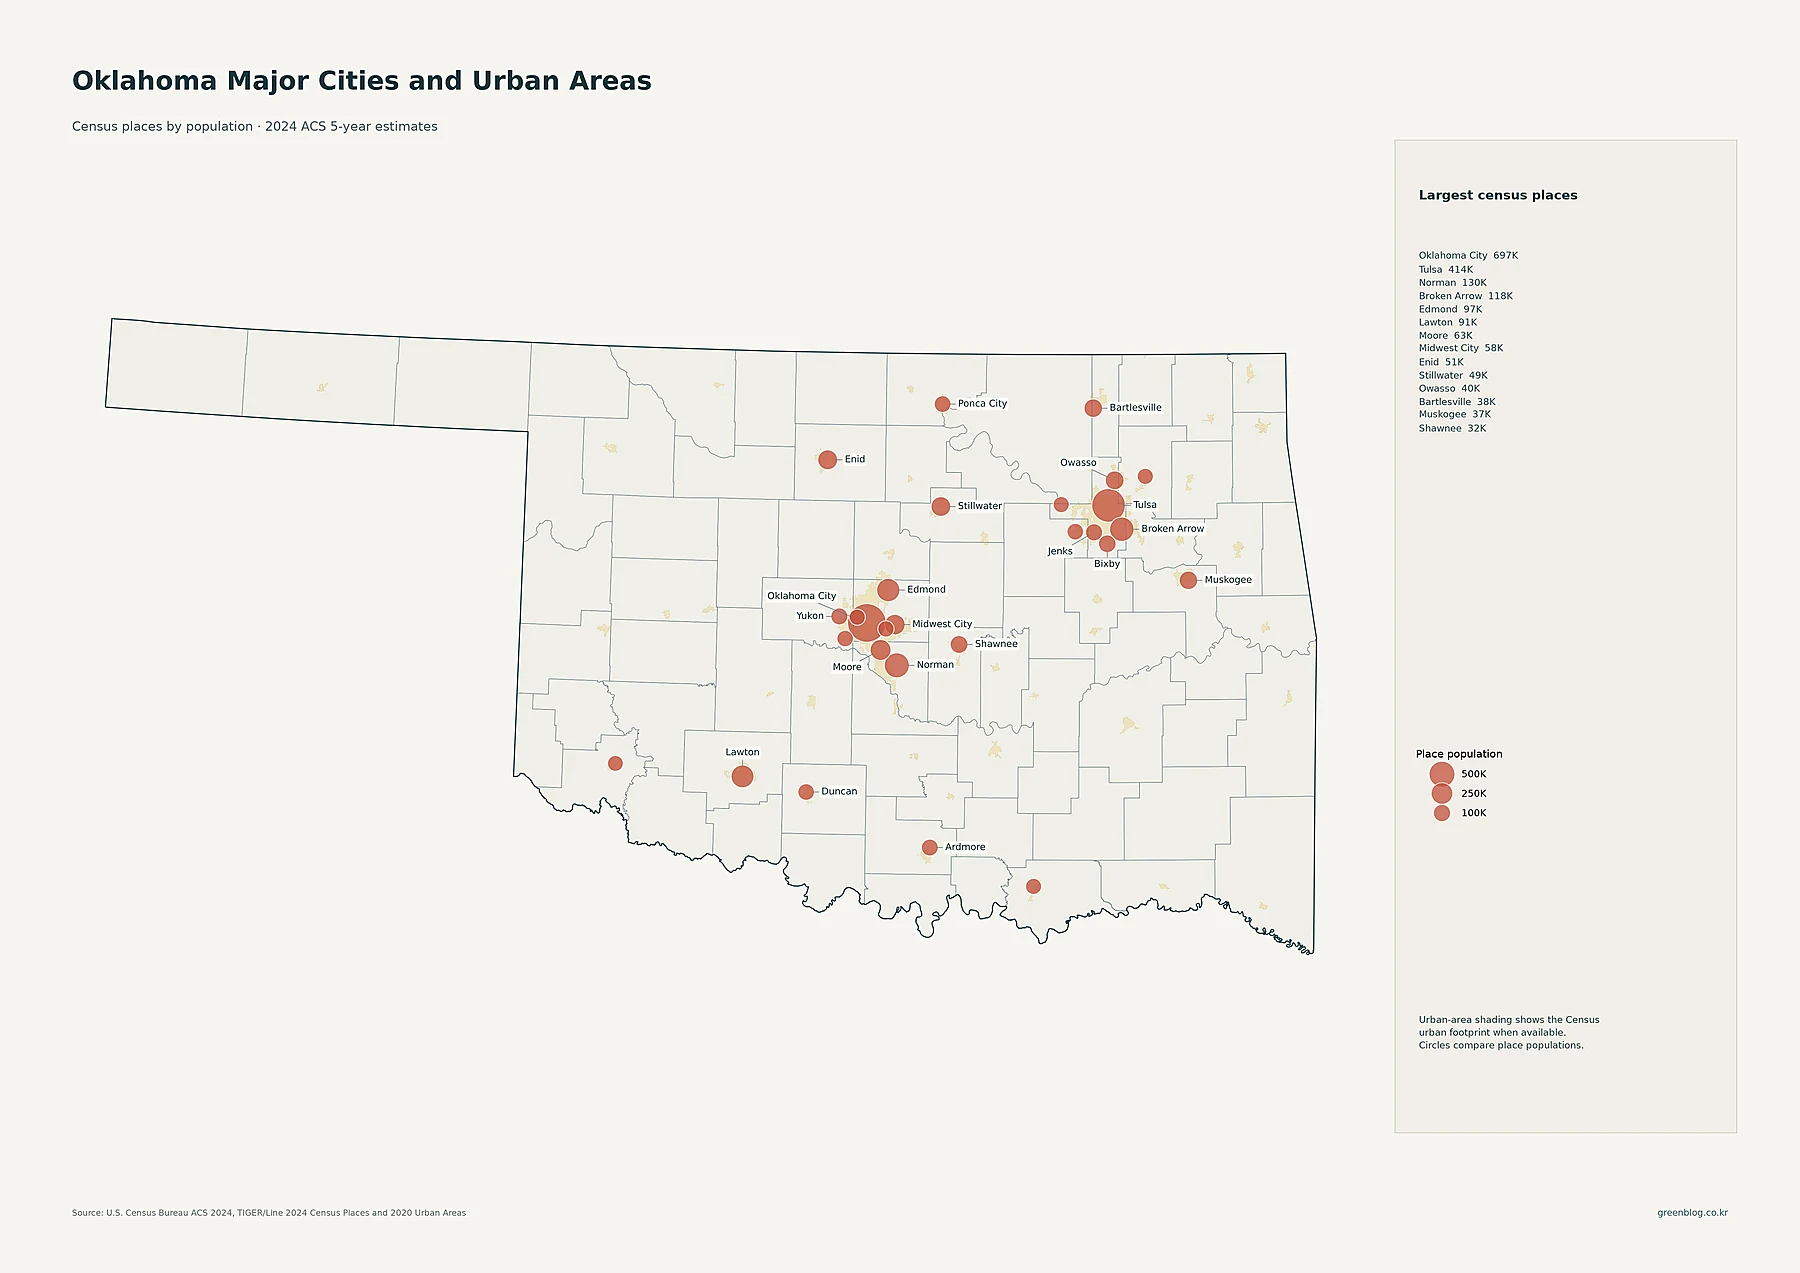
Oklahoma City has 697,125 residents in the supplied census-place data, making it the largest place in the state. Tulsa is second at 413,794. Norman has 129,672 residents, Broken Arrow 118,180, Edmond 96,825, and Lawton 90,595. Moore has 63,420, Midwest City 58,297, Enid 50,653, and Stillwater 49,269. Owasso has 40,151, Bartlesville 37,878, Muskogee 36,758, and Shawnee 31,671.
The proportional circles measure total place population, not density. Oklahoma City’s large circle indicates the largest municipal-scale population in the supplied data, but it does not automatically mean the highest number of residents per square mile. The county-density map, for example, places Tulsa County slightly above Oklahoma County. The city map is best for comparing the size and spacing of Oklahoma’s named population centers.
Oklahoma County has the largest county population, followed by Tulsa and Cleveland
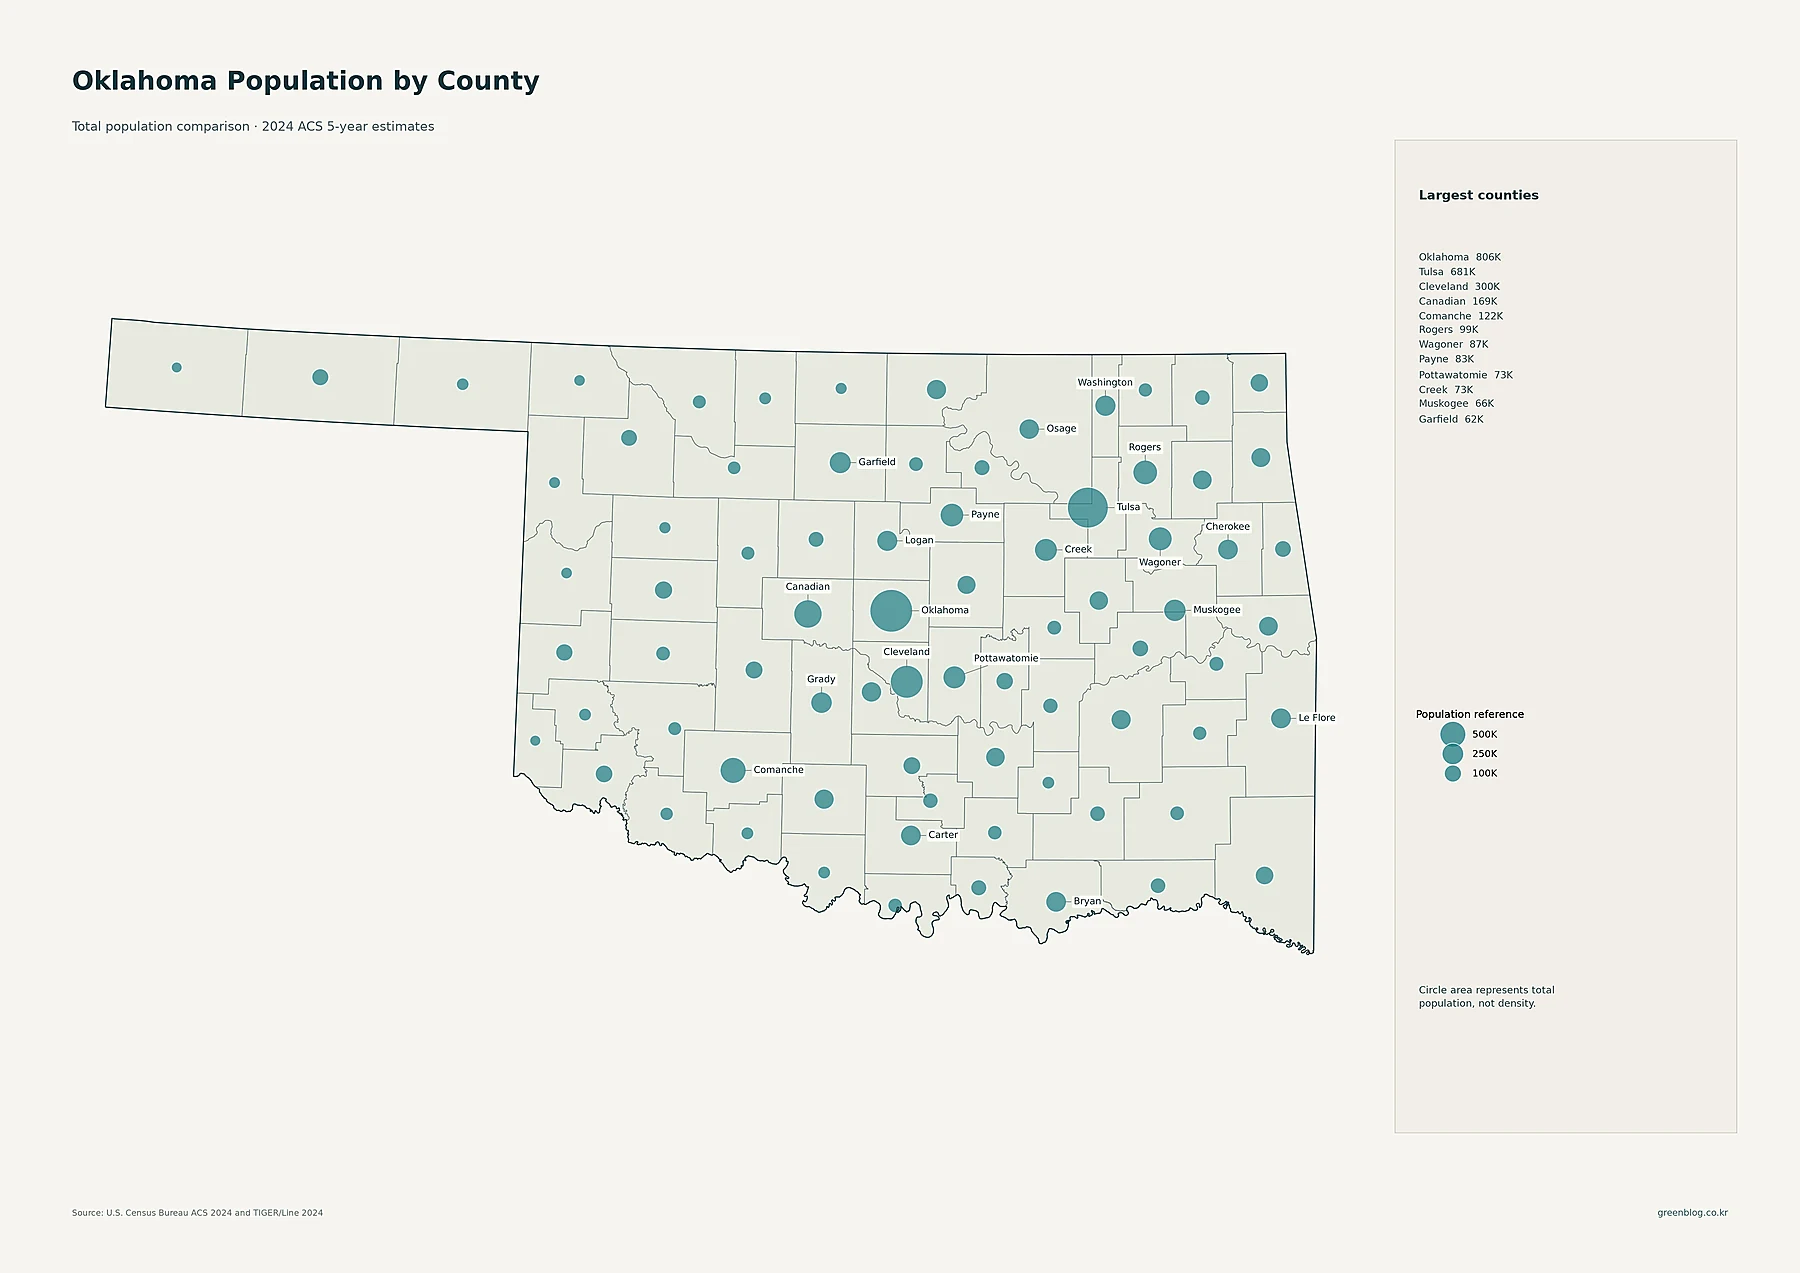
Oklahoma County has 806,199 residents, the largest county total in the supplied 2024 ACS data. Tulsa County follows at 680,794, and Cleveland County has 300,047. Canadian County has 168,985 residents, Comanche 121,825, Rogers 98,610, Wagoner 86,609, and Payne 82,972. Pottawatomie has 73,463, Creek 72,830, Muskogee 66,444, and Garfield 62,146.
The largest circles form two recognizable groups. Oklahoma, Cleveland, and Canadian counties cluster around the Oklahoma City metro, while Tulsa, Rogers, Wagoner, and Creek define much of the northeastern population concentration. Comanche stands out around Lawton in the southwest, and Payne and Garfield mark the Stillwater and Enid areas. County totals show where the most people live, but they do not account for land area.
Tulsa County is the densest county, narrowly ahead of Oklahoma County
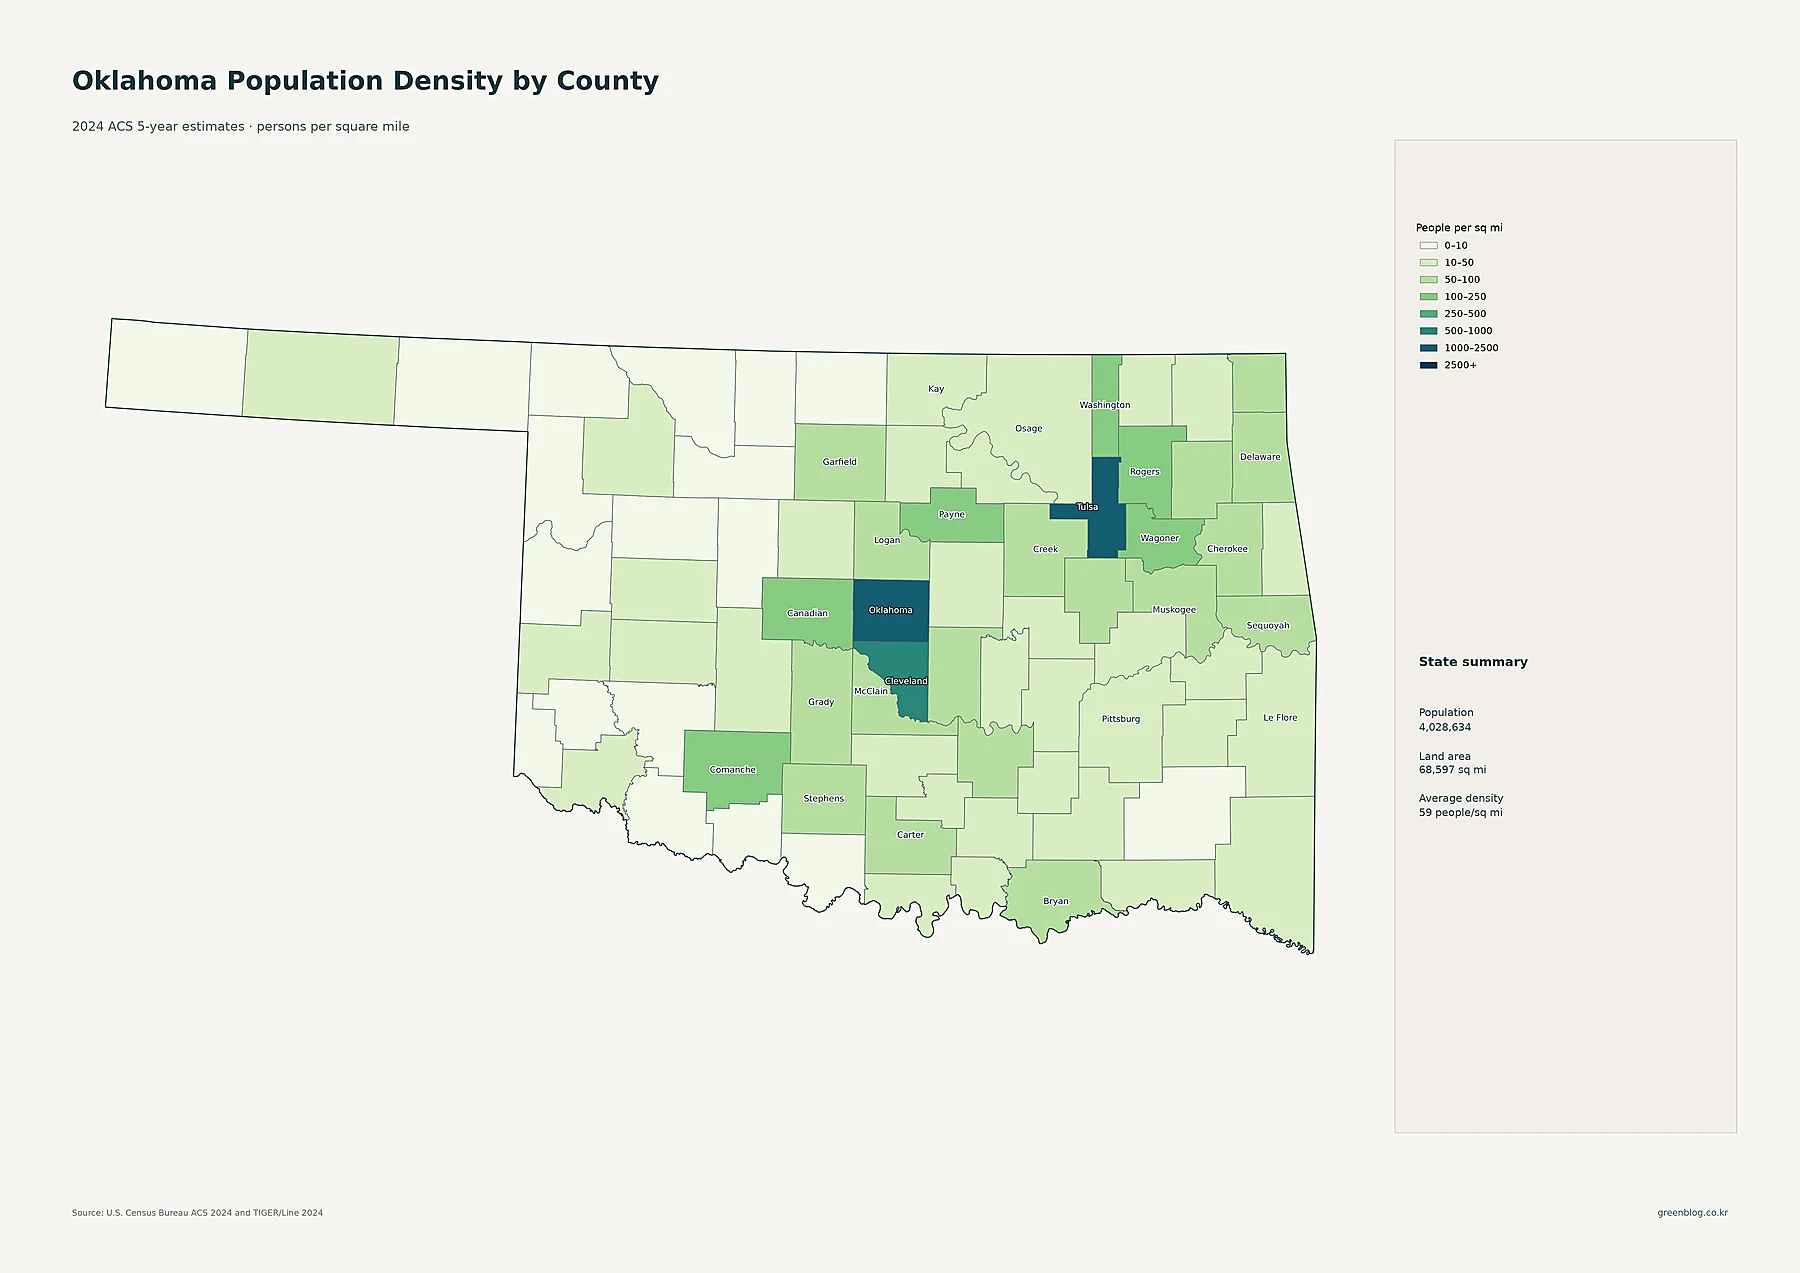
Tulsa County has the highest average density at about 1,193.9 people per square mile. Oklahoma County is close behind at about 1,137.3. Cleveland County averages about 556.8. The next tier includes Canadian at 188.5, Wagoner at 154.1, Rogers at 145.9, Washington at 128.3, Payne at 121.1, and Comanche at 113.9 people per square mile.
The sparsest counties are dramatically lower. Cimarron County averages about 1.2 people per square mile. Beaver is about 2.8, Roger Mills 2.9, Ellis 3.0, and Harper 3.1. Many Panhandle and western counties remain below 10 people per square mile. The statewide average of 59 therefore combines two highly concentrated metropolitan counties with broad rural areas that are only lightly settled.
| Measure | Leading area | Value in supplied data |
|---|---|---|
| State population | Oklahoma | 4,028,634 |
| Largest county population | Oklahoma County | 806,199 |
| Highest county density | Tulsa County | about 1,193.9/sq mi |
| Fastest 2010–2020 growth | Canadian County | +33.6% |
| Largest 2010–2020 decline | Blaine County | -26.9% |
Growth during the 2010s was strongest around the Oklahoma City metro
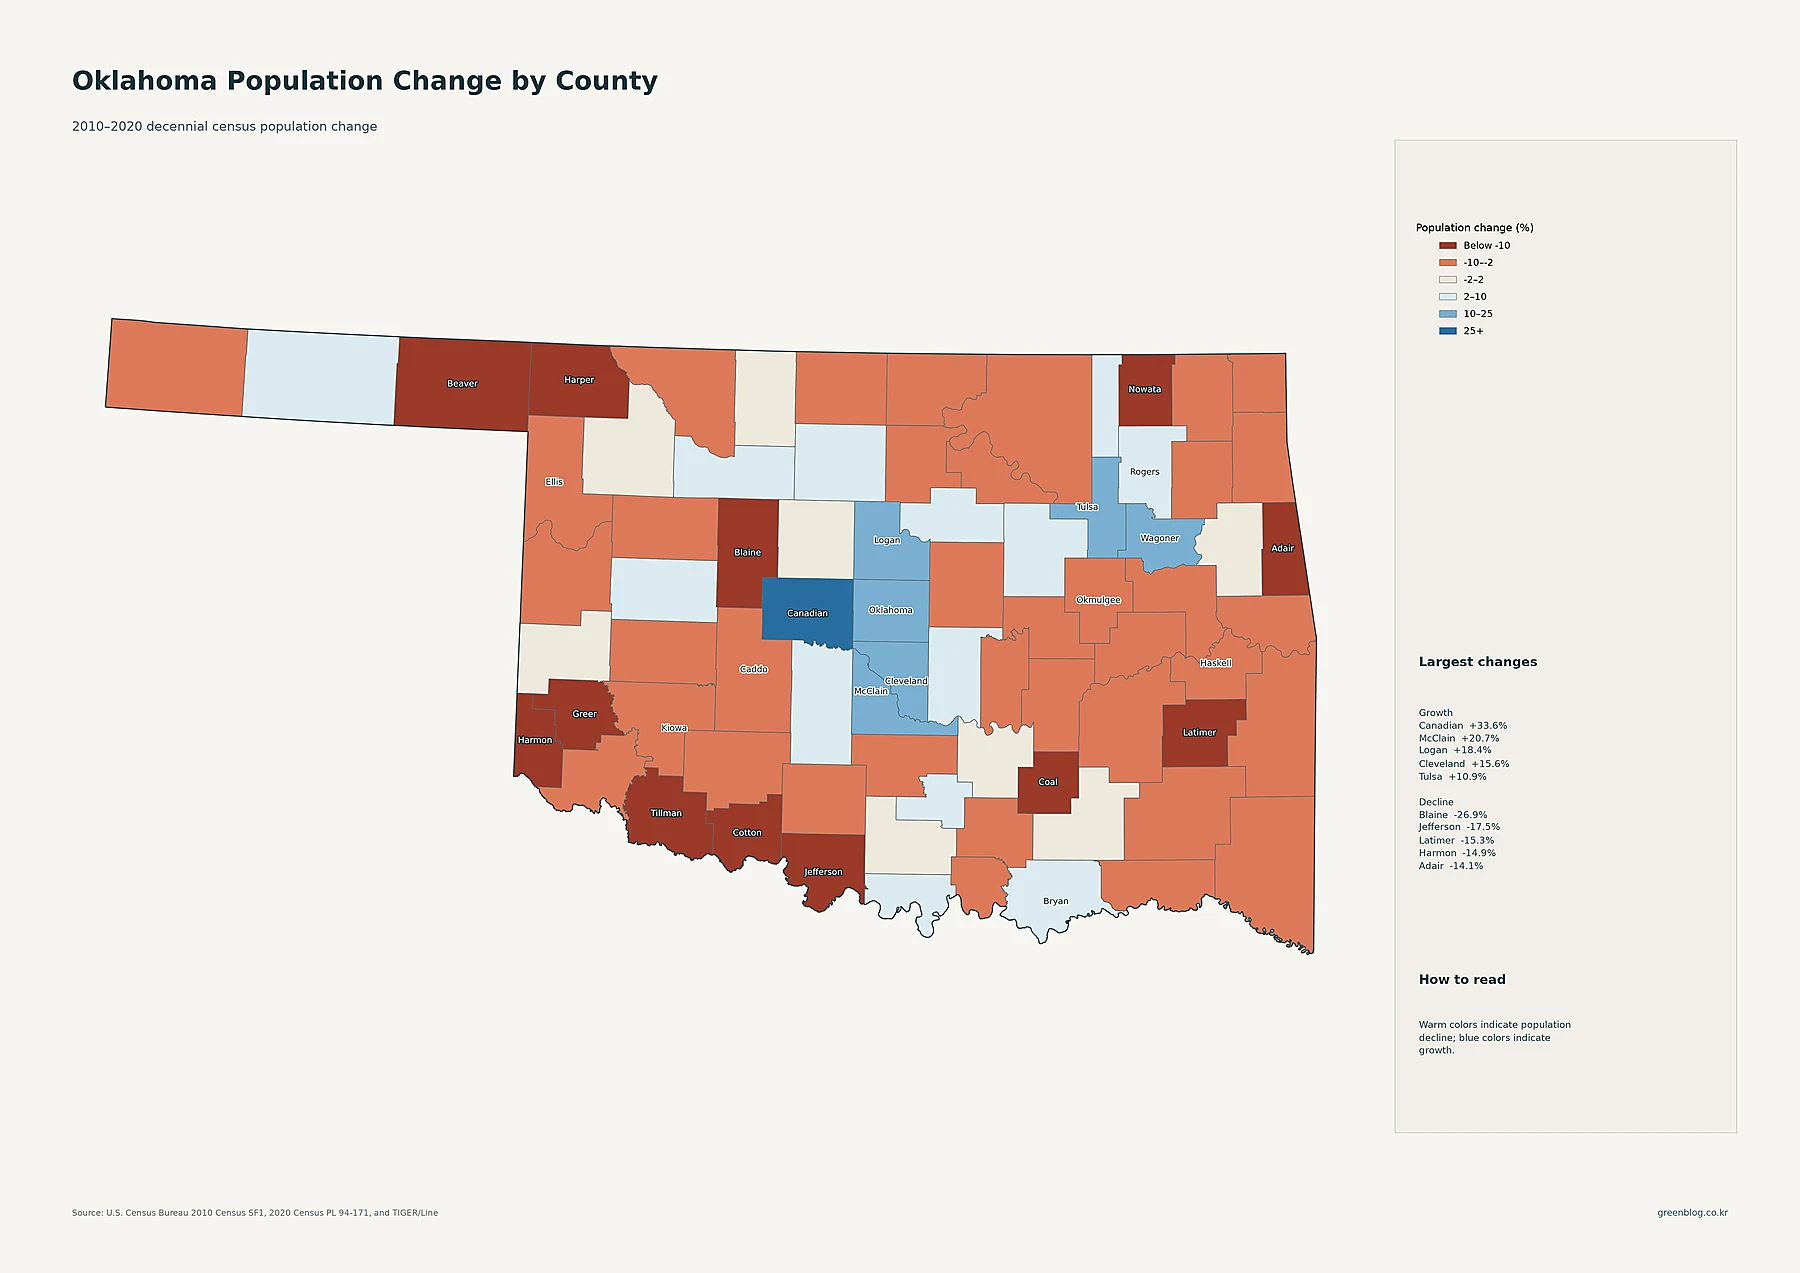
Canadian County recorded the fastest percentage increase in the supplied decade data. Its population rose from 115,541 in 2010 to 154,405 in 2020, a gain of about 33.6%. McClain County grew 20.7%, Logan 18.4%, and Cleveland 15.6%. Tulsa County increased 10.9%, Oklahoma County 10.8%, Wagoner 10.8%, and Rogers 9.6%.
The geography of growth is clear around both major metros. Canadian, McClain, Logan, Cleveland, and Oklahoma counties form a central cluster of growth around Oklahoma City. Tulsa, Wagoner, and Rogers create another group around Tulsa. Current size and growth rate are not the same measure: Oklahoma County is the state’s largest county today, but Canadian County grew more than three times as fast in percentage terms during the 2010s.
Several counties moved sharply in the opposite direction. Blaine County fell from 11,943 residents in 2010 to 8,735 in 2020, a decline of about 26.9%. Jefferson declined 17.5%, Latimer 15.3%, Harmon 14.9%, and Adair 14.1%. Tillman, Greer, Nowata, Harper, Coal, and Beaver also posted double-digit declines. These percentages describe the 2010–2020 decennial-census period and should not be presented as changes in the 2024 ACS estimate.
Oklahoma’s population pattern combines two metro concentrations with fast suburban growth and a sparse west
Across all five maps, Oklahoma City and Tulsa remain the central features of the state’s current settlement pattern. Oklahoma City is the largest census place, Oklahoma County has the largest county population, and Tulsa County has the highest county-average density. Smaller regional centers such as Lawton, Stillwater, Enid, Muskogee, and Bartlesville create additional pockets of population across the state.
The change map adds a different story: counties around Oklahoma City, especially Canadian, McClain, Logan, and Cleveland, grew rapidly during the 2010s, while Blaine and several rural counties lost population. The most accurate reading therefore keeps place totals, county totals, county density, tract-level density, and historical population change separate. Together they show both where Oklahomans live now and which county patterns shifted most during the decade.
Download the Oklahoma population map collection
The ZIP includes detailed census-tract density, major cities and urban areas, county population totals, 2010–2020 county population change, and county population density.
FAQ
Which Oklahoma county has the largest population?
Oklahoma County is the largest in the supplied 2024 ACS 5-year estimates, with 806,199 residents. Tulsa County has 680,794 and Cleveland County 300,047.
Which Oklahoma county has the highest population density?
Tulsa County has the highest county-average density at about 1,193.9 people per square mile. Oklahoma County is about 1,137.3 and Cleveland County about 556.8 people per square mile.
Which Oklahoma county grew fastest from 2010 to 2020?
Canadian County grew about 33.6%, followed by McClain at 20.7%, Logan at 18.4%, and Cleveland at 15.6%. These percentages compare the 2010 and 2020 decennial censuses.
Related Maps
Sources
- U.S. Census Bureau — American Community Survey (ACS): 2024 5-year population and density estimates
- U.S. Census Bureau — TIGER/Line Shapefiles: 2024 state, county, census tract, place geography and mapped boundaries
- U.S. Census Bureau — Decennial Census: 2010 and 2020 county population comparison
Green Map creates custom-edited map images using open geographic data sources such as geoBoundaries, Natural Earth, OpenStreetMap, and government open data.
These maps are edited visual materials, not raw data files, and are provided for education, documents, presentations, and graphic reference.