Ohio’s population geography is built around several major urban regions rather than one dominant metropolitan area. Columbus anchors the center of the state. Cleveland, Akron, and Canton form a dense northeastern system, Toledo stands out in the northwest, and Cincinnati and Dayton create major concentrations in the southwest. The supplied 2024 ACS 5-year estimates place Ohio’s population at 11,810,293. The county-density map reports about 40,859 square miles of land and an average density near 289 people per square mile.
That statewide average hides important differences. Franklin County contains the largest current county population, Cuyahoga County has the highest county-average density, and Delaware County recorded the fastest 2010–2020 growth rate. Those are three different measures. The map set is most useful when total population, density, detailed tract settlement, and historical change are kept separate instead of treating every large circle or dark color as the same kind of result.
Table of Contents
Columbus and northeast Ohio form the strongest tract-level density concentrations
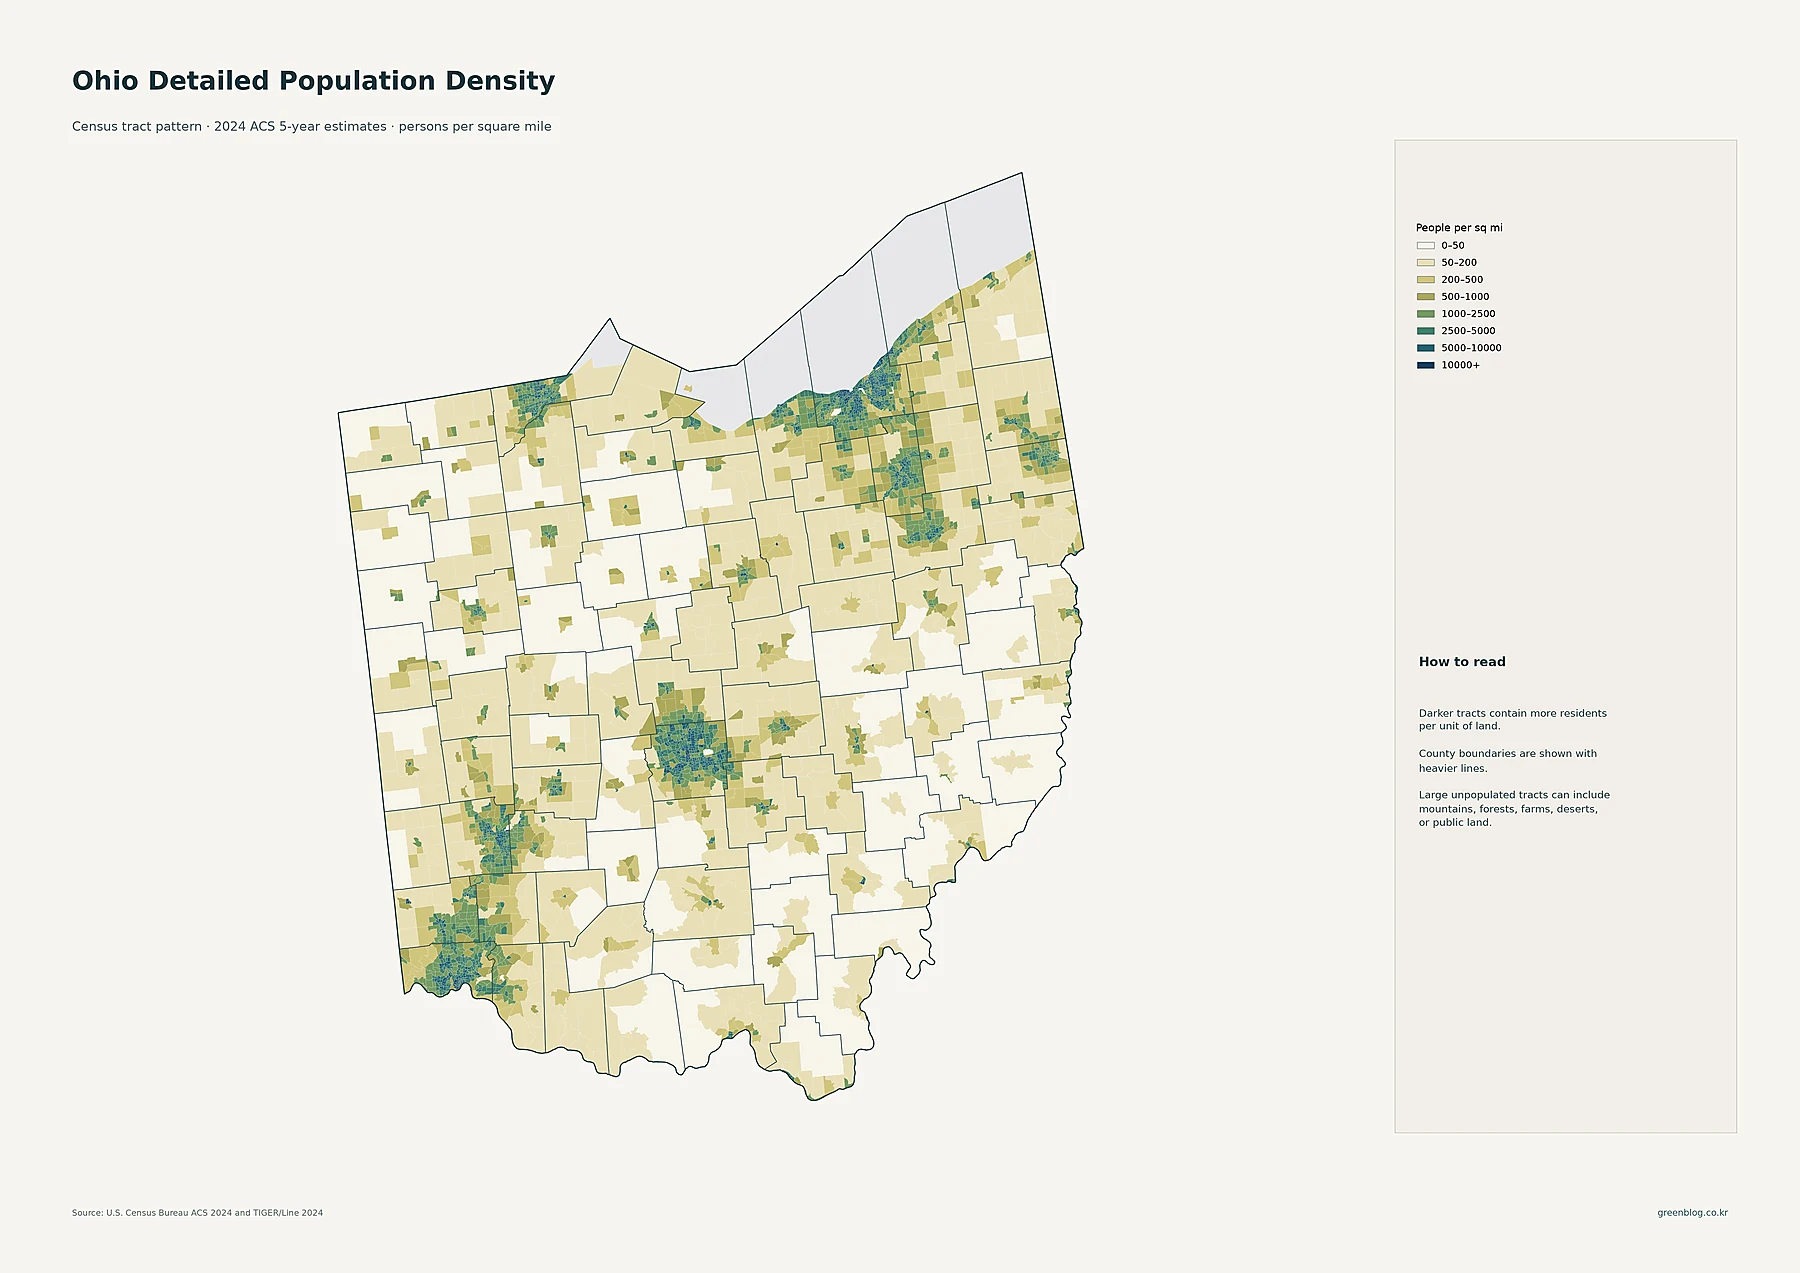
The Columbus area appears as a broad, continuous cluster of darker tracts in central Ohio. High-density tracts fill much of Franklin County and extend outward into suburban areas, including north toward Delaware County. The pattern shows that Columbus is not simply a single dense point. Its population footprint reaches across a wider central Ohio settlement zone with many neighboring tracts in medium and high density classes.
Northeast Ohio has a different shape. Dense tracts around Cleveland spread along the Lake Erie corridor and continue south toward Akron and Canton. Cuyahoga County contains many of the darkest tracts, while Lorain, Lake, Summit, and Stark counties add adjacent clusters. Toledo creates a distinct concentration in the northwest. Cincinnati and Dayton produce two major clusters in the southwest, with smaller urban centers such as Springfield and Hamilton visible between or near them.
Large parts of western, southeastern, and rural eastern Ohio remain in the 0–50 or 50–200 people-per-square-mile classes. Census tracts are much smaller than counties, so this layer can show dense cities inside otherwise less-dense counties. It also prevents a county average from being mistaken for a uniform condition across every neighborhood and rural area.
Columbus is the largest census place, but Ohio has several large city centers
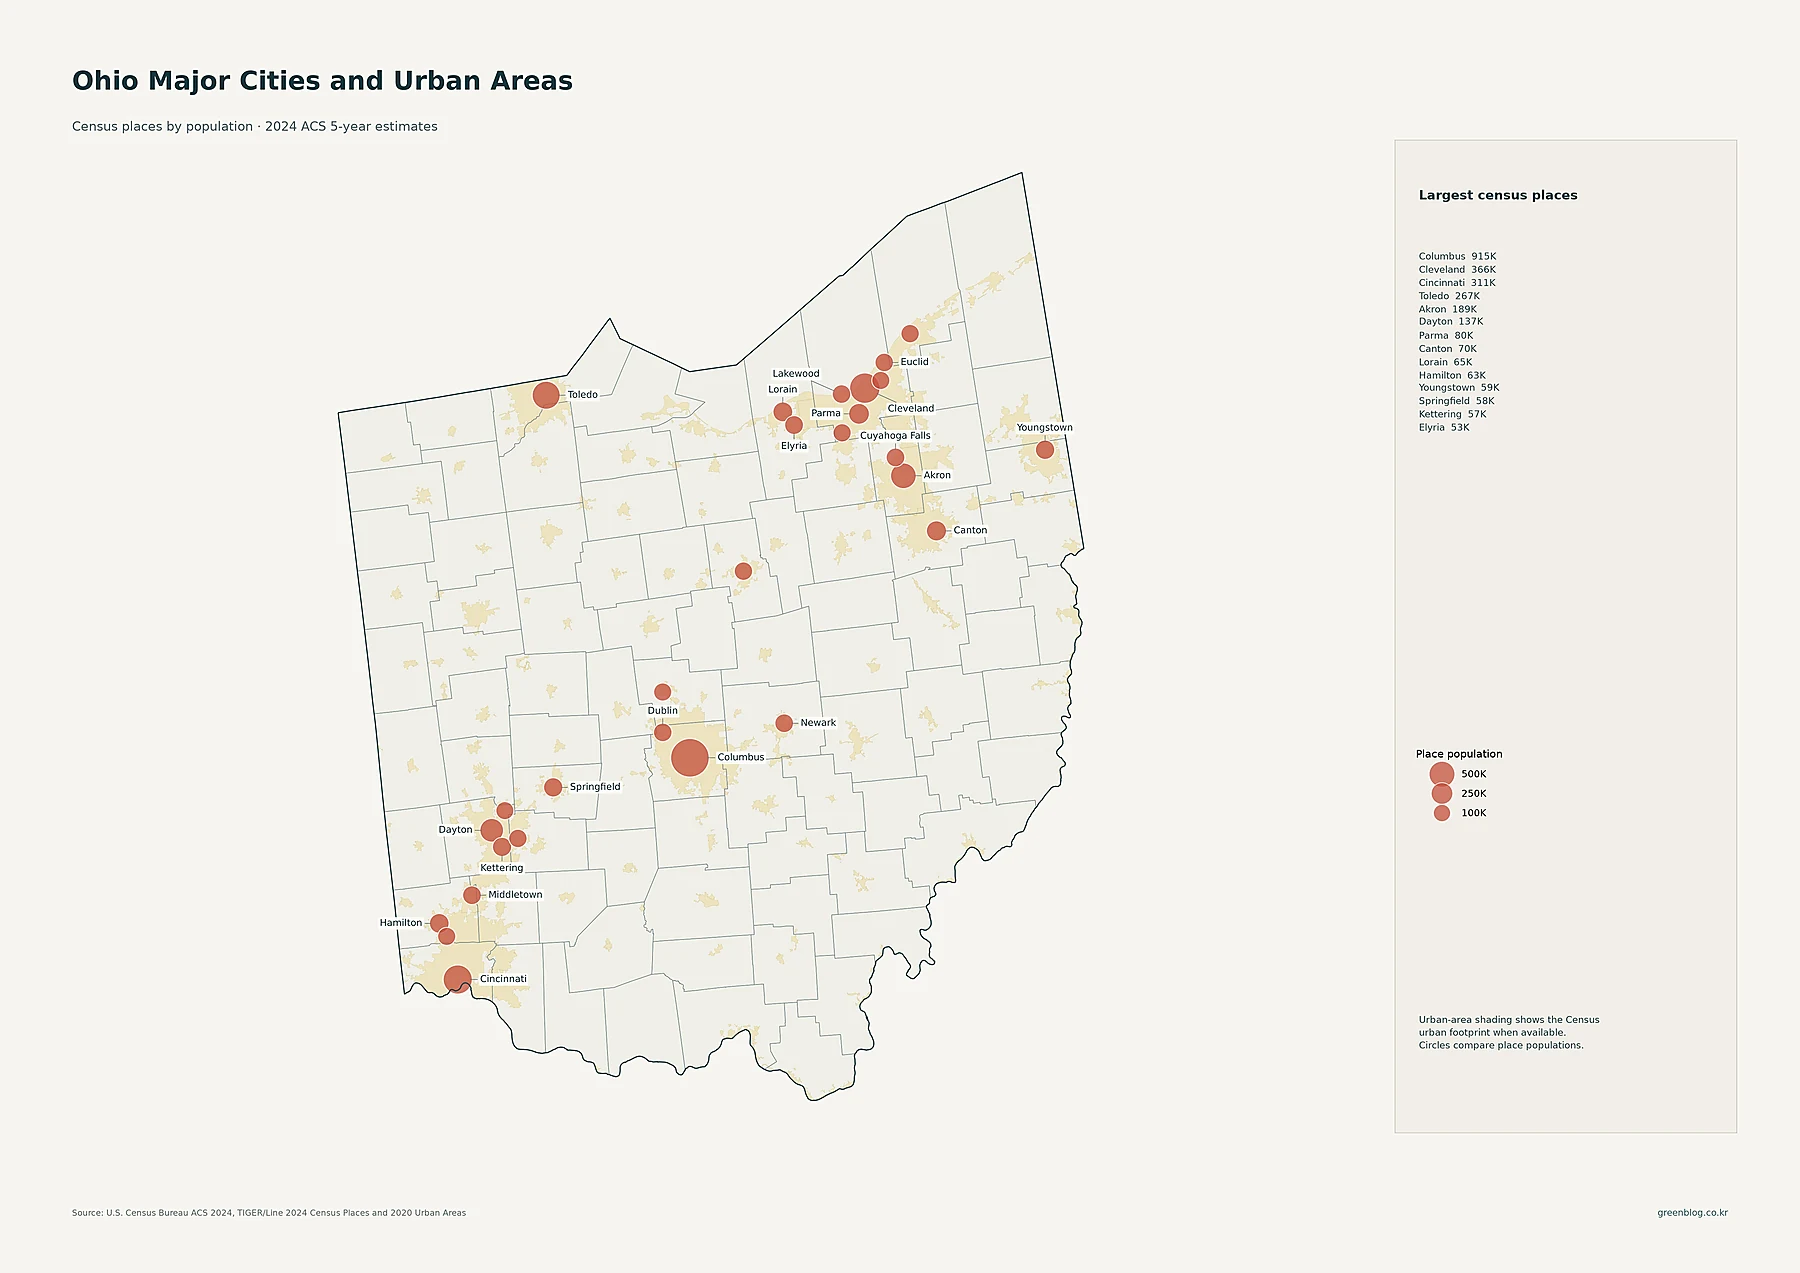
Columbus is the largest census place in the supplied data with 914,802 residents. Cleveland has 366,097, Cincinnati 311,224, Toledo 267,463, Akron 189,247, and Dayton 136,579. The next tier includes Parma at 79,870, Canton at 69,755, Lorain at 65,395, Hamilton at 63,468, Youngstown at 59,331, Springfield at 58,190, and Kettering at 57,206.
The circles represent total place population, not density. Columbus has by far the largest circle because it contains the most residents within its census-place boundary. That does not make it the densest part of the state by every geographic measure. County density, for example, places Cuyahoga above Franklin. The city map is therefore best used to compare the size and spacing of Ohio’s major named population centers.
The spacing of those circles also matters. Columbus sits in the center, Cleveland and Akron occupy the northeast, Toledo the northwest, and Cincinnati and Dayton the southwest. Ohio consequently has several urban systems that organize different parts of the state rather than one continuous statewide corridor.
Franklin County has the largest current population, just ahead of Cuyahoga
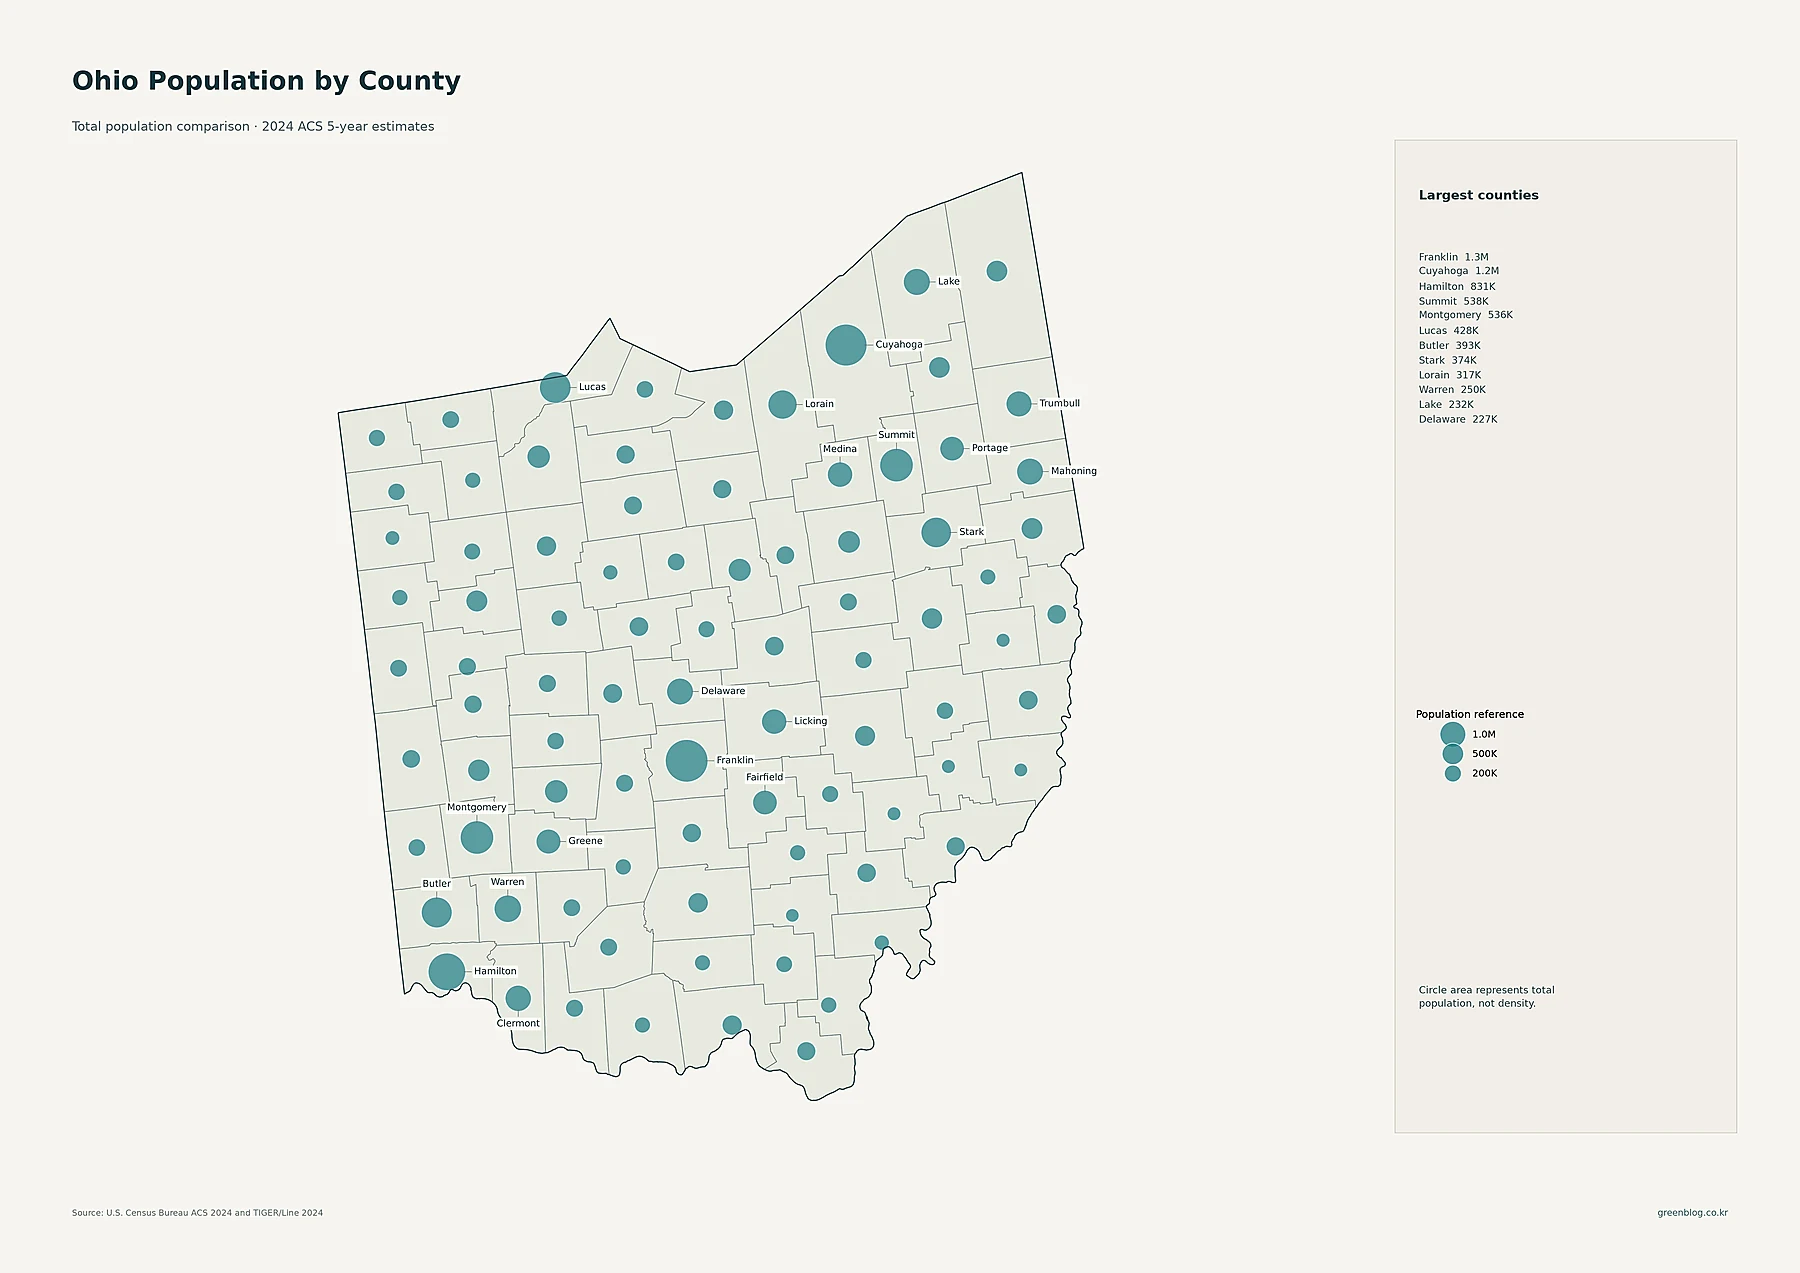
Franklin County has 1,333,048 residents, the largest county population in Ohio. Cuyahoga County follows at 1,245,873 and Hamilton County at 830,774. Summit has 537,864 residents, Montgomery 536,096, Lucas 428,018, Butler 392,876, Stark 373,713, and Lorain 317,129. Warren has 250,008, Lake 232,216, Delaware 226,834, and Mahoning 226,491.
The county totals align with the state’s major cities: Franklin contains Columbus, Cuyahoga contains Cleveland, Hamilton contains Cincinnati, Summit contains Akron, Montgomery contains Dayton, and Lucas contains Toledo. At the other end, several southeastern counties have very small totals. Monroe has 13,227 residents, Vinton 12,630, Morgan 13,651, and Harrison 14,306. Those small totals do not by themselves describe density, because county land area still needs to be considered.
Cuyahoga has the highest county density, followed by Franklin and Hamilton
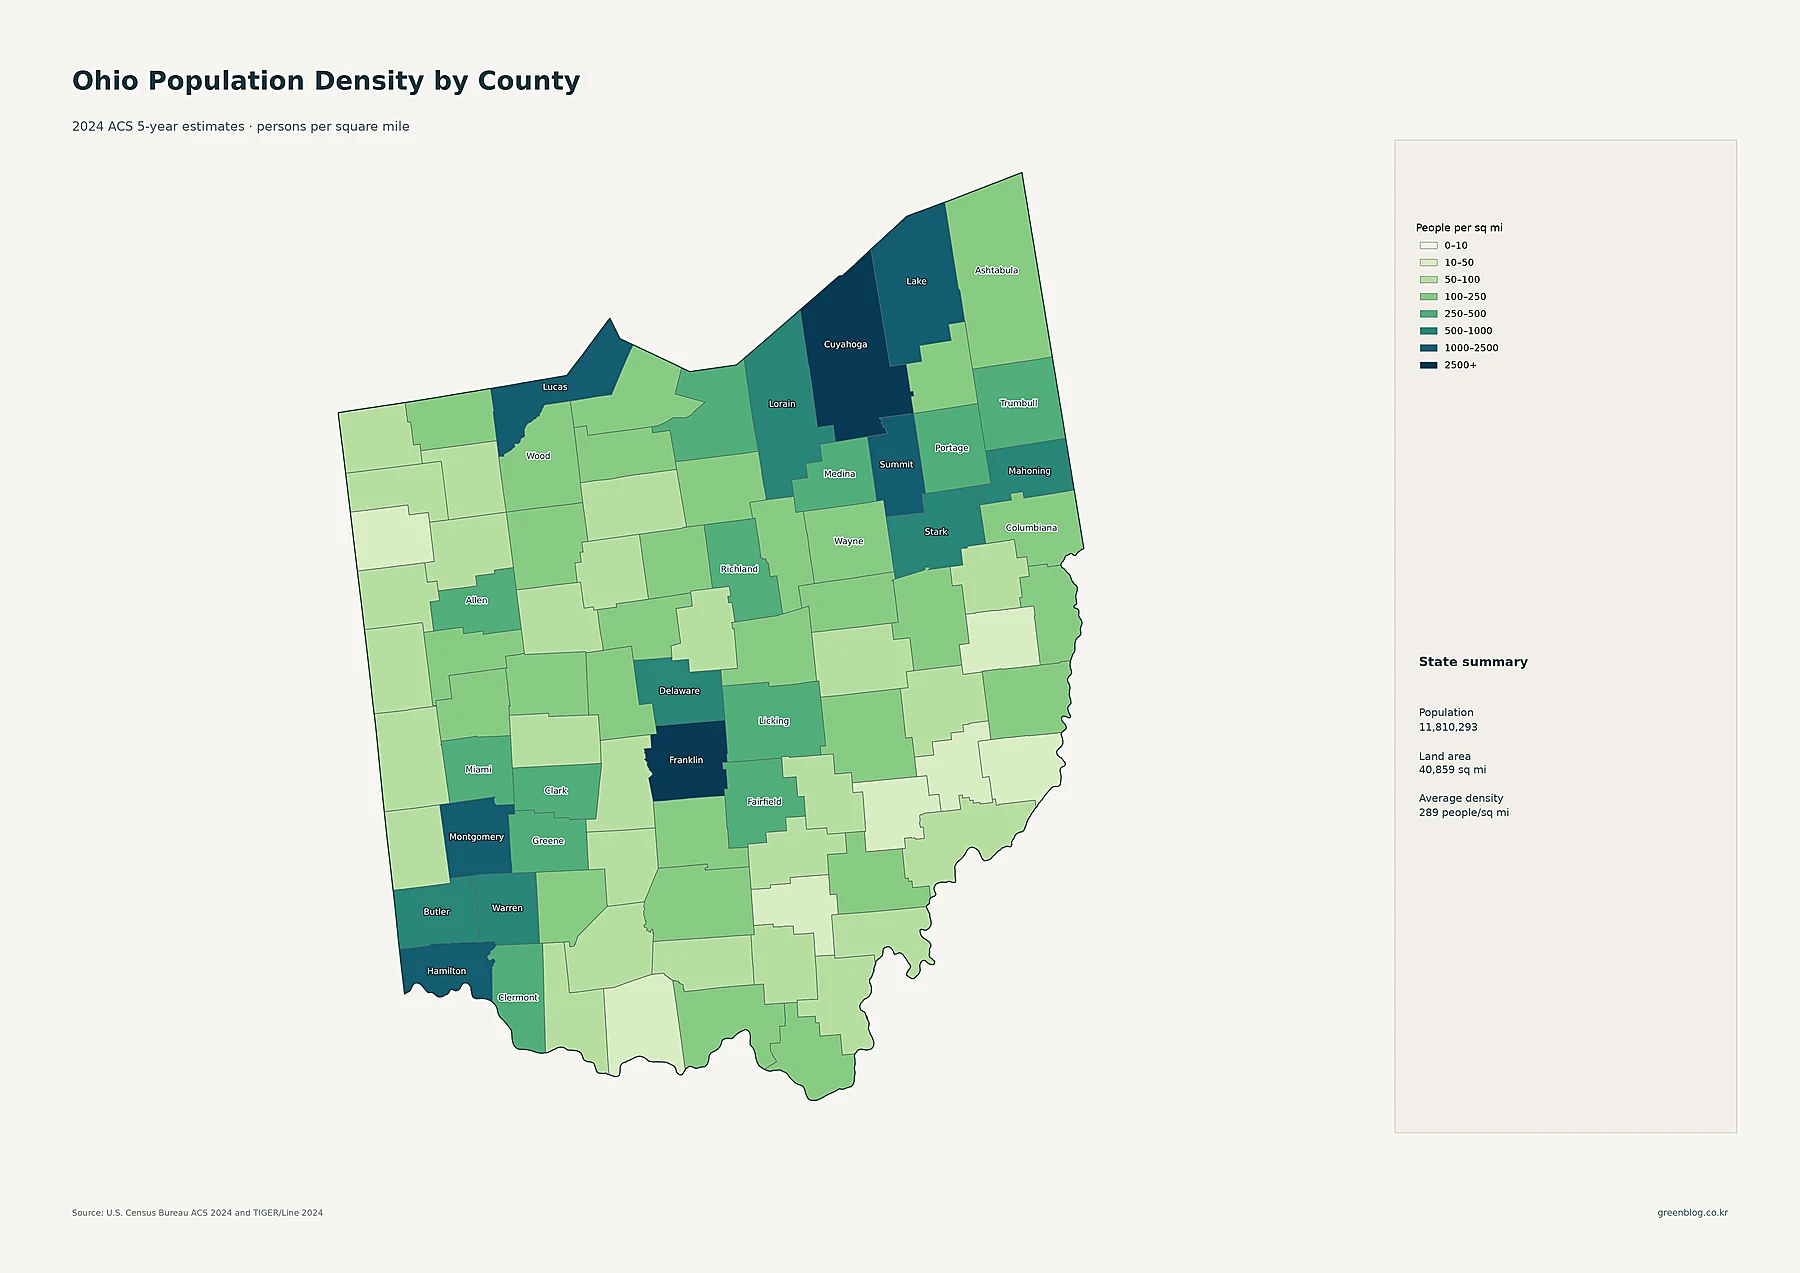
Cuyahoga County has the highest average density in the supplied data at about 2,724.9 people per square mile. Franklin County averages about 2,503.8 and Hamilton about 2,049.0. Summit is about 1,303.0, Lucas 1,260.1, Montgomery 1,162.0, and Lake 1,012.3. The darkest county classes therefore correspond closely to Cleveland, Columbus, Cincinnati, Akron, Toledo, and Dayton.
The sparsest county averages are dramatically lower. Monroe is about 29.0 people per square mile, Vinton 30.6, Morgan 32.8, Harrison 35.6, and Noble 35.9. The statewide average of 289 people per square mile compresses a very wide internal range. Cuyahoga’s average is almost one hundred times Monroe’s, and the tract map reveals additional variation inside each county.
| Measure | Leading area | Value in supplied data |
|---|---|---|
| State population | Ohio | 11,810,293 |
| Largest county population | Franklin County | 1,333,048 |
| Highest county density | Cuyahoga County | about 2,724.9/sq mi |
| Fastest 2010–2020 growth | Delaware County | +22.9% |
| Largest 2010–2020 decline | Harrison County | -8.7% |
Delaware and Union counties led growth north and northwest of Columbus
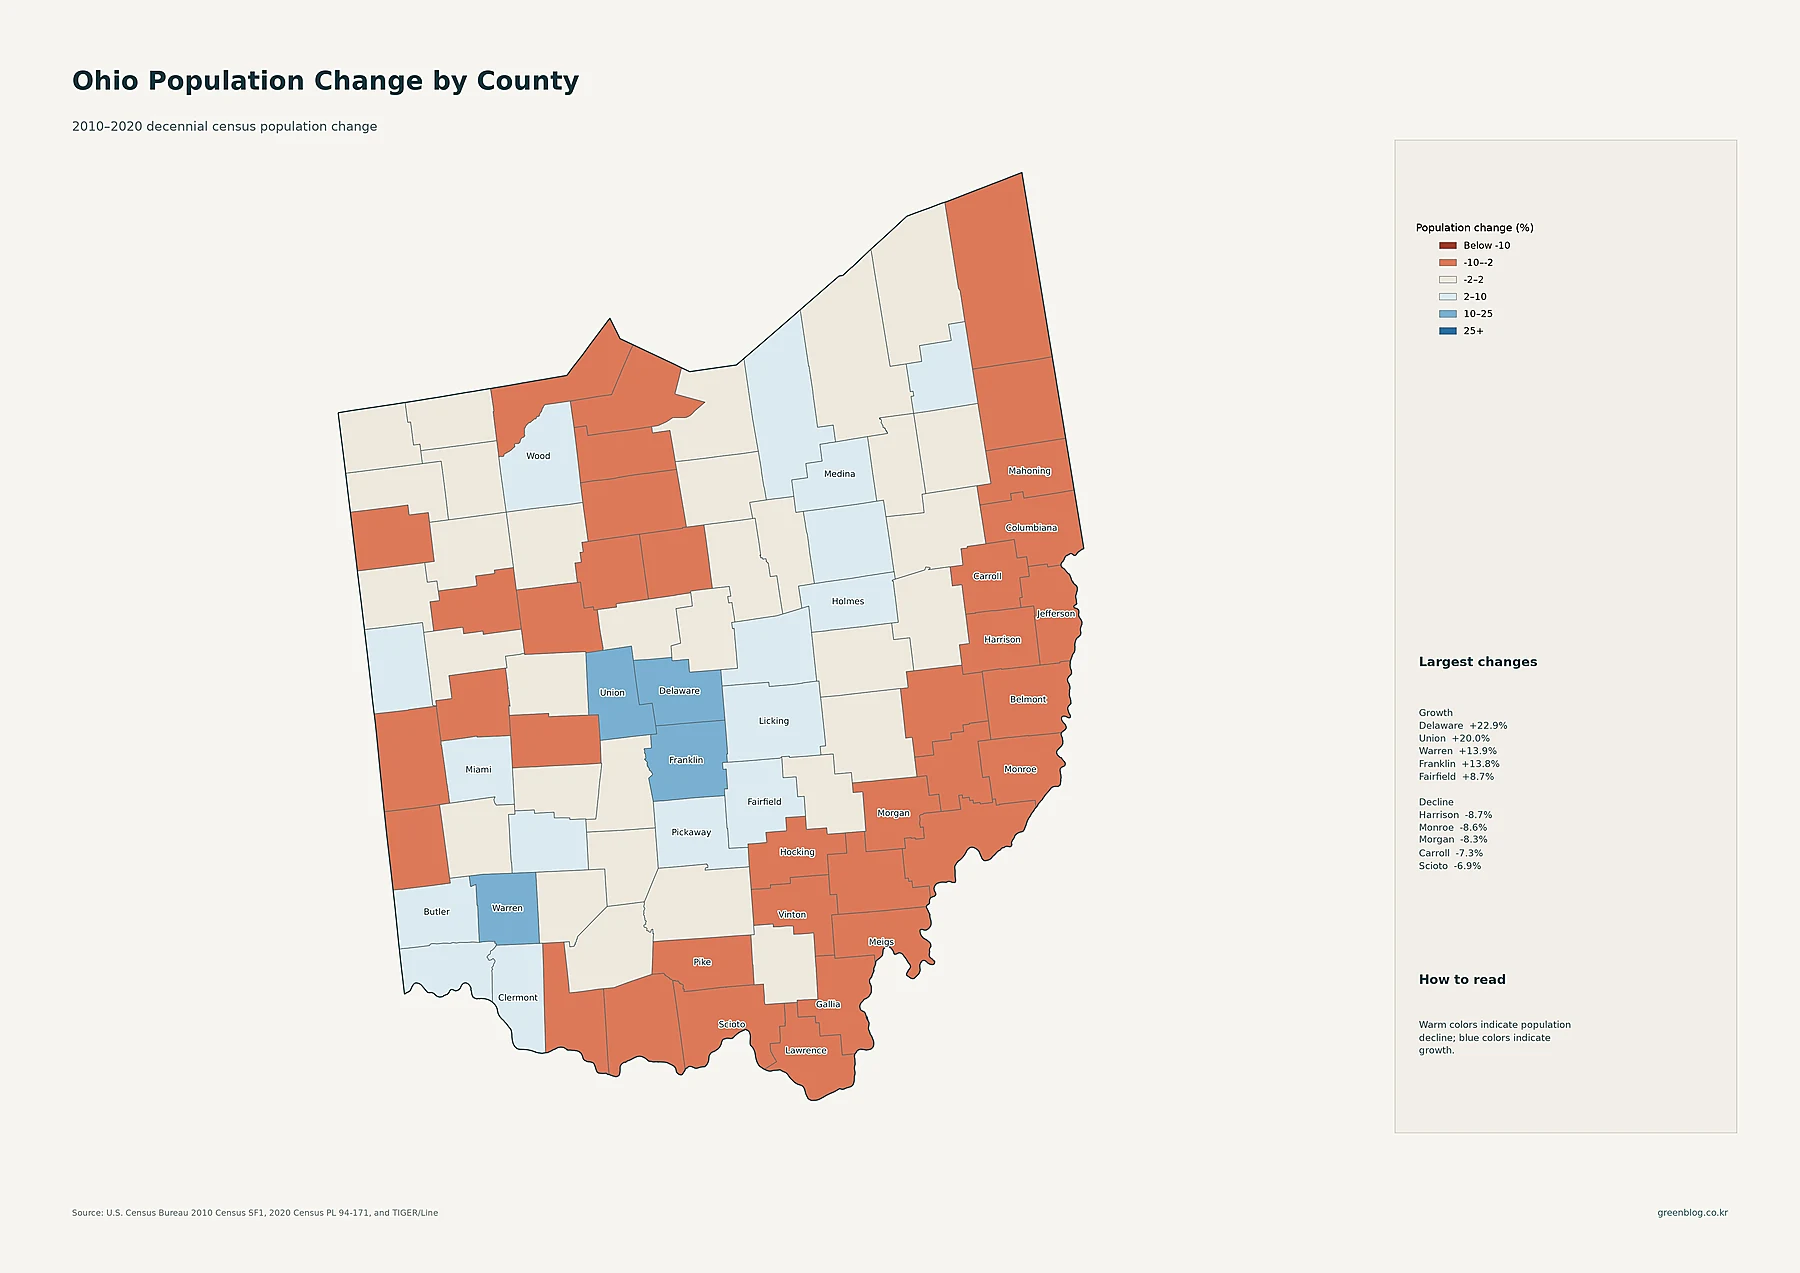
Delaware County recorded the fastest percentage increase in the supplied decade data. Its population rose from 174,214 in 2010 to 214,124 in 2020, a gain of about 22.9%. Union County grew from 52,300 to 62,784, or about 20.0%. Warren County increased 13.9% and Franklin County 13.8%. Fairfield grew 8.7%, Licking 7.2%, Miami 6.1%, Butler 6.0%, and Medina 5.9%.
The map makes the central Ohio growth pattern especially clear. Delaware and Union sit north and northwest of Franklin, while Fairfield and Licking extend the growth pattern to the southeast and east. Warren and Butler add growth in the Cincinnati region. Current population size and growth rate are therefore related but not identical: Franklin is the state’s largest county, yet its neighboring Delaware County grew faster in percentage terms during the 2010s.
Several eastern and southeastern counties declined. Harrison County fell about 8.7%, the largest percentage decrease in the supplied data. Monroe declined 8.6%, Morgan 8.3%, Carroll 7.3%, Scioto 6.9%, and Lawrence 6.7%. The warm colors are especially noticeable in eastern and southeastern Ohio. These percentages belong specifically to the 2010–2020 decennial-census period and should not be described as changes in the 2024 ACS estimate.
Ohio’s population story changes depending on whether the question is size, density, or growth
All five maps point to a multi-centered state, but they rank places differently. Columbus is the largest census place and Franklin is the largest county by total population. Cleveland’s Cuyahoga County, however, has the highest county-average density. Northeast Ohio also has a broad tract-level concentration extending through multiple counties and cities. Cincinnati–Dayton and Toledo form additional major clusters, preventing the state from being reduced to one dominant metropolitan core.
The historical change layer adds another distinction. Delaware and Union grew fastest during the 2010s, while several eastern and southeastern counties lost population. Reading Ohio accurately therefore requires keeping place totals, county totals, county density, tract density, and historical change separate. Together, the layers show both the state’s long-established dense urban regions and the faster-growing counties around central Ohio.
Download the Ohio population map collection
The ZIP includes detailed census-tract density, major cities and urban areas, county population totals, 2010–2020 county population change, and county population density.
FAQ
Which Ohio county has the largest population?
Franklin County is the largest in the supplied 2024 ACS 5-year estimates, with 1,333,048 residents. Cuyahoga County has 1,245,873 and Hamilton County 830,774.
Which Ohio county has the highest population density?
Cuyahoga County has the highest county-average density at about 2,724.9 people per square mile. Franklin is about 2,503.8 and Hamilton about 2,049.0 people per square mile.
Which Ohio county grew fastest from 2010 to 2020?
Delaware County grew about 22.9%, followed by Union County at 20.0%, Warren County at 13.9%, and Franklin County at 13.8%. These percentages compare the 2010 and 2020 decennial censuses.
Related Maps
Sources
- U.S. Census Bureau — American Community Survey (ACS): 2024 5-year population and density estimates
- U.S. Census Bureau — TIGER/Line Shapefiles: 2024 state, county, census tract, place geography and mapped boundaries
- U.S. Census Bureau — Decennial Census: 2010 and 2020 county population comparison
Green Map creates custom-edited map images using open geographic data sources such as geoBoundaries, Natural Earth, OpenStreetMap, and government open data.
These maps are edited visual materials, not raw data files, and are provided for education, documents, presentations, and graphic reference.