Michigan’s statewide average hides one of the clearest internal contrasts in the Great Lakes region. The 2024 ACS 5-year estimate places the state population at 10,077,761, while the county-density map reports about 56,611 square miles of land and an average density near 178 people per square mile. That average is not what most of the map looks like. Southeast Michigan contains a broad concentration of dense census tracts, while much of the Upper Peninsula falls into the lowest density classes.
The map set is most useful when its measures are kept separate. Wayne County ranks first in both current population and county-average density, yet it was not the fastest-growing county from 2010 to 2020. Ottawa County had the largest percentage increase over that decade. Detroit is by far the largest census place, but a large city symbol represents total population, not people per square mile. Moving from tract density to cities, county totals, county density, and then change makes those distinctions visible instead of compressing them into one ranking.
Table of Contents
The tract map reveals a wide southeast concentration rather than a single Detroit point
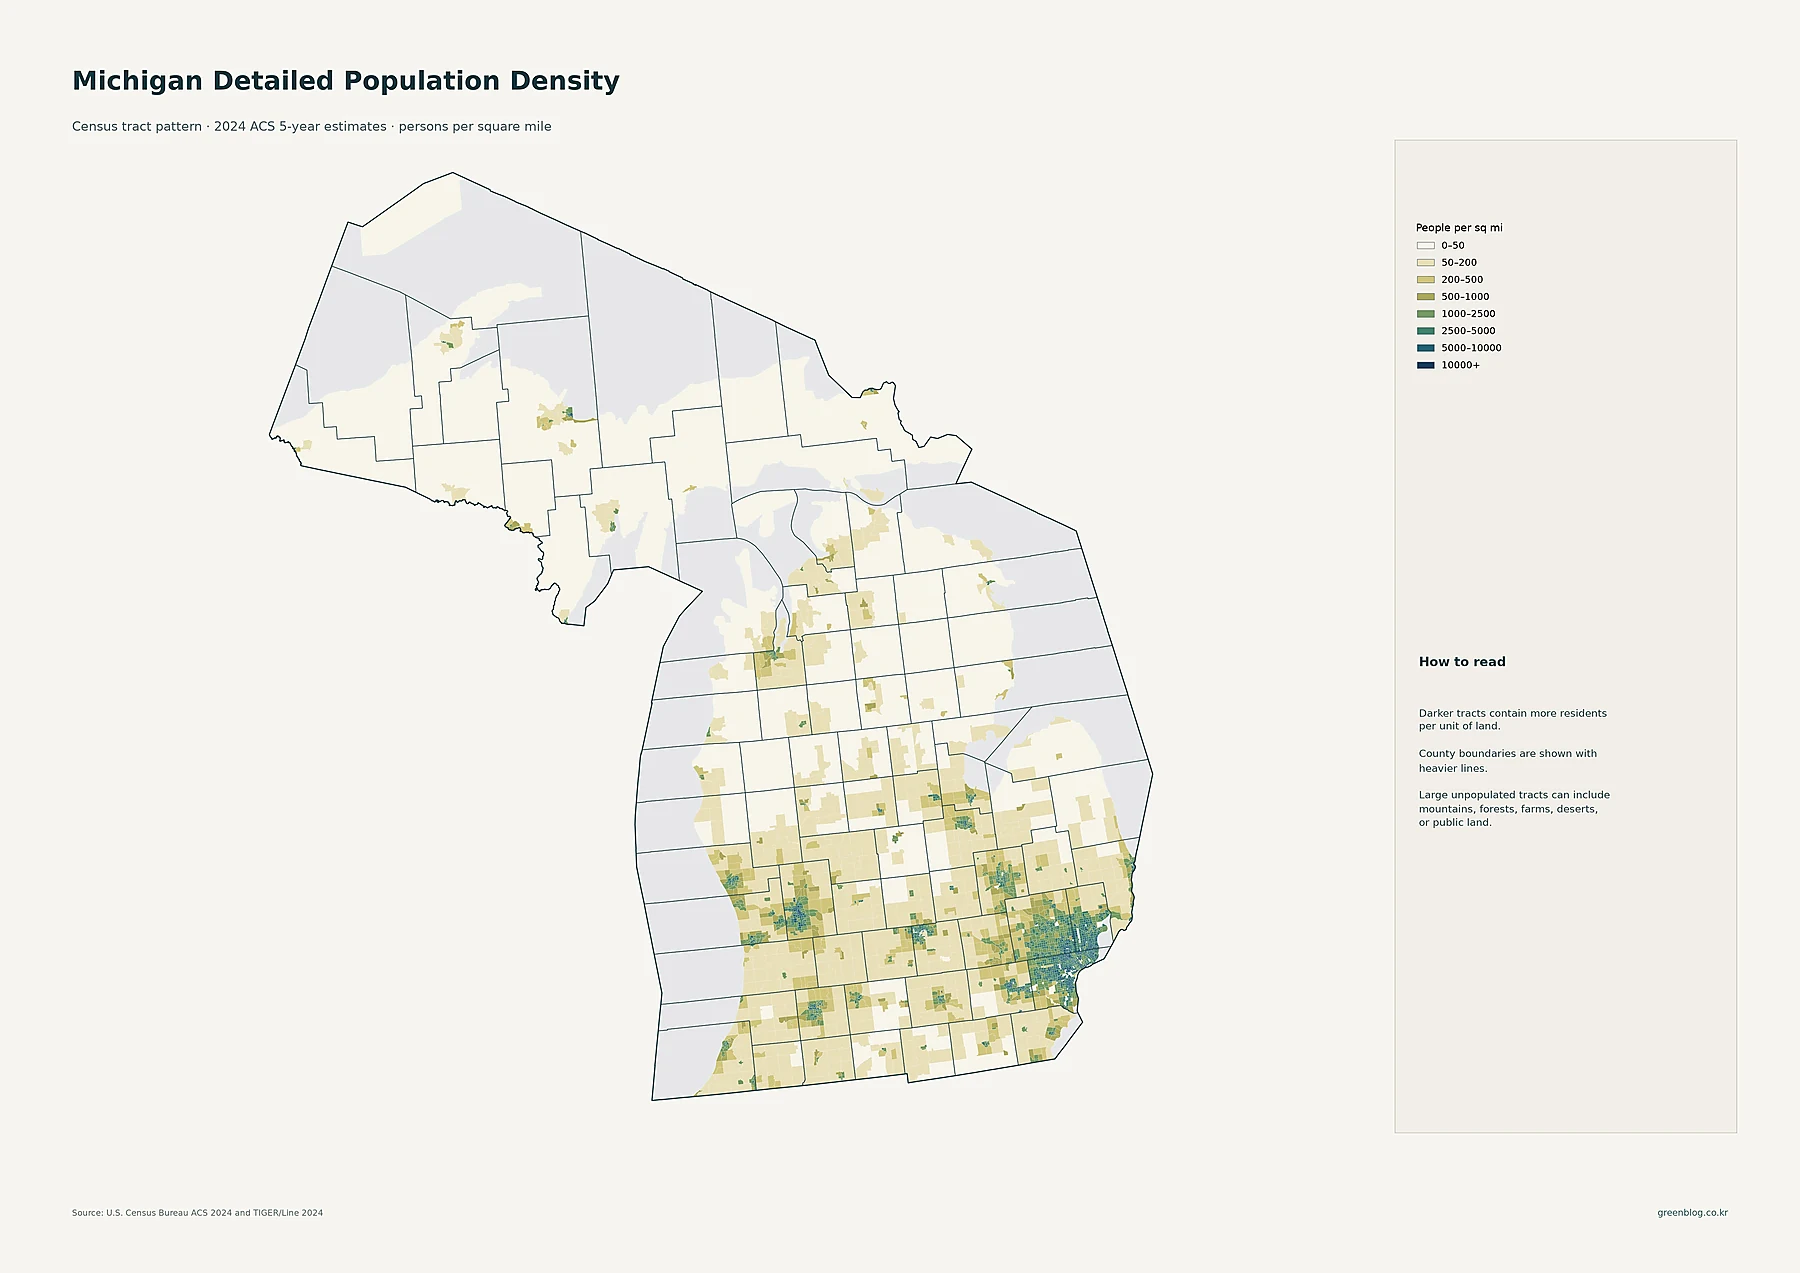
The darkest and most continuous tract pattern sits in and around Detroit. High-density tracts extend beyond the city into the surrounding Wayne, Oakland, and Macomb area, creating a regional cluster rather than an isolated urban dot. Ann Arbor forms another visible concentration to the west, while Flint and Lansing stand out farther north and inland. On the western side of the Lower Peninsula, the Grand Rapids area produces another substantial cluster, with smaller but clear concentrations around Kalamazoo and Muskegon.
Northern Michigan looks very different. Much of the Upper Peninsula is mapped in the lowest density categories, interrupted by relatively small settlement clusters. The northern Lower Peninsula is also much lighter than the southern urban belt, although Traverse City appears as a regional concentration. This is why tract-level mapping matters: county averages can smooth together a compact city, its suburbs, and extensive low-density land. The tract map shows where residents are actually concentrated inside county boundaries.
Detroit dominates the place-population map, while Grand Rapids anchors the west
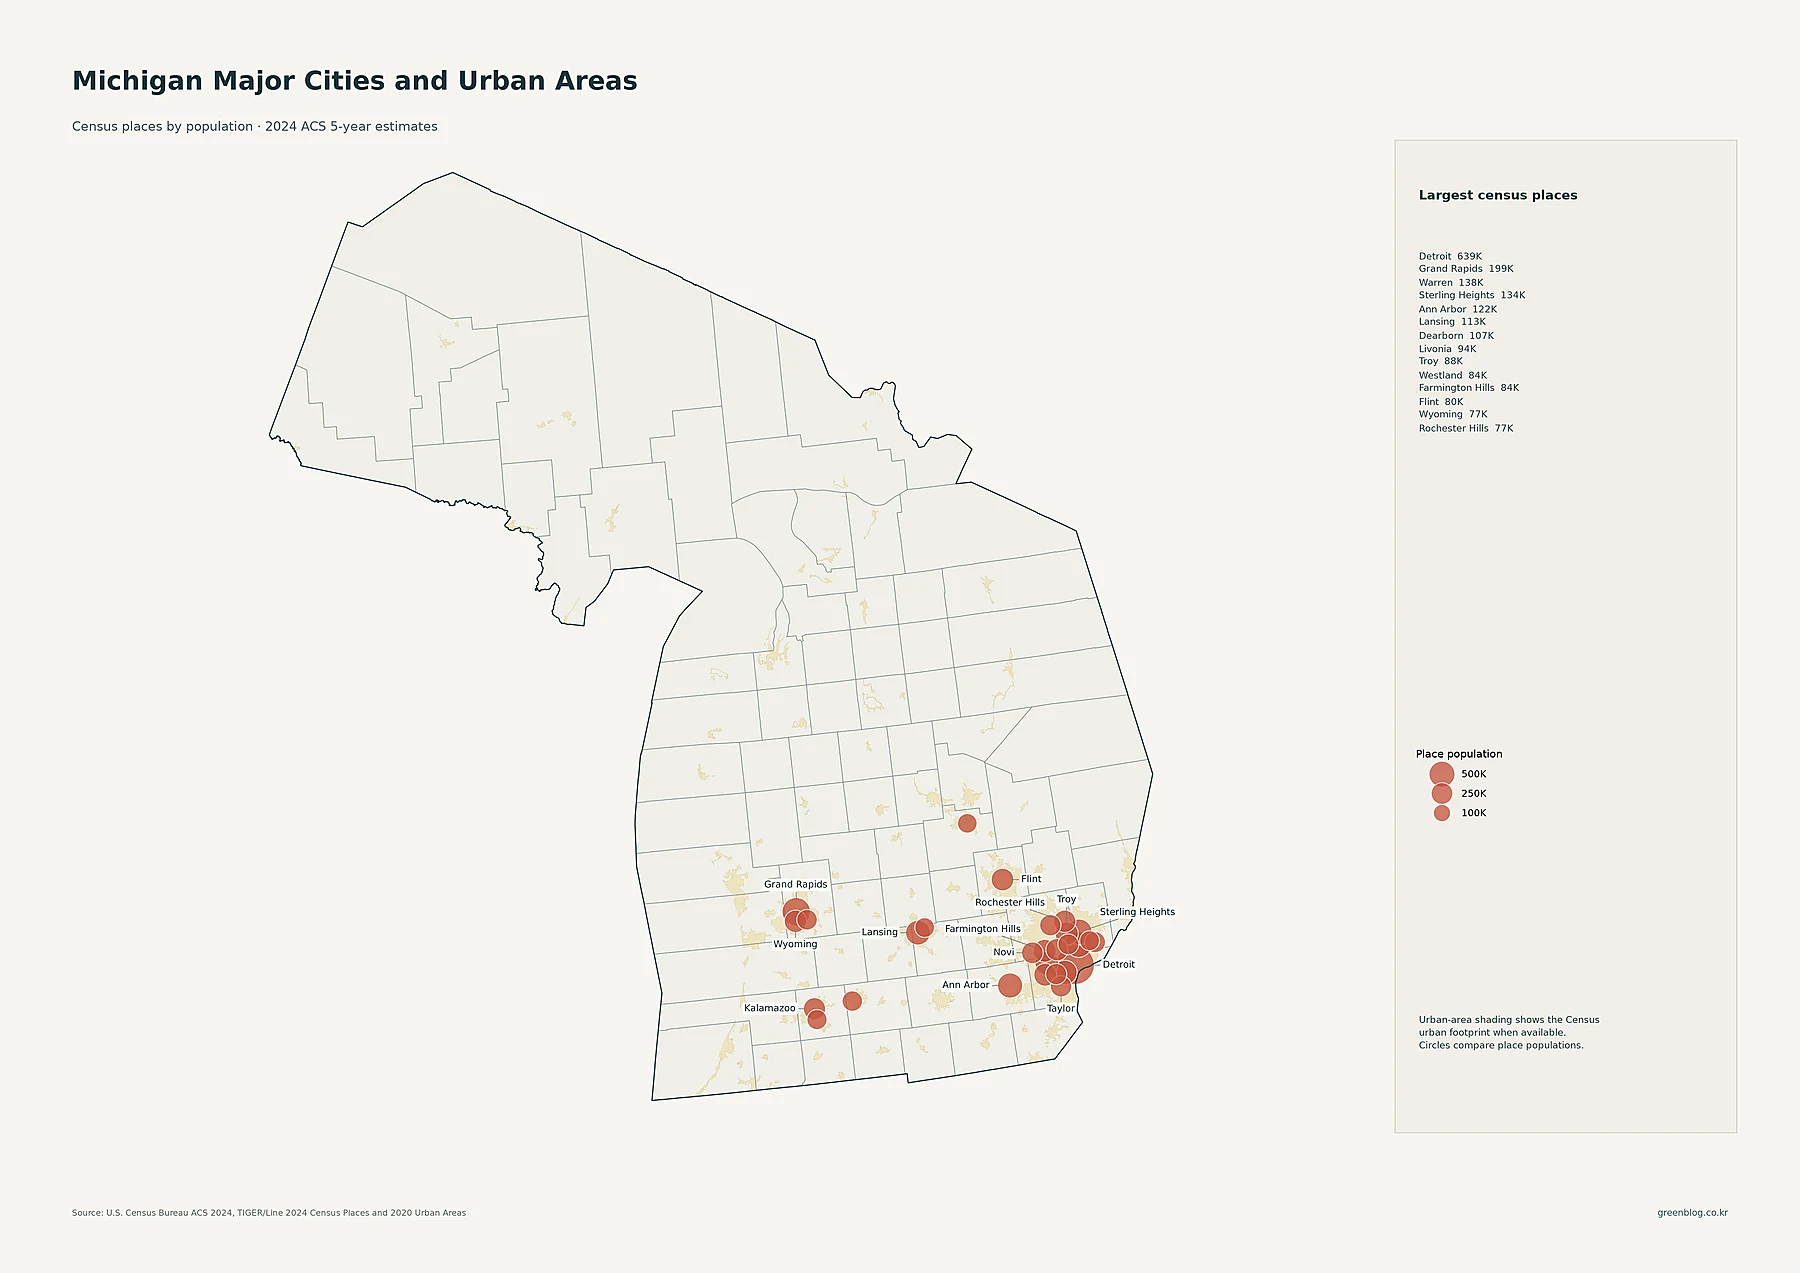
Detroit is the largest census place at 638,530 residents. Grand Rapids is second at 198,535, followed by Warren at 137,928 and Sterling Heights at 133,573. Ann Arbor has 122,036 residents, Lansing 113,023, and Dearborn 107,423. Other large places shown in the supporting data include Livonia at 93,851, Troy at 87,898, Westland at 83,633, Farmington Hills at 83,515, Flint at 80,175, Wyoming at 77,353, and Rochester Hills at 77,089.
The geography of those circles is as important as their size. Warren, Sterling Heights, Dearborn, Livonia, Troy, Westland, Farmington Hills, Southfield, Pontiac, and several other sizable places sit close to Detroit. That concentration helps explain why southeast Michigan appears as a broad dense zone on the tract map. Grand Rapids and Wyoming create a separate western cluster, while Lansing, Ann Arbor, Flint, and Kalamazoo provide other regional centers. The circles should not be read as density symbols: they compare place populations only.
County totals put Wayne, Oakland, and Macomb far ahead of most of the state
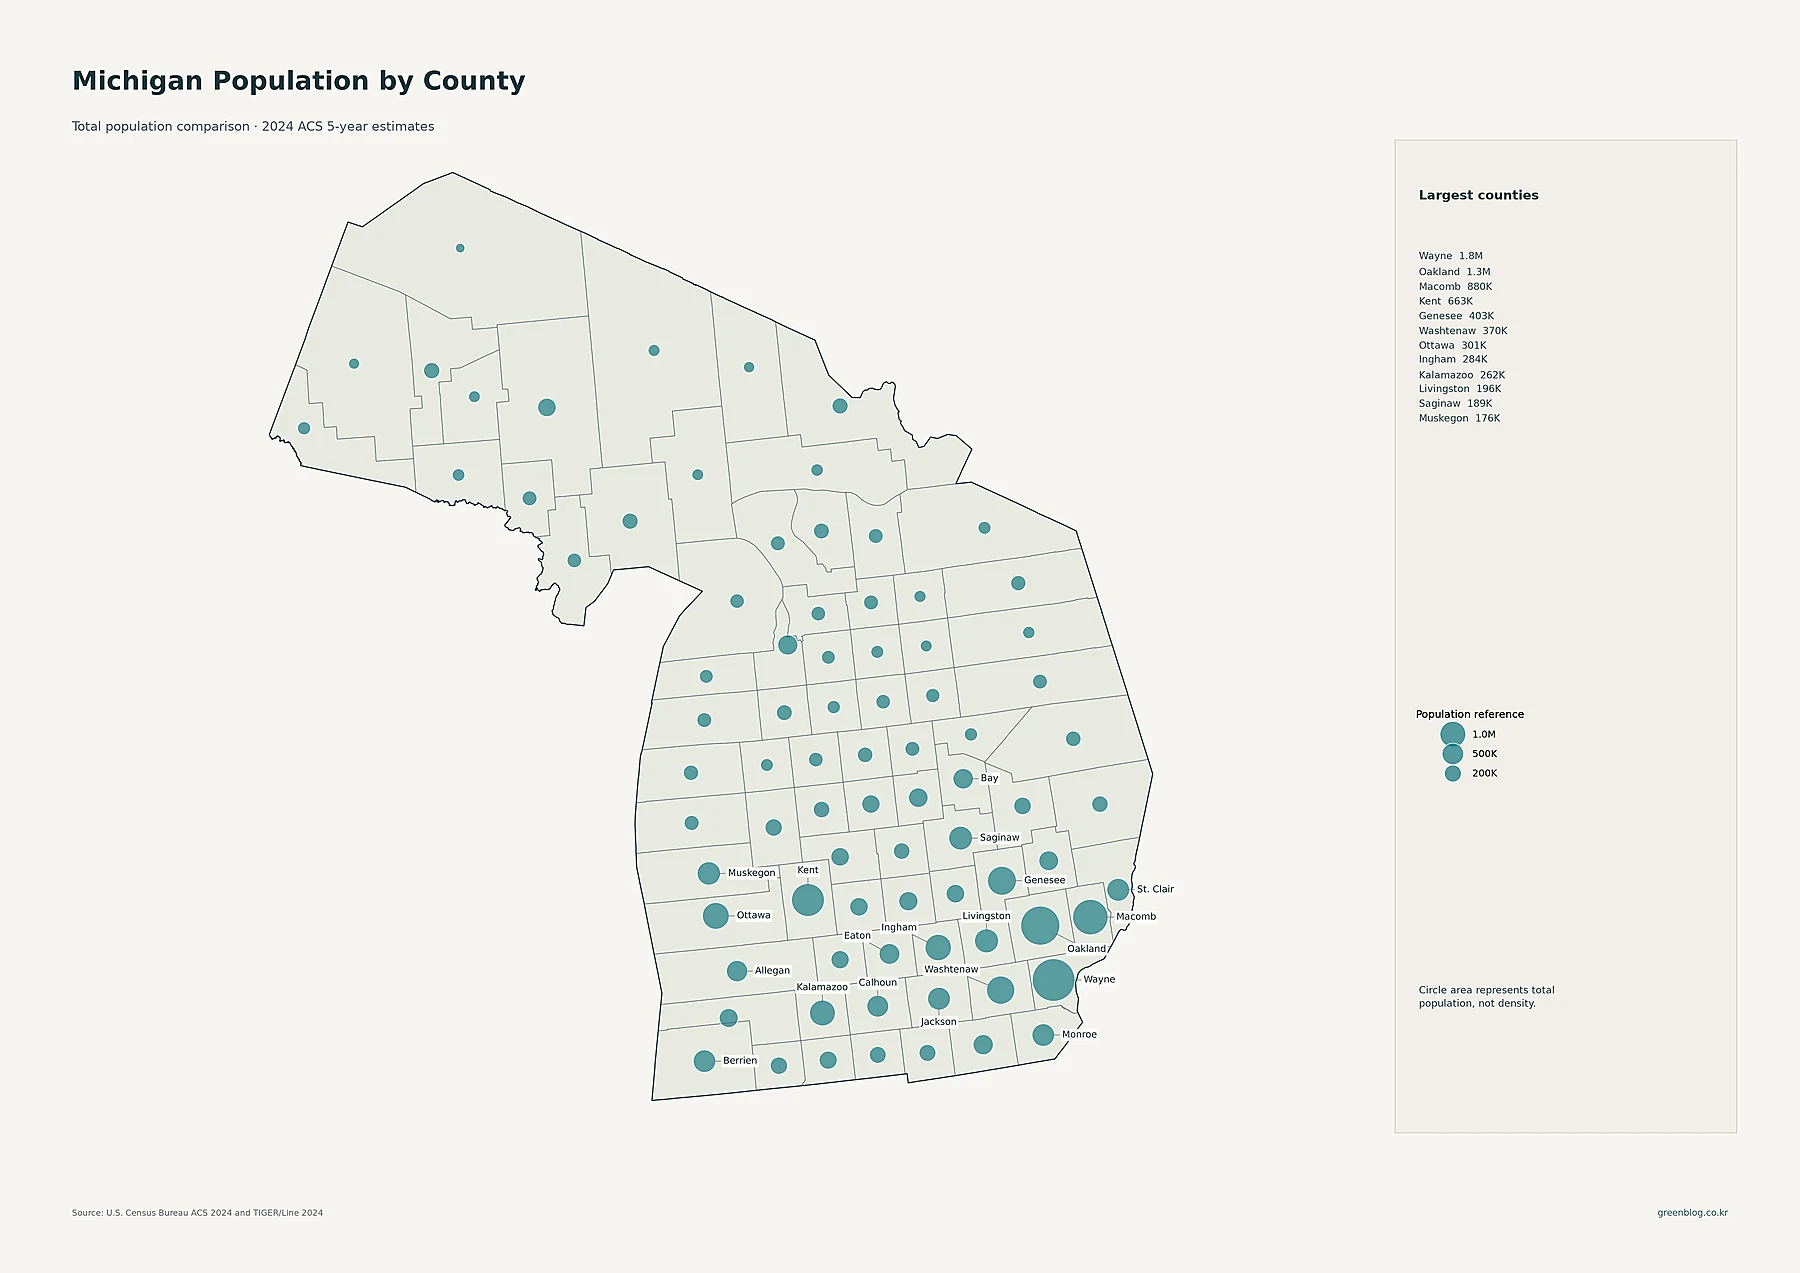
Wayne County has 1,772,259 residents, the largest county total in Michigan. Oakland County follows with 1,279,825 and Macomb County with 879,853. Kent County, home to the Grand Rapids area, has 663,150 residents. Genesee County has 403,305, Washtenaw 369,822, Ottawa 301,203, Ingham 283,913, and Kalamazoo 262,375. The largest circles are therefore concentrated in the southern Lower Peninsula, especially the southeast and the Grand Rapids side of the state.
The Upper Peninsula contains much smaller county totals. Marquette County, at 67,112, is relatively large for that part of Michigan but still far below the major Lower Peninsula counties. Keweenaw County has 2,133 residents and Ontonagon County 5,850 in the 2024 ACS dataset. Those small circles do not, by themselves, tell us how sparse the counties are because land area is missing from a total-population symbol. The county-density map supplies that second piece of information.
Wayne also leads in density, but the Upper Peninsula reaches single-digit values
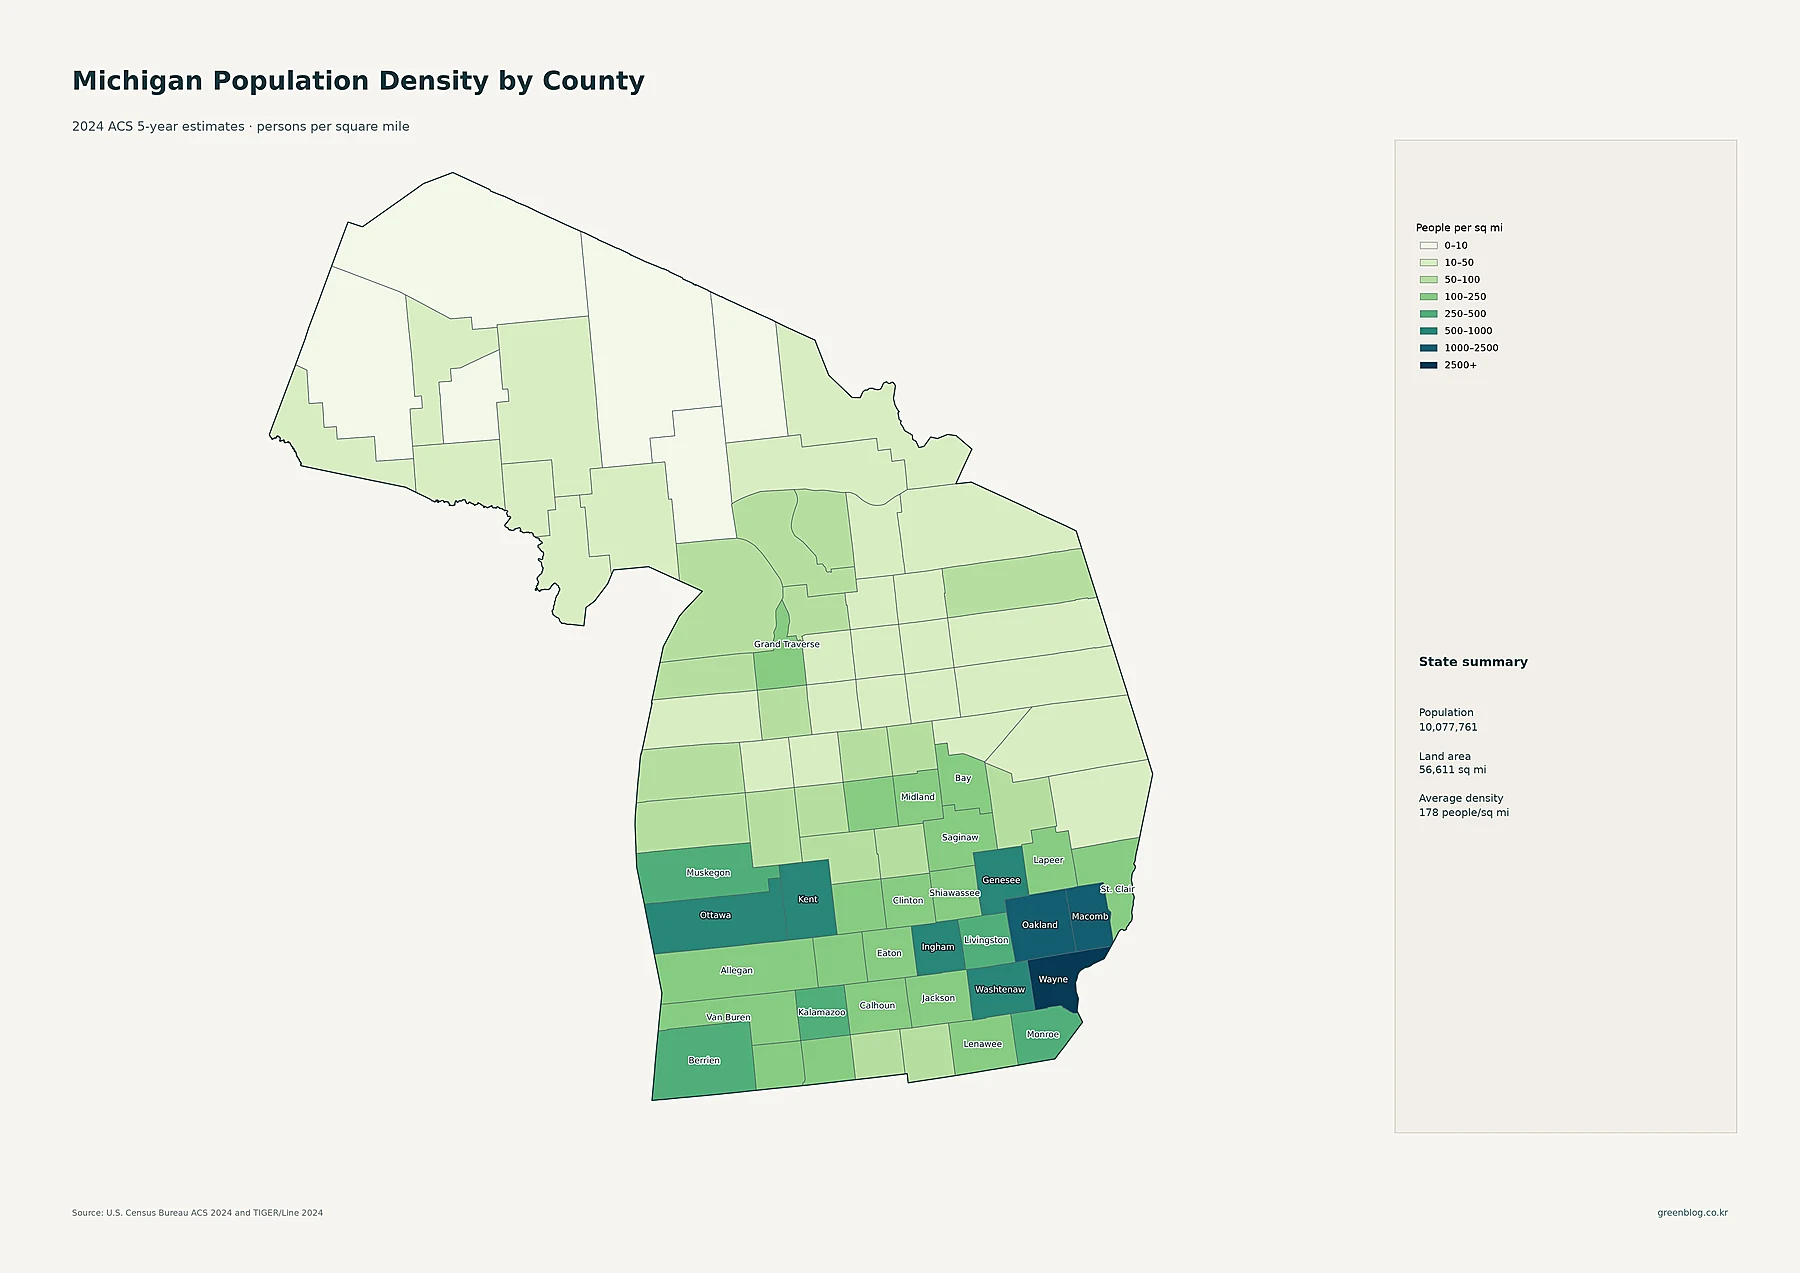
Wayne County averages about 2,897 people per square mile. Macomb County is next at roughly 1,836, followed by Oakland County at about 1,475. Kent County averages about 781, Genesee 633, Ottawa 535, Washtenaw 524, Ingham 511, and Kalamazoo 467. These values reinforce the strong southern Lower Peninsula concentration, but they also show that total population and density are not interchangeable. County land area changes the ranking and the meaning of each number.
At the other end, Keweenaw County averages only about 3.9 people per square mile and Ontonagon about 4.5. Schoolcraft and Luce are both near 6.9, while Baraga and Alger remain below 10. The statewide average of 178 therefore describes neither the dense Detroit area nor the sparsest northern counties very well. It is a mathematical middle created by combining places with radically different settlement patterns across two peninsulas.
| Measure | Standout area | Value in the supplied data |
|---|---|---|
| State population | Michigan | 10,077,761 |
| Largest county population | Wayne County | 1,772,259 |
| Highest county density | Wayne County | about 2,897/sq mi |
| Fastest 2010–2020 growth | Ottawa County | +12.3% |
| Largest 2010–2020 decline | Luce County | -19.5% |
The 2010–2020 map shifts attention westward to Ottawa, Kent, and Allegan
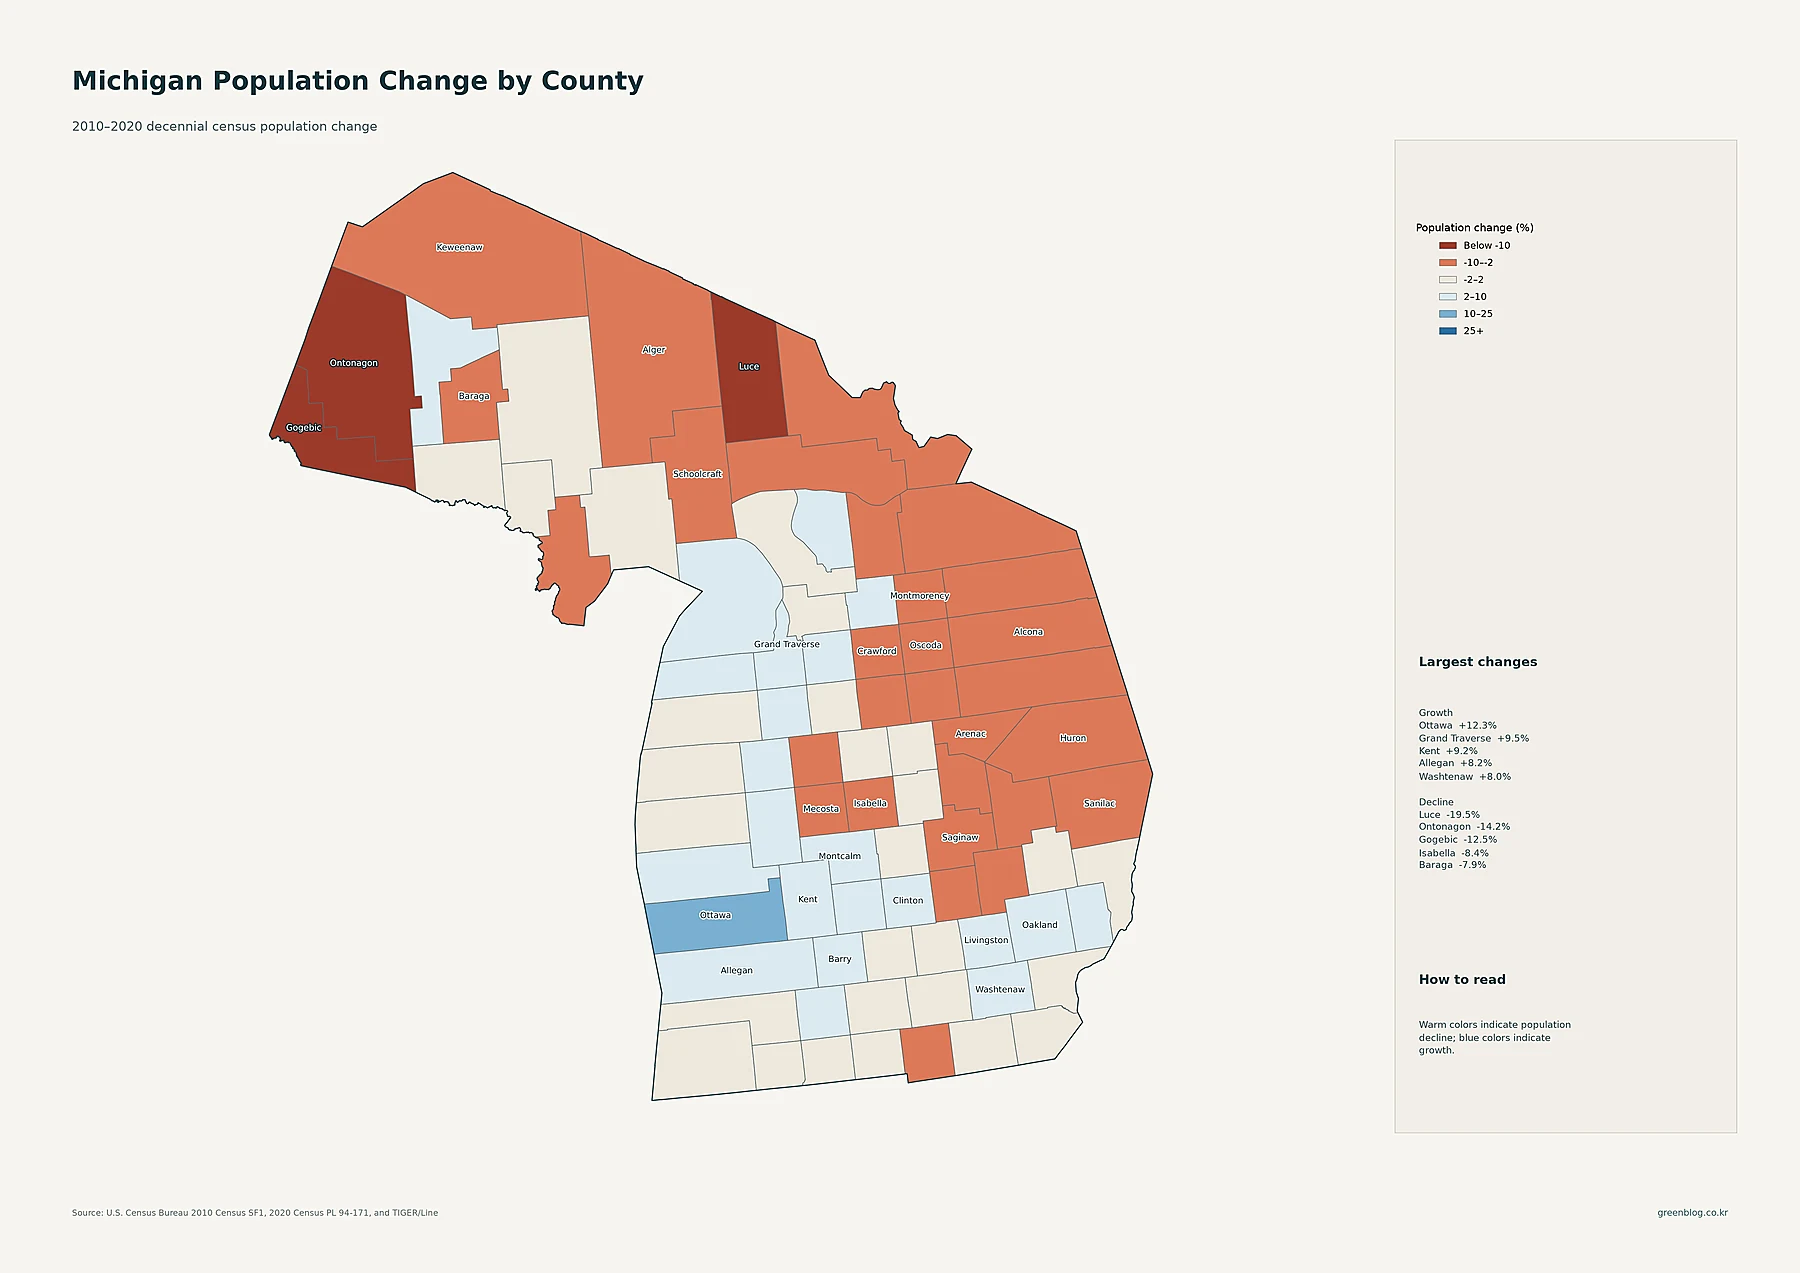
Ottawa County grew from 263,801 residents in 2010 to 296,200 in 2020, an increase of about 12.3%, the highest rate in the dataset. Grand Traverse County increased 9.5%, Kent County 9.2%, Allegan County 8.2%, and Washtenaw County 8.0%. Livingston grew 7.1% and Oakland 6.0%. On the map, that produces a notable set of growth counties along the western Lower Peninsula, around Grand Traverse in the northwest, and in selected counties of southeast Michigan.
The sharpest decline was in Luce County at about -19.5%, followed by Ontonagon at -14.2% and Gogebic at -12.5%. Isabella declined 8.4%, Baraga 7.9%, and Alger 7.9%. Wayne County, despite having Michigan’s largest current population, declined about 1.5% between the two censuses, from 1,820,584 to 1,793,561. That contrast is a useful reminder that present size and past growth are separate measures. The map records change; it does not establish why any county grew or declined.
A practical way to read Michigan’s population pattern
Start with the tract map when the question is “where are people packed most tightly?” It identifies the Detroit-area concentration and the smaller Grand Rapids, Lansing, Ann Arbor, Flint, Kalamazoo, and other urban clusters. Use the place map when the question is about city size. Move to county totals to compare the number of residents inside each administrative boundary, then use county density to account for land area. Finish with the 2010–2020 change map when the question is whether a county was growing or shrinking during that decade.
Read in that order, Michigan separates into several distinct patterns. Southeast Michigan combines the largest city, the largest county populations, and the highest county densities. Western Lower Michigan contains the state’s second-largest city and several of the strongest 2010–2020 growth counties. The Upper Peninsula is characterized by small county totals and exceptionally low densities, with several counties also showing substantial population losses over the decade. No single map captures all three dimensions, but together they show current size, spatial concentration, and change without confusing one for another.
Download the Michigan population map collection
The ZIP includes detailed census-tract density, major cities and urban areas, county population totals, 2010–2020 county population change, and county population density.
FAQ
Which Michigan county has the largest population?
Wayne County is the largest in the supplied 2024 ACS data with 1,772,259 residents. Oakland County follows at 1,279,825 and Macomb County at 879,853.
Which Michigan county has the highest population density?
Wayne County also ranks first in county-average density at about 2,897 people per square mile. Macomb is about 1,836 and Oakland about 1,475 people per square mile.
Which Michigan counties changed the most from 2010 to 2020?
Ottawa County had the highest percentage growth at about +12.3%. Luce County had the largest decline at about -19.5%. These figures compare the 2010 and 2020 decennial censuses, not the 2024 ACS estimates.
Related Maps
Sources
- U.S. Census Bureau — American Community Survey (ACS): 2024 ACS 5-year population and density estimates.
- U.S. Census Bureau — TIGER/Line Shapefiles: 2024 county, census tract, and census-place geography used to build the maps.
- U.S. Census Bureau — Decennial Census: 2010 and 2020 county population counts used for the change map.
Green Map creates custom-edited map images using open geographic data sources such as geoBoundaries, Natural Earth, OpenStreetMap, and government open data.
These maps are edited visual materials, not raw data files, and are provided for education, documents, presentations, and graphic reference.