Iowa’s statewide average density is modest, but the maps make clear that residents are not spread evenly across its 99 counties. The 2024 ACS 5-year estimates place the state population at 3,210,507. The county-density map lists about 55,854 square miles of land and a statewide average of roughly 57 people per square mile. That average blends very different settings: a broad Des Moines-area concentration, several eastern urban clusters, smaller regional centers, and large rural areas where population is thinly distributed.
The five maps answer different questions and are most useful when kept separate. The tract map shows where residents are concentrated within counties. The city map compares census-place populations with proportional circles and adds urban-area shading where available. The county-population map also uses circle area, but for county totals. The county-density map changes the measure to people per square mile, while the 2010–2020 map compares Decennial Census counts over a decade. A large circle therefore means many residents, not automatically high density, and a dark growth color does not describe a 2024 population estimate.
Table of Contents
The strongest continuous density pattern is centered on the Des Moines metro
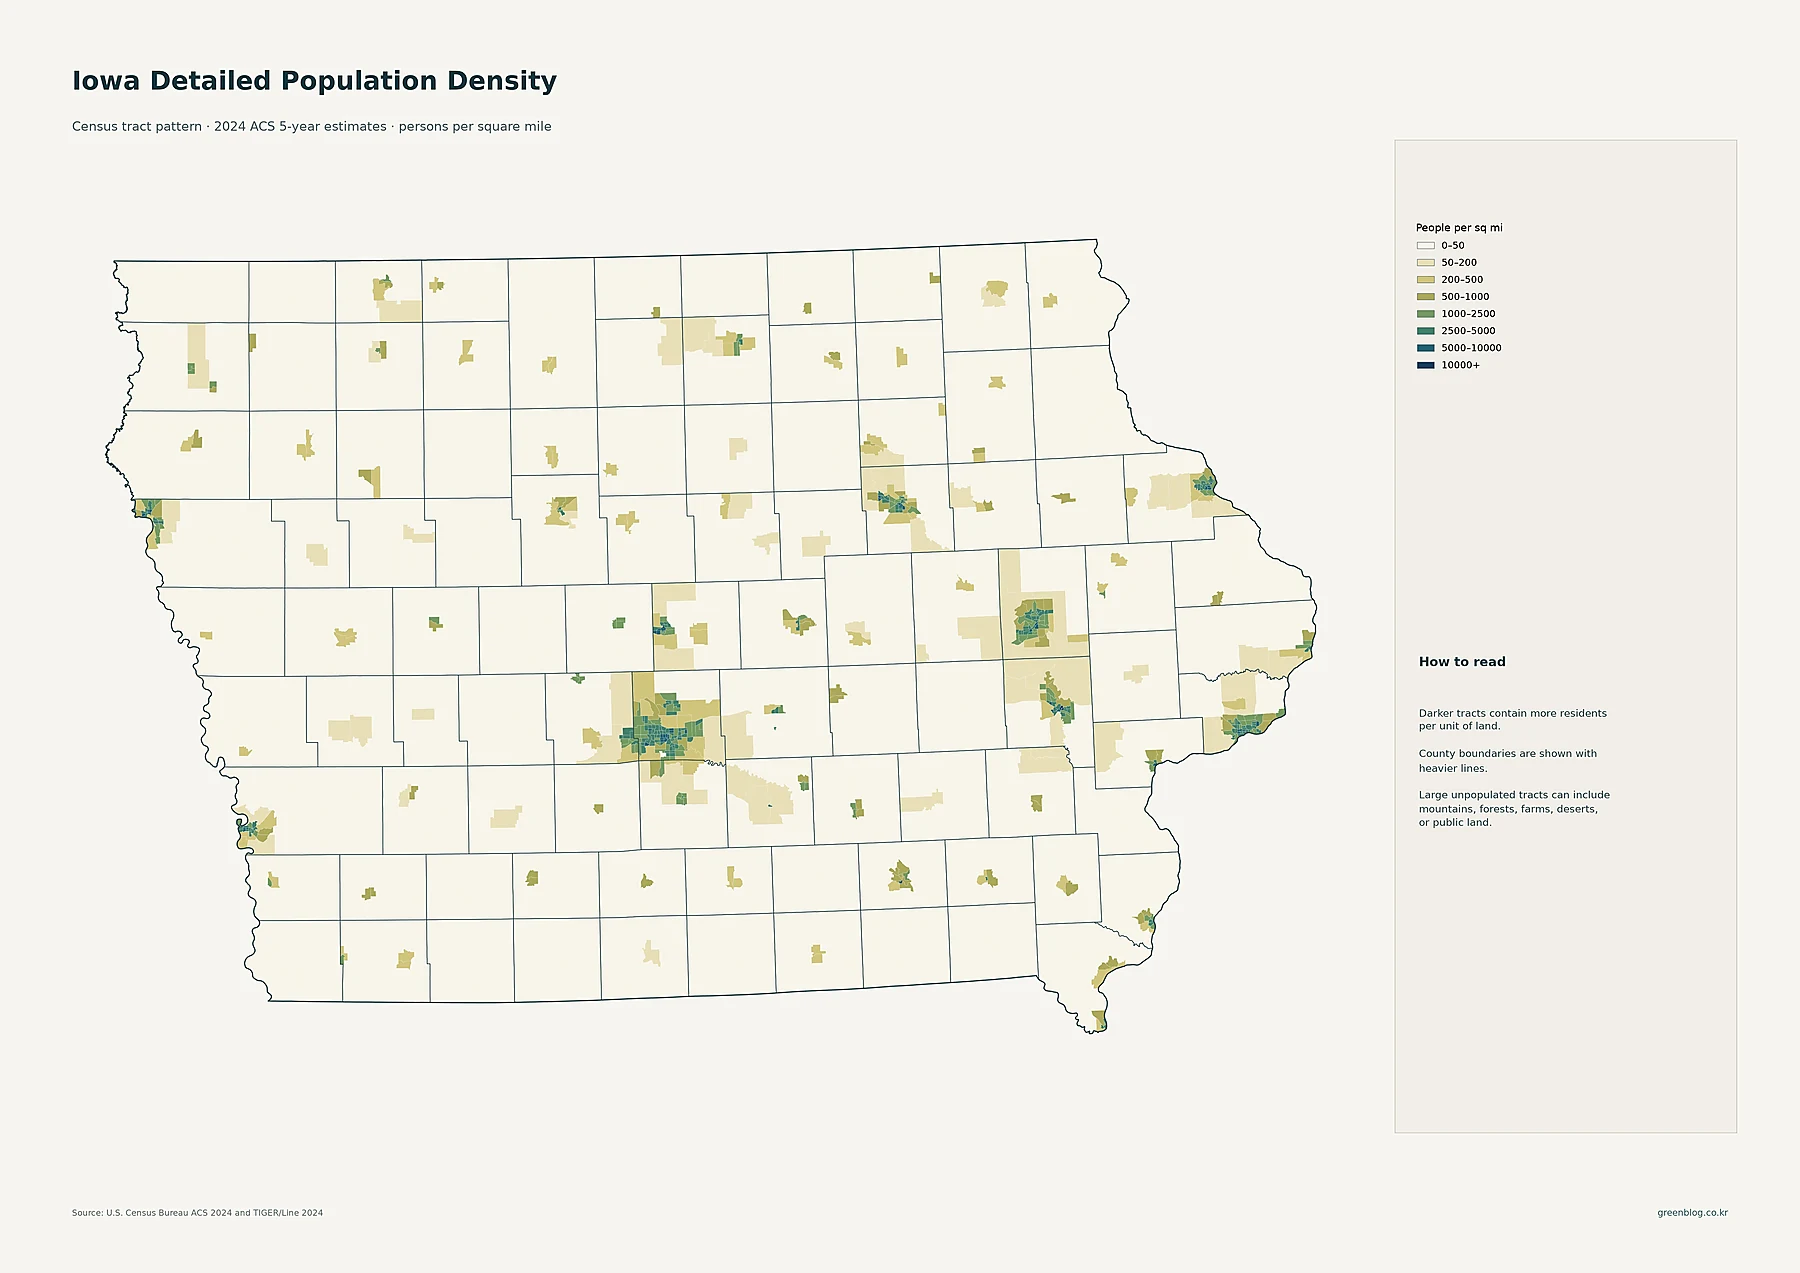
The detailed map classifies census tracts from 0–50 people per square mile to 10,000 or more. Central Iowa contains the largest connected group of darker tracts. Des Moines sits inside that cluster, with nearby West Des Moines, Ankeny, Urbandale, Waukee, and other developed tracts creating a wider metropolitan pattern that reaches beyond the core of Polk County. The tract view is especially helpful here because the population concentration does not stop neatly at a county boundary.
Eastern Iowa has several separate concentrations rather than one continuous block. Cedar Rapids and Marion form a strong cluster, Iowa City and Coralville stand out farther south, and Davenport–Bettendorf create another dense patch along the Mississippi River. Waterloo–Cedar Falls and Dubuque are also clearly visible. On the western side of the state, Sioux City and Council Bluffs appear as compact urban concentrations surrounded by much lighter rural tracts. Ames, Fort Dodge, Mason City, Ottumwa, and other smaller centers show the same pattern at a smaller scale: a concentrated urban footprint inside counties that are otherwise much less dense.
Des Moines is the largest census place, but Iowa has several distinct urban centers
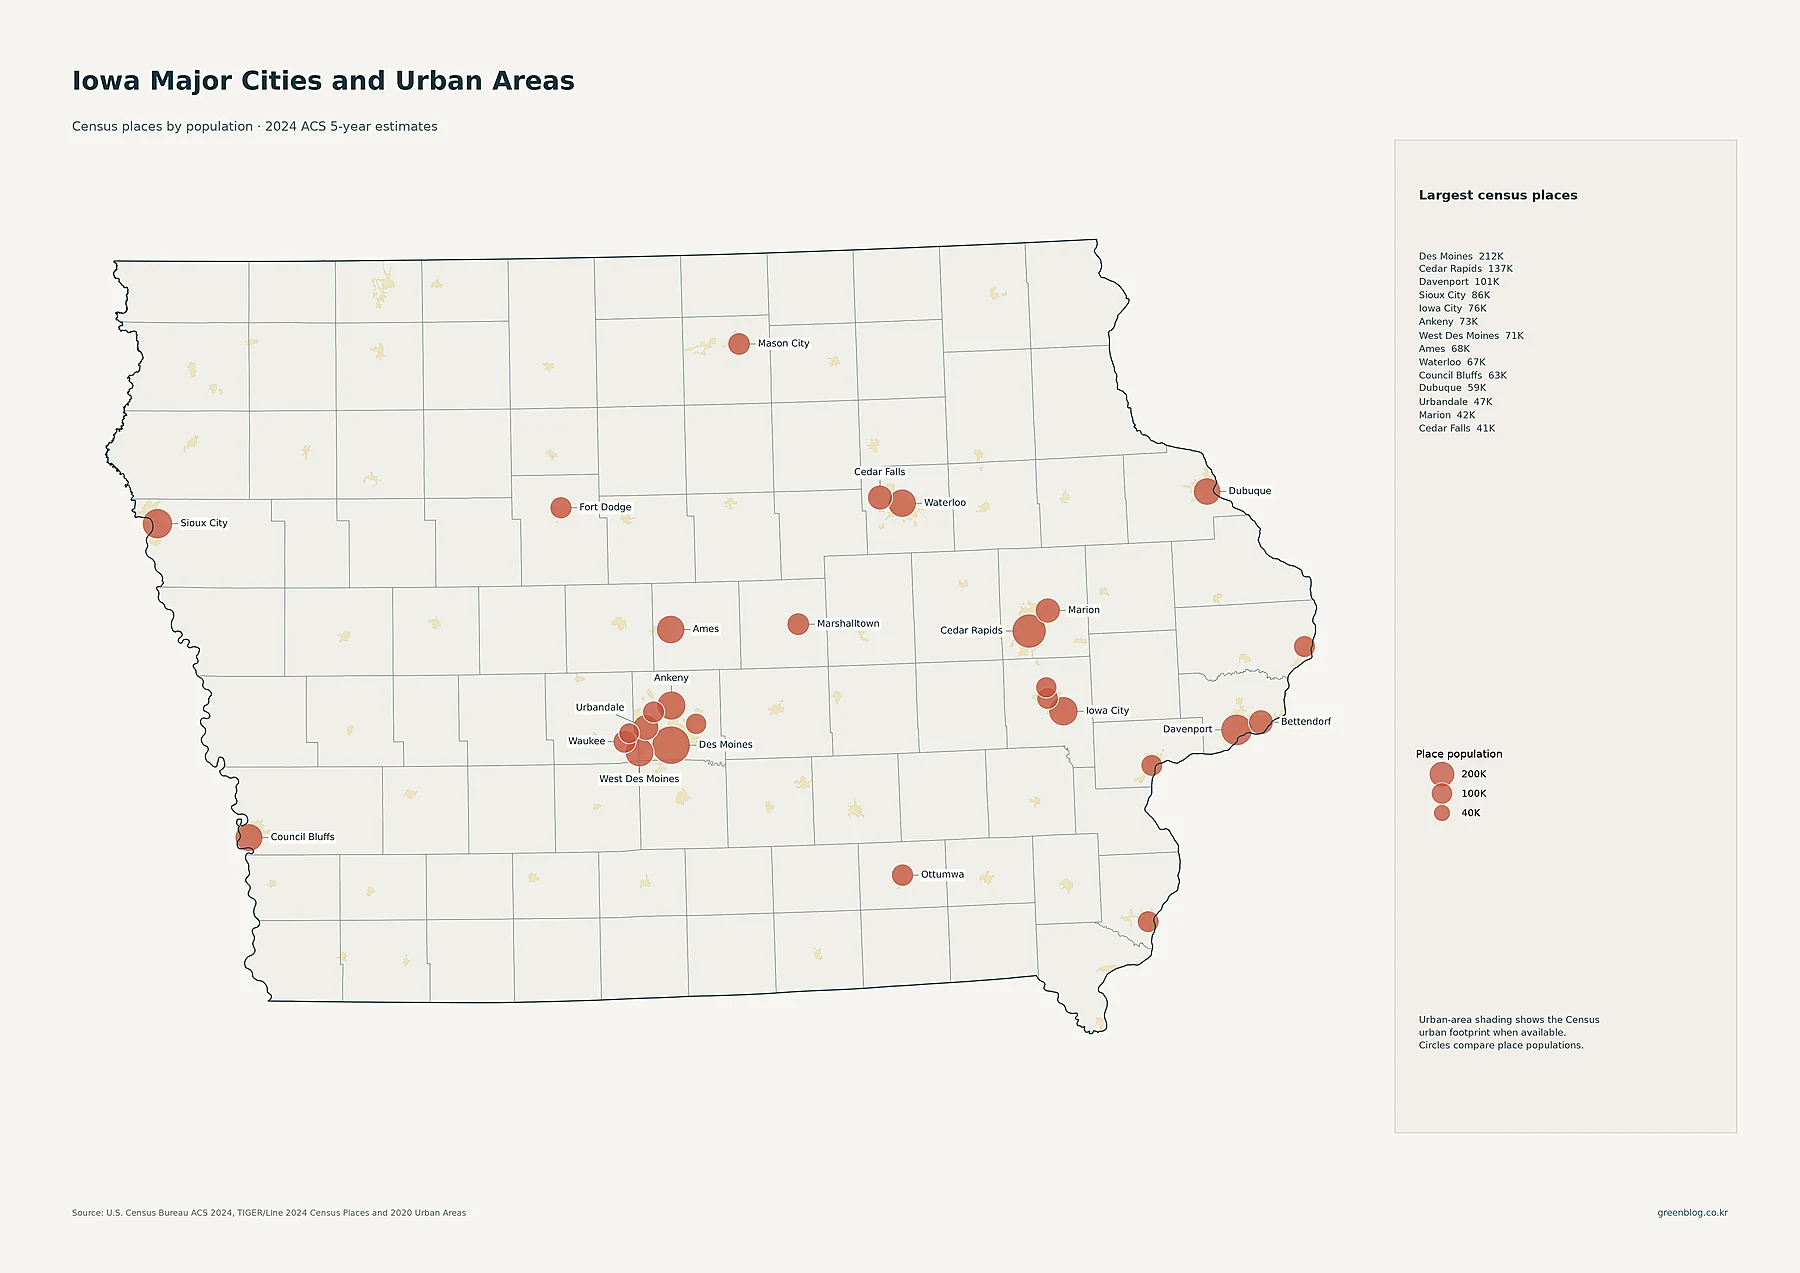
Des Moines has the largest census-place population in the supplied data at 212,421. Cedar Rapids is second at 137,264 and Davenport third at 100,913. The next group includes Sioux City at 86,101, Iowa City at 75,752, Ankeny at 72,615, West Des Moines at 71,083, Ames at 67,669, Waterloo at 67,008, Council Bluffs at 62,586, and Dubuque at 59,174. Urbandale has 46,595 residents, Marion 41,896, Cedar Falls 40,888, and Bettendorf 39,647.
The spatial arrangement matters as much as the ranking. Several of the larger places are packed around Des Moines, so the map reads as a metropolitan cluster rather than a single isolated city. Cedar Rapids, Iowa City, Davenport, Bettendorf, and Dubuque create a different pattern across eastern Iowa. Sioux City anchors the western border, Council Bluffs the southwest, and Waterloo–Cedar Falls another northeast-central cluster. The circles represent total place population. They should not be used as a substitute for the tract-density map, because city land area is not part of the circle-size comparison.
Polk County exceeds 500,000 residents and is more than twice the size of Linn
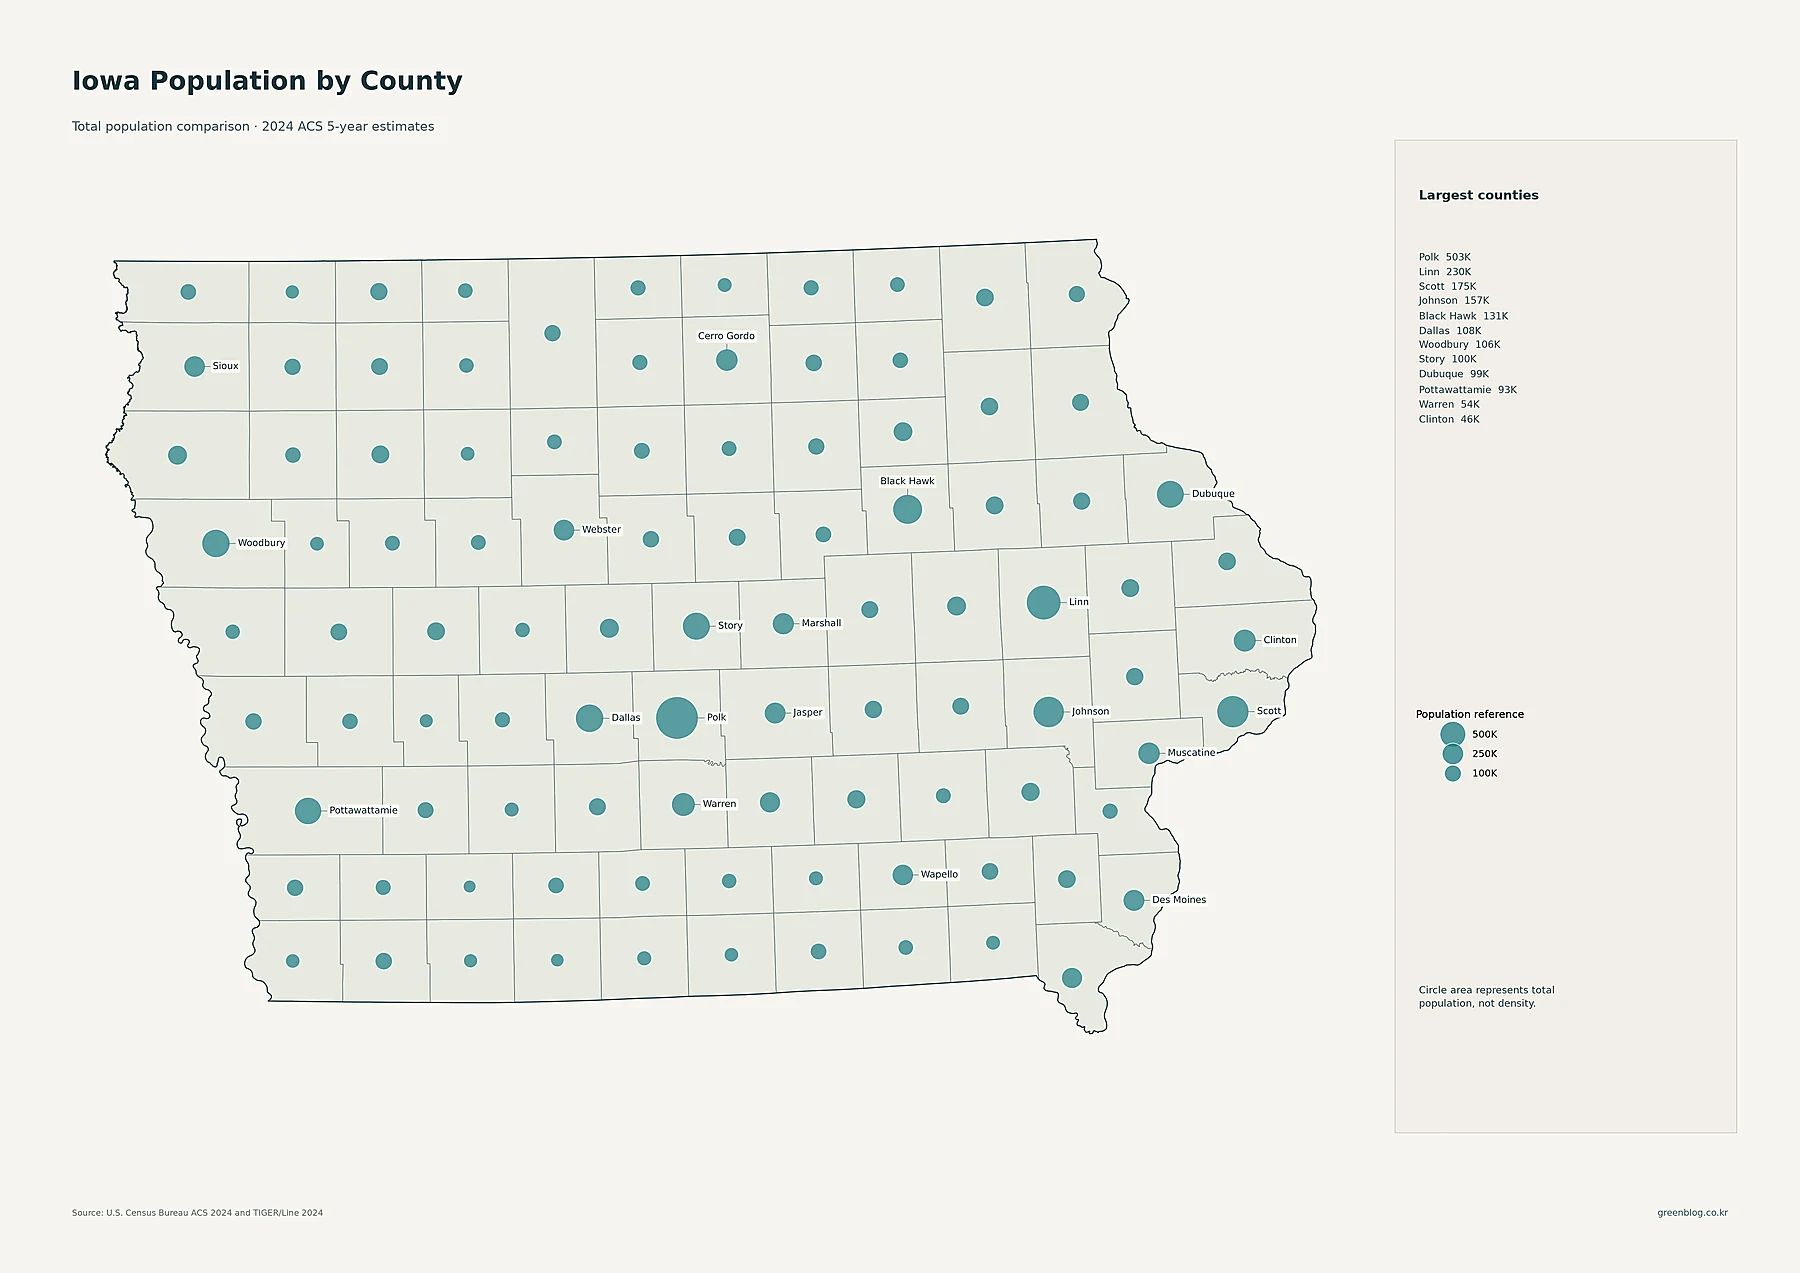
Polk County is the clear leader in total population at 503,175. Linn County is a distant second at 230,004, followed by Scott County at 174,608 and Johnson County at 156,639. Black Hawk County has 131,049 residents. Dallas County has 107,968, Woodbury 106,247, Story 100,466, Dubuque 99,030, and Pottawattamie 93,424. Warren County, immediately south of the Des Moines core, has 54,409, while Clinton County has 46,268.
This map makes Iowa’s population hierarchy easy to see. Polk dominates central Iowa. Linn, Johnson, and Scott form three large eastern circles associated with Cedar Rapids, Iowa City, and the Davenport area. Black Hawk and Dubuque reinforce the eastern and northeastern side of the state, while Woodbury and Pottawattamie stand out in the west. Yet county population alone cannot tell whether people occupy a compact urban area or are spread across a larger land area. That distinction becomes visible only when the measure changes to density.
County density places Polk first, with Scott, Linn, and Johnson forming the next tier
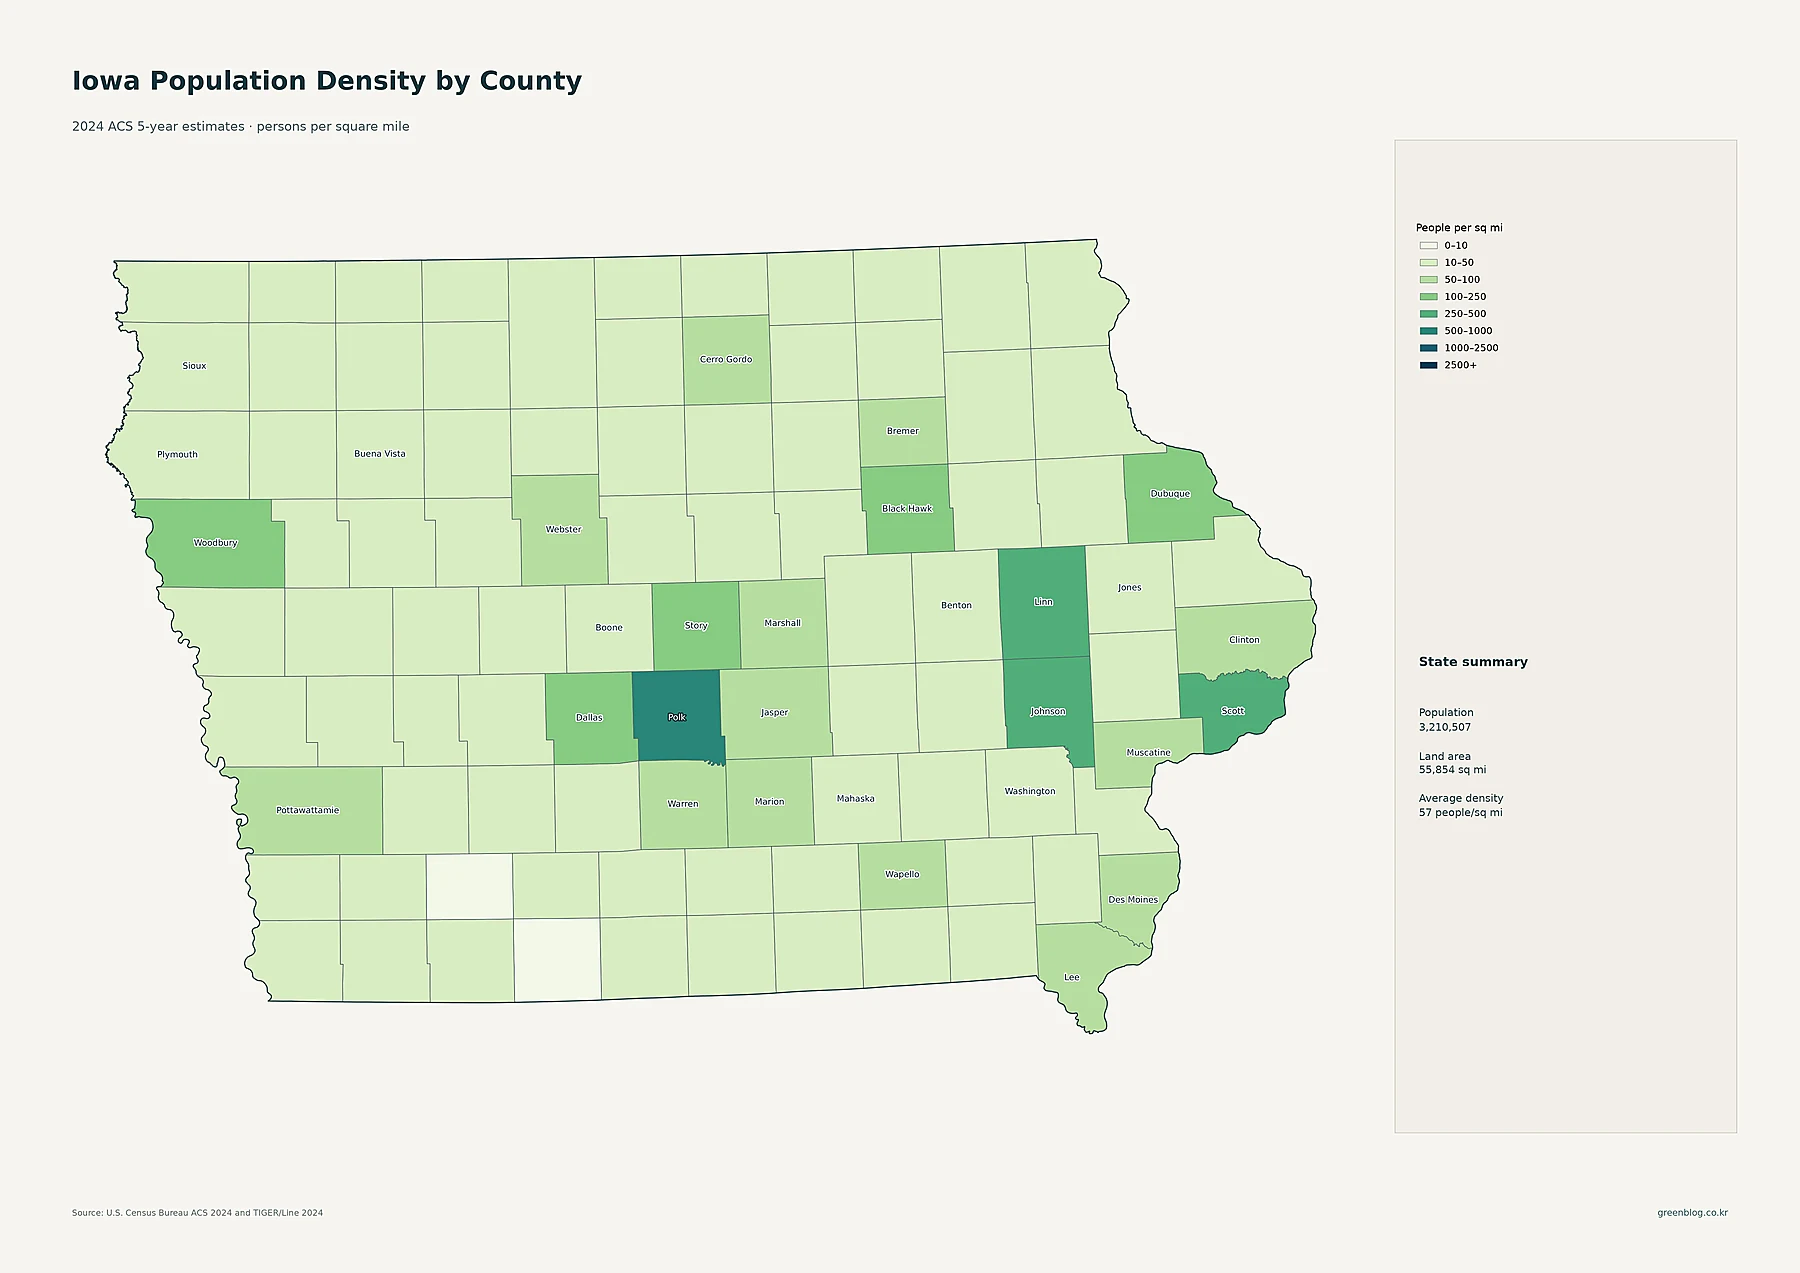
Polk County also ranks first in average density at about 879 people per square mile. Scott County is next at roughly 381, Linn at 321, Johnson at 256, and Black Hawk at 232. Dallas County is about 184 people per square mile, Story 175, Dubuque 163, and Woodbury 122. Pottawattamie and Muscatine are both close to 100, while Warren is about 96. These values put Iowa’s major urban counties at the darker end of the statewide county map.
The rural end of the scale is dramatically different. Adams County is about 8.6 people per square mile and Ringgold about 8.7. Taylor is roughly 11.0, Pocahontas 12.2, Monona 12.3, and Wayne 12.4. Large sections of western, northern, and southern Iowa therefore remain in the lightest density classes even though each county contains towns and local population centers. The statewide average of about 57 people per square mile should be read as a summary only; it sits between Polk’s high concentration and numerous rural counties with fewer than 20 residents per square mile.
| Measure | Leading area | Value in the supplied data |
|---|---|---|
| State population | Iowa | 3,210,507 |
| Largest county population | Polk | 503,175 |
| Highest county density | Polk | about 879/sq mi |
| Fastest 2010–2020 growth | Dallas | +50.7% |
| Largest 2010–2020 decline | Fremont | -11.2% |
Dallas County grew 50.7% from 2010 to 2020, far ahead of the statewide county field
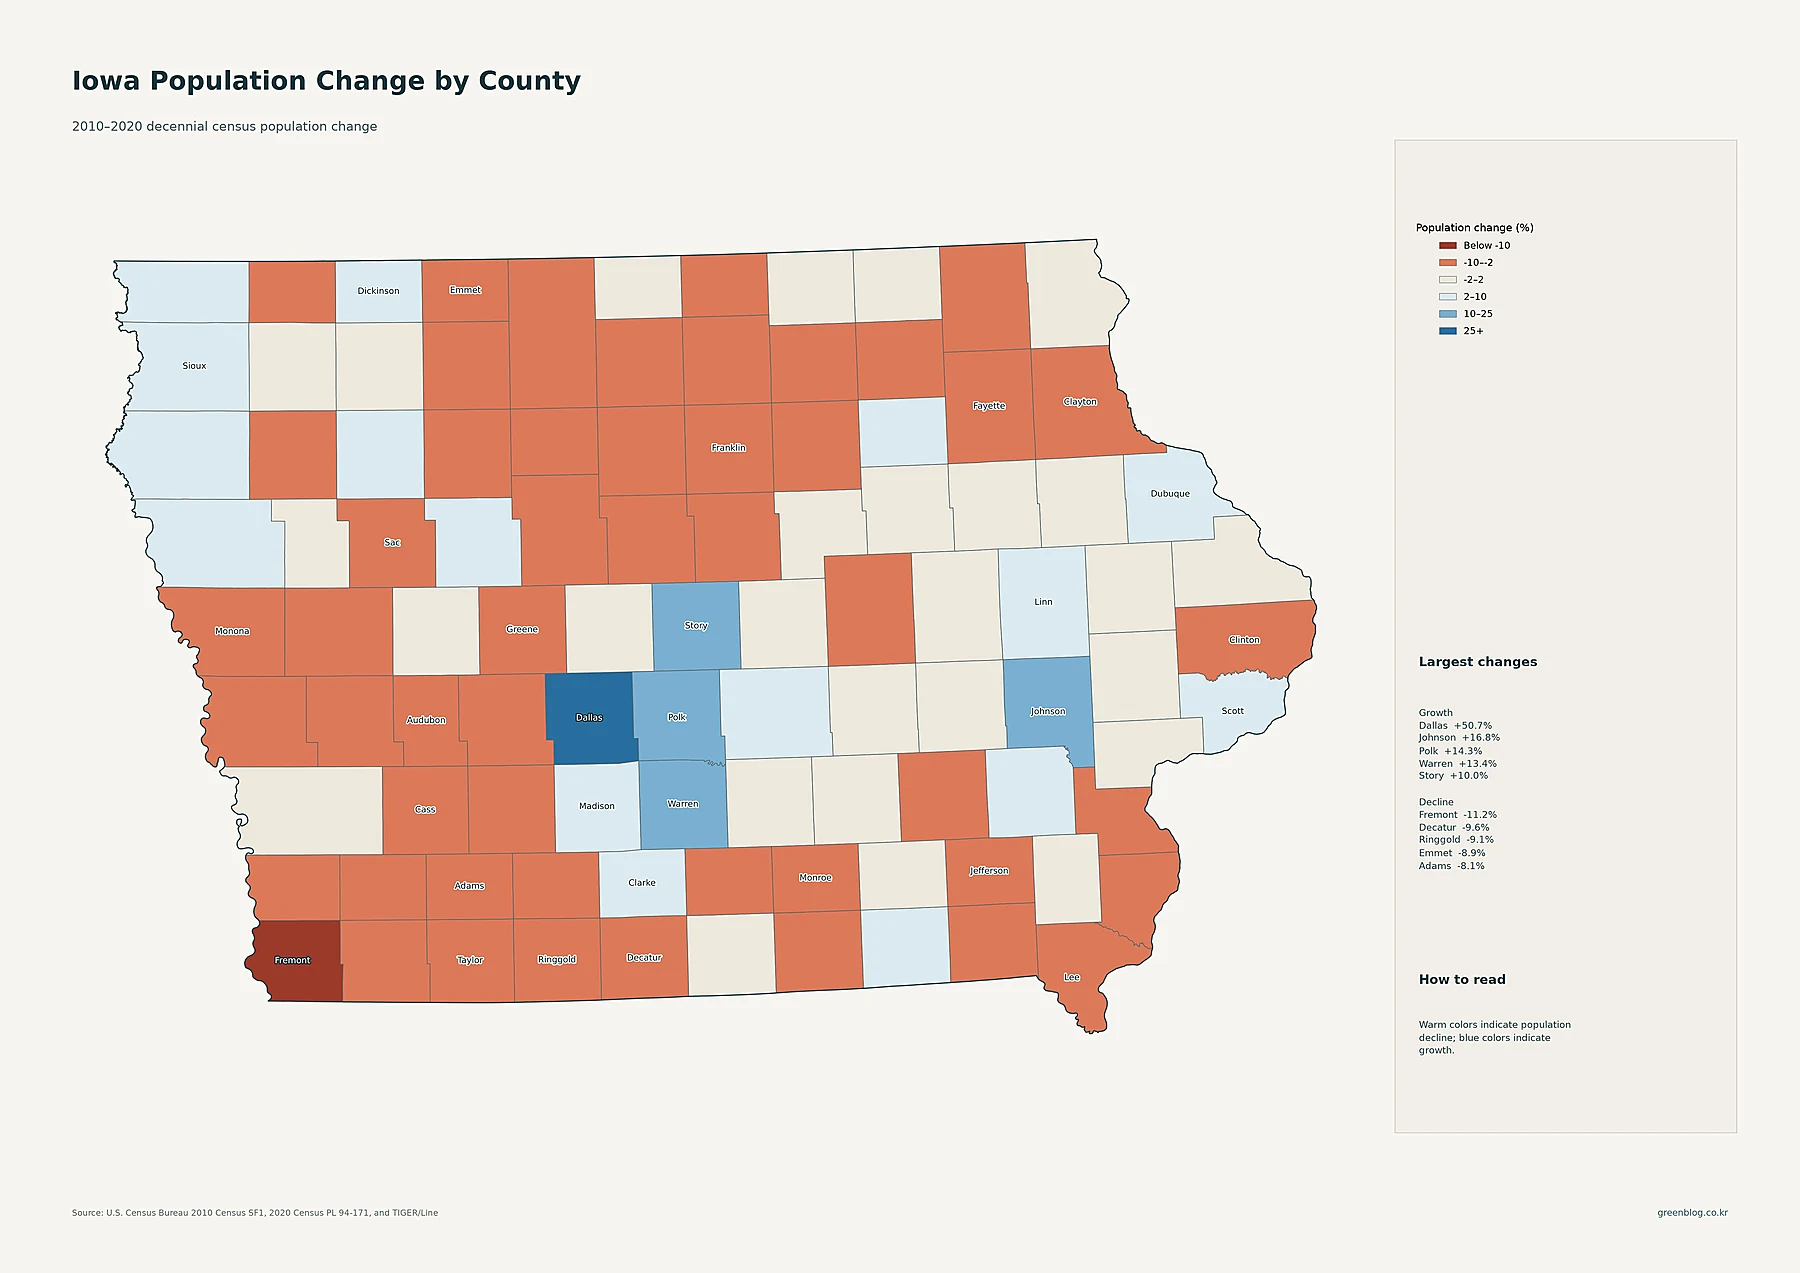
The decade-change map uses 2010 and 2020 Decennial Census counts, not the 2024 ACS estimates used in the current-population maps. Dallas County had by far the largest percentage increase at about 50.7%. Johnson County grew 16.8%, Polk 14.3%, Warren 13.4%, and Story 10.0%. Linn increased 9.0%, Sioux 6.4%, Dickinson 6.2%, Dubuque 6.0%, and Scott 5.7%. The strongest blue areas are concentrated around the Des Moines region and several of the state’s larger eastern urban counties.
Decline was widespread enough to create a very different pattern across many rural counties. Fremont County fell about 11.2%, the largest percentage decline in the supplied comparison. Decatur declined 9.6%, Ringgold 9.1%, Emmet 8.9%, and Adams 8.1%. Audubon, Jefferson, Taylor, Fayette, and Lee also lost population over the decade. Warm colors are scattered across the north, south, and west rather than confined to one corner of Iowa. The map identifies where population changed; it does not by itself identify the economic, demographic, or housing reasons behind those changes.
Taken together, the maps separate current size from concentration and recent growth
Polk County currently leads Iowa in both population and county-level density, and the tract map confirms that the Des Moines metro is the state’s broadest concentration of dense settlement. Dallas County tells a different story. Its 2024 population is 107,968, far below Polk’s total, yet its 2010–2020 growth rate of 50.7% is the highest in the state. Johnson and Warren also show relatively strong decade growth. The comparison is a useful reminder that the largest place today is not necessarily the place that grew fastest over the previous decade.
Eastern Iowa contributes another major share of the state’s population structure. Linn, Scott, Johnson, and Black Hawk rank high in both county population and density, matching the visible clusters around Cedar Rapids, Davenport, Iowa City, and Waterloo. Western population centers such as Sioux City and Council Bluffs are substantial but remain more isolated on the detailed density map. For practical use, the city map is best for locating major places, county circles for comparing totals, density maps for understanding concentration, and the 2010–2020 map for historical change. Reading all five together avoids confusing a large population with high density or rapid growth.
Download the Iowa population map collection
The ZIP collection includes the detailed census-tract density map, major cities and urban areas, county population totals, 2010–2020 county change, and county population density.
FAQ
Which Iowa county has the largest population and the highest density?
Polk County leads both measures in the supplied 2024 ACS data. It has 503,175 residents and an average density of about 879 people per square mile. Total population and density are still separate measures and should be compared independently.
Which Iowa county grew fastest between 2010 and 2020?
Dallas County had the largest percentage increase at about 50.7%. Johnson County grew about 16.8%, Polk 14.3%, and Warren 13.4%. These figures compare the 2010 and 2020 Decennial Census counts.
Why is Iowa’s statewide density average not enough to describe local settlement?
The statewide average is about 57 people per square mile, but Polk County is near 879 while Adams and Ringgold counties are below 9. Tract-level and county-level density maps reveal differences that a single statewide average cannot show.
Related Maps
Sources
- U.S. Census Bureau — American Community Survey (ACS): 2024 ACS 5-year population estimates.
- U.S. Census Bureau — TIGER/Line Shapefiles: 2024 county, census tract, and place geography used in the maps.
- U.S. Census Bureau — Decennial Census: 2010 and 2020 county population counts used for the change comparison.
Green Map creates custom-edited map images using open geographic data sources such as geoBoundaries, Natural Earth, OpenStreetMap, and government open data.
These maps are edited visual materials, not raw data files, and are provided for education, documents, presentations, and graphic reference.