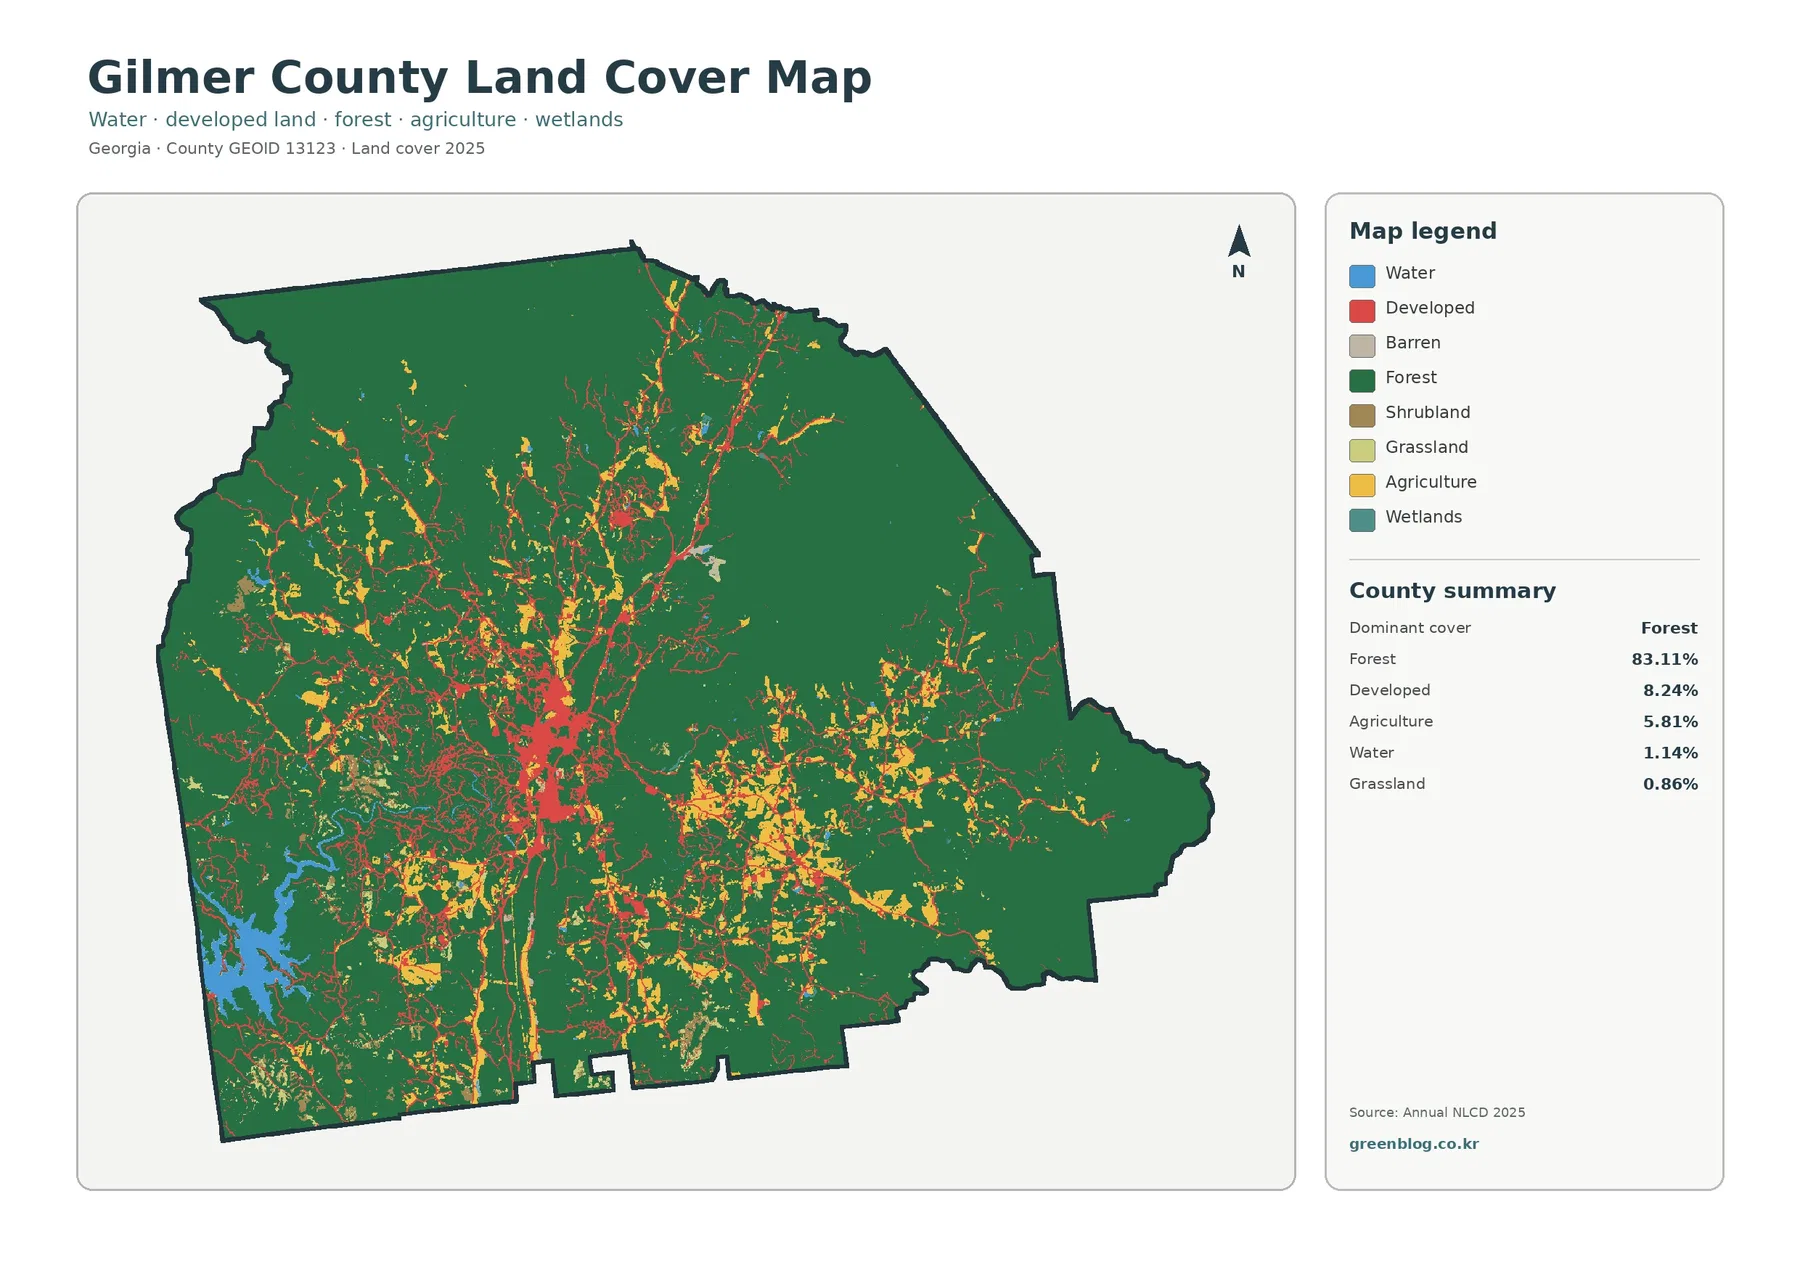
Forest is the defining land-cover pattern in Gilmer County, Georgia, but the county is not visually uniform. The 2025 summary assigns 83.11% of the area to forest, 8.24% to developed cover, and 5.81% to agriculture. Ellijay and East Ellijay form the clearest developed concentration near the center, while a large water feature associated with Carters Lake stands out in the southwest. The four maps on this page separate those broad patterns into current cover, forest and farmland, impervious surface, and mapped class differences from 1985 to 2025.
All four images can be viewed on the page, and the original JPG versions are packaged together in one ZIP below. A general land-cover image is useful when you need the county-wide balance of forest, development, agriculture, and water. The specialized views make smaller agricultural openings easier to find, isolate the hardest-built surfaces around Ellijay, and show where the 1985 and 2025 classifications differ. Using them together gives a clearer picture than treating one legend as a complete description of the county.
Table of Contents
Forest sets the scale for the entire county
Across the 2025 land-cover image, dark green forest occupies most of the county boundary. Large continuous wooded areas are especially obvious toward the north and east, but forest also surrounds many of the smaller open and developed patches elsewhere. The county summary lists water at 1.14% and grassland at 0.86%, so neither class approaches the area covered by forest. Even so, the water share is visually noticeable because much of it is concentrated in a large southwest feature rather than scattered evenly.
Developed cover needs to be read as a pattern rather than a single percentage. The 8.24% figure combines the central Ellijay-area cluster, narrow developed corridors, and many smaller patches outside the core. Agriculture behaves differently. Its 5.81% share appears as multiple openings within a predominantly wooded landscape instead of a broad, continuous farm belt. Looking at location and shape beside the summary percentages prevents the numbers from suggesting a distribution that the map does not actually show.
Land cover also has a narrower meaning than zoning or legal land use. These classes describe what the surface is mapped as being covered by—forest, water, agriculture, developed ground, and related categories. A forest-classified cell is not proof that the property is protected, and an agricultural class is not a zoning designation. Parcel rights, development rules, setbacks, and permits belong to county records and other legal or planning sources.
Carters Lake is the clearest water reference point
A large blue area in the southwest provides an easy geographic reference when comparing the maps. It connects with the Carters Lake area, and the U.S. Army Corps of Engineers describes the Carters Dam and Lake Project as extending across Gilmer, Murray, and Gordon counties. Forest reaches close to much of the visible water edge in the land-cover views, creating a strong contrast with the more intensely developed center around Ellijay.
That contrast is useful for environmental education and regional presentations because it puts two very different surface settings inside the same county outline. Around the lake, water and forest dominate the visual impression. Near the central towns, developed land and hard surfaces are much easier to find. Recreation access, public ownership, ramps, fishing facilities, and shoreline rules are not encoded in these images. Those questions should be answered with the Corps of Engineers’ project information or another purpose-built map.
Wetlands are a separate caution. Wetlands account for 0.06% in the forest-and-farmland summary, but that small county-wide share should not be treated as a surveyed wetland inventory. Raster classification generalizes the ground into grid cells, and narrow streamside or wet areas may not match a field delineation. The map is appropriate for broad comparison; a legal or site-specific wetland boundary requires more specialized evidence.
Ellijay becomes much clearer on the impervious-surface view
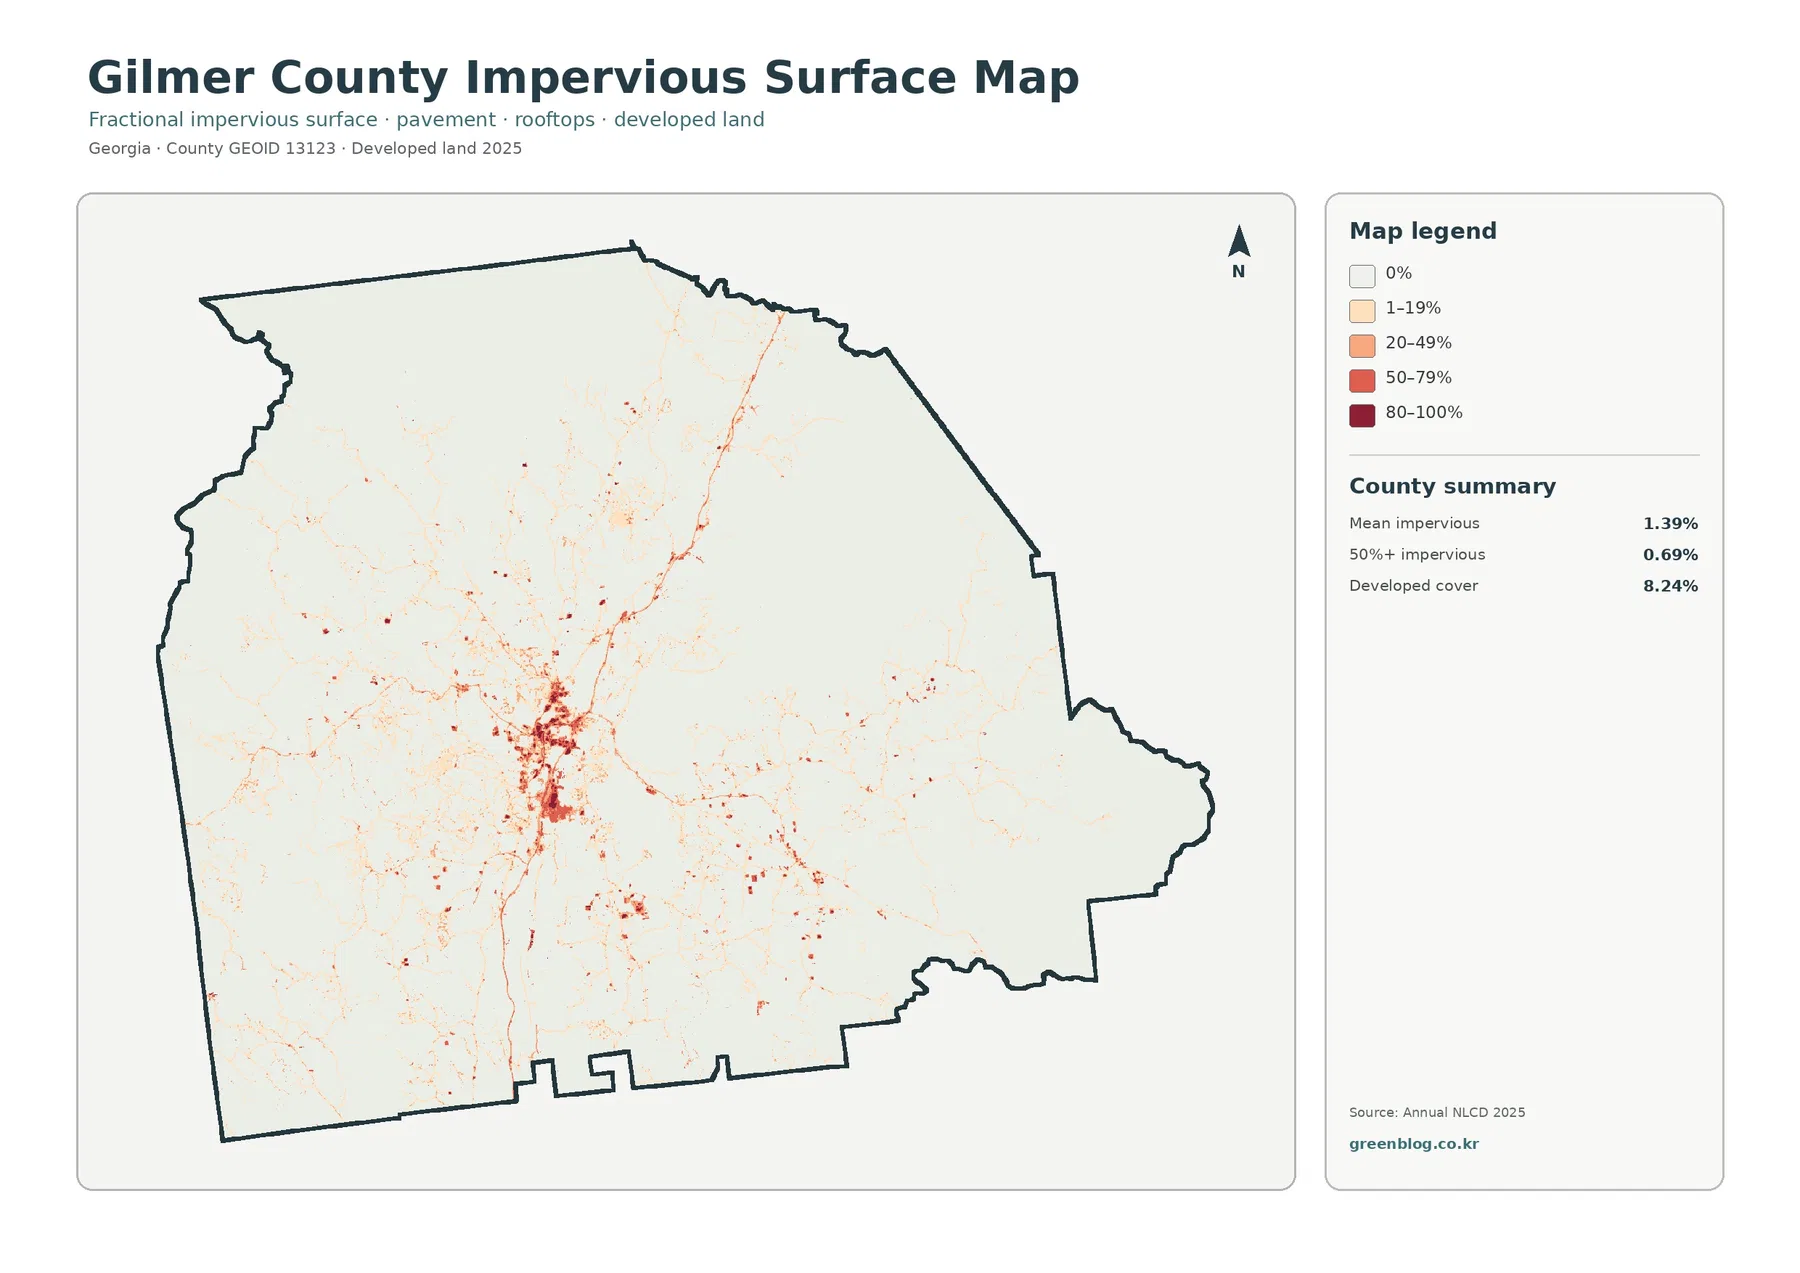
Impervious surface refers to pavement, rooftops, parking areas, and other hard surfaces that do not readily absorb rainfall. Countywide, the map reports a mean impervious value of 1.39%, while 0.69% of the area is mapped at 50% or greater impervious cover. Both values are far below the 8.24% developed-cover share. The broader developed class can include low-density areas where buildings and roads are mixed with trees, grass, soil, and other permeable ground.
Dark impervious colors cluster most strongly around Ellijay and East Ellijay. Thin lines extend away from that center, and smaller isolated concentrations appear elsewhere, while much of the forested east and northeast remains very light. This view separates the county’s hardest-built core from the broader developed class. It is therefore more useful than the general map when the question concerns pavement and rooftops rather than development in the wider land-cover sense.
Hard-surface concentration can be relevant to watershed discussions, but it is not a stand-alone flood-risk map. Runoff also depends on slope, soils, drainage infrastructure, rainfall, stream conditions, and other factors. A reasonable use is to identify where impervious cover is concentrated and compare those places with forested areas. Engineering design, drainage decisions, and flood-hazard conclusions need more specific hydrologic information.
Agricultural openings are small against the forested background
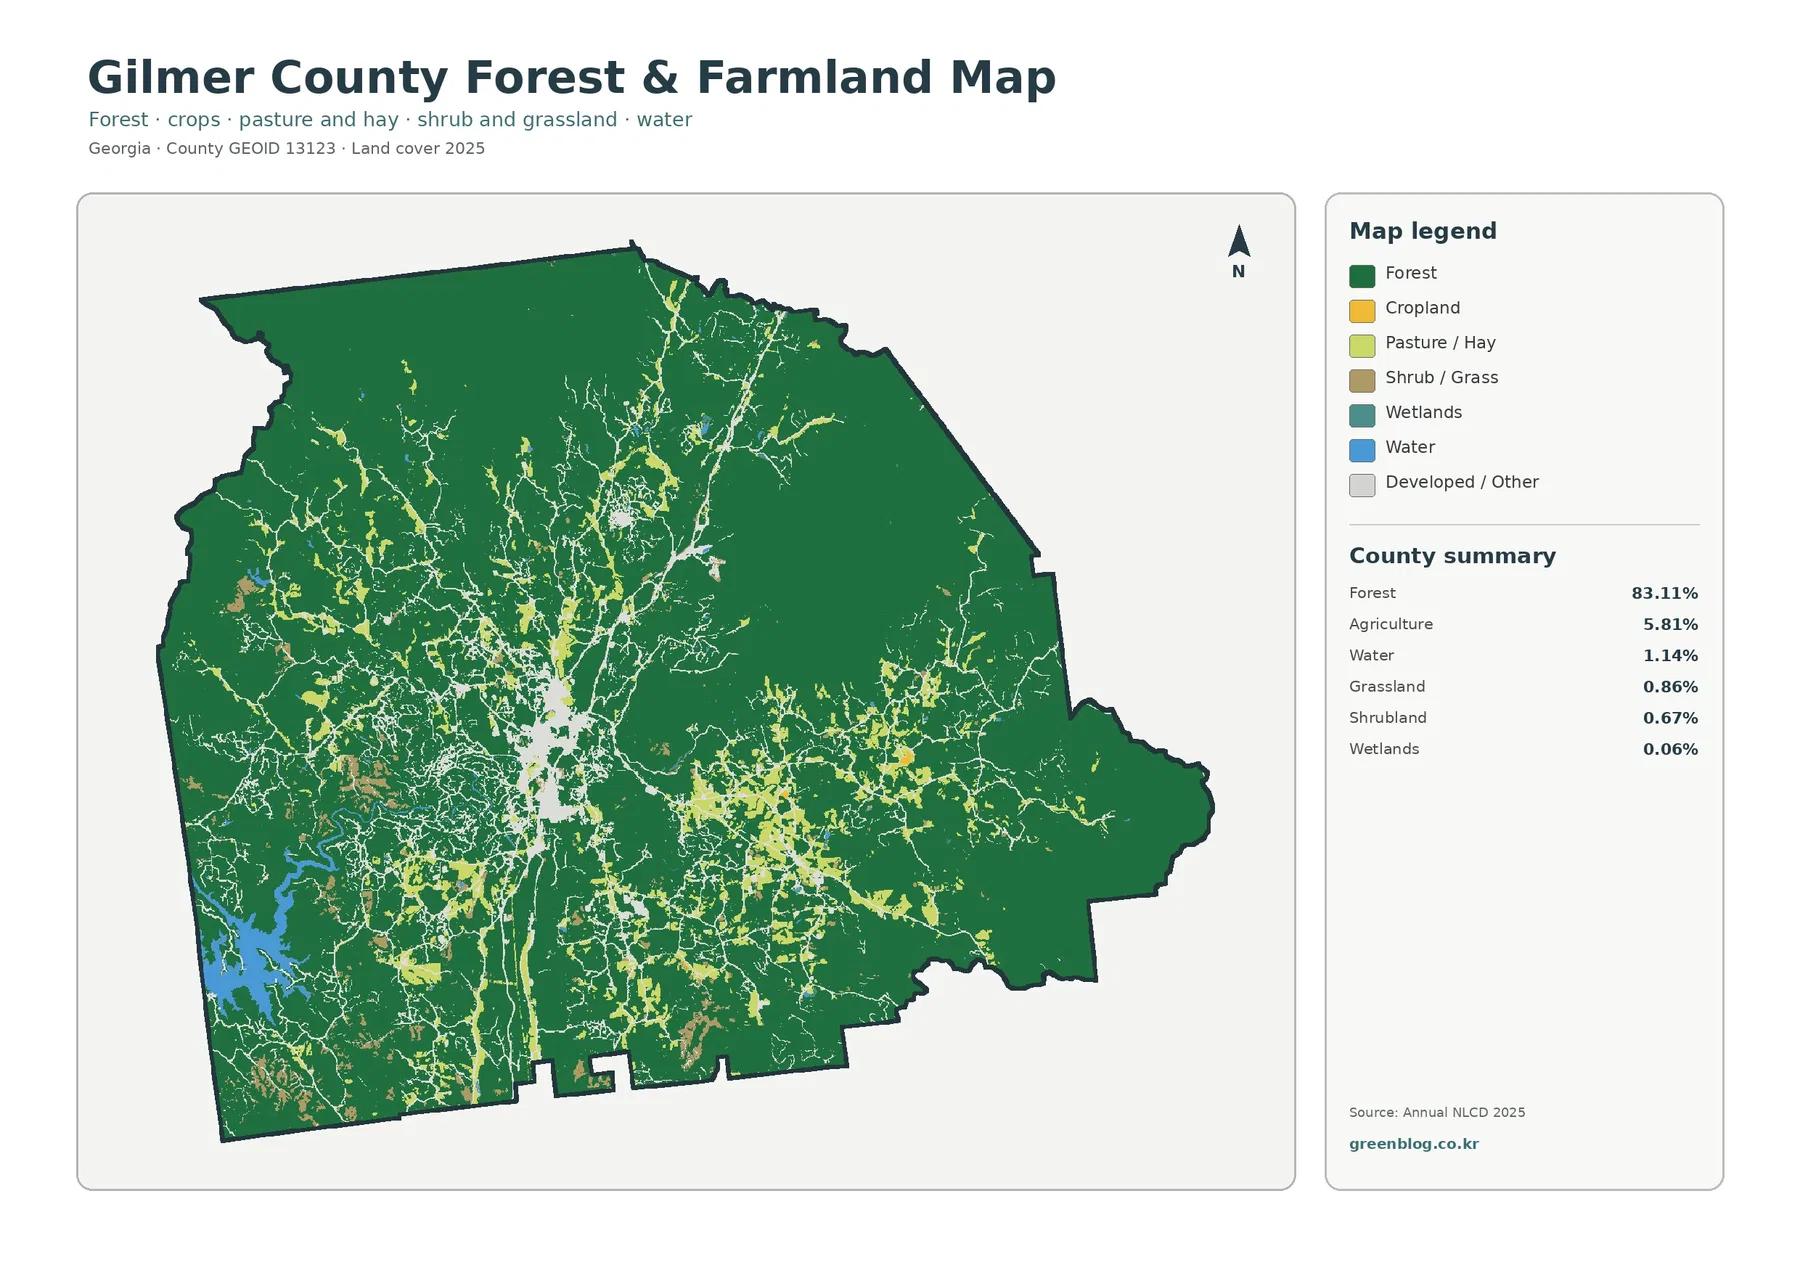
The forest-and-farmland view simplifies the legend so smaller open areas are easier to see. Forest remains 83.11%, while agriculture is 5.81%, water 1.14%, grassland 0.86%, shrubland 0.67%, and wetlands 0.06%. Agricultural colors appear in many separated patches, including visible concentrations around the central and southeastern parts of the county, rather than forming one large agricultural district.
Apple production is a familiar part of local agriculture, and UGA Extension provides county agriculture and natural-resource information. That local context should not be used to label every agricultural pixel as an orchard. The map does not identify individual crops or farm boundaries. Cropland, pasture or hay, and related open-cover categories are generalized surface classes, so a crop-specific question requires agricultural records, aerial imagery, or field information.
The simplified view is especially useful when an audience finds the full land-cover legend too busy. Broad forest can be recognized immediately, and the smaller agricultural openings become easier to compare with water and developed or other surfaces. It still does not measure slope, soil quality, or farm suitability. Those are separate characteristics that need their own datasets.
Mapped differences from 1985 to 2025 need careful language
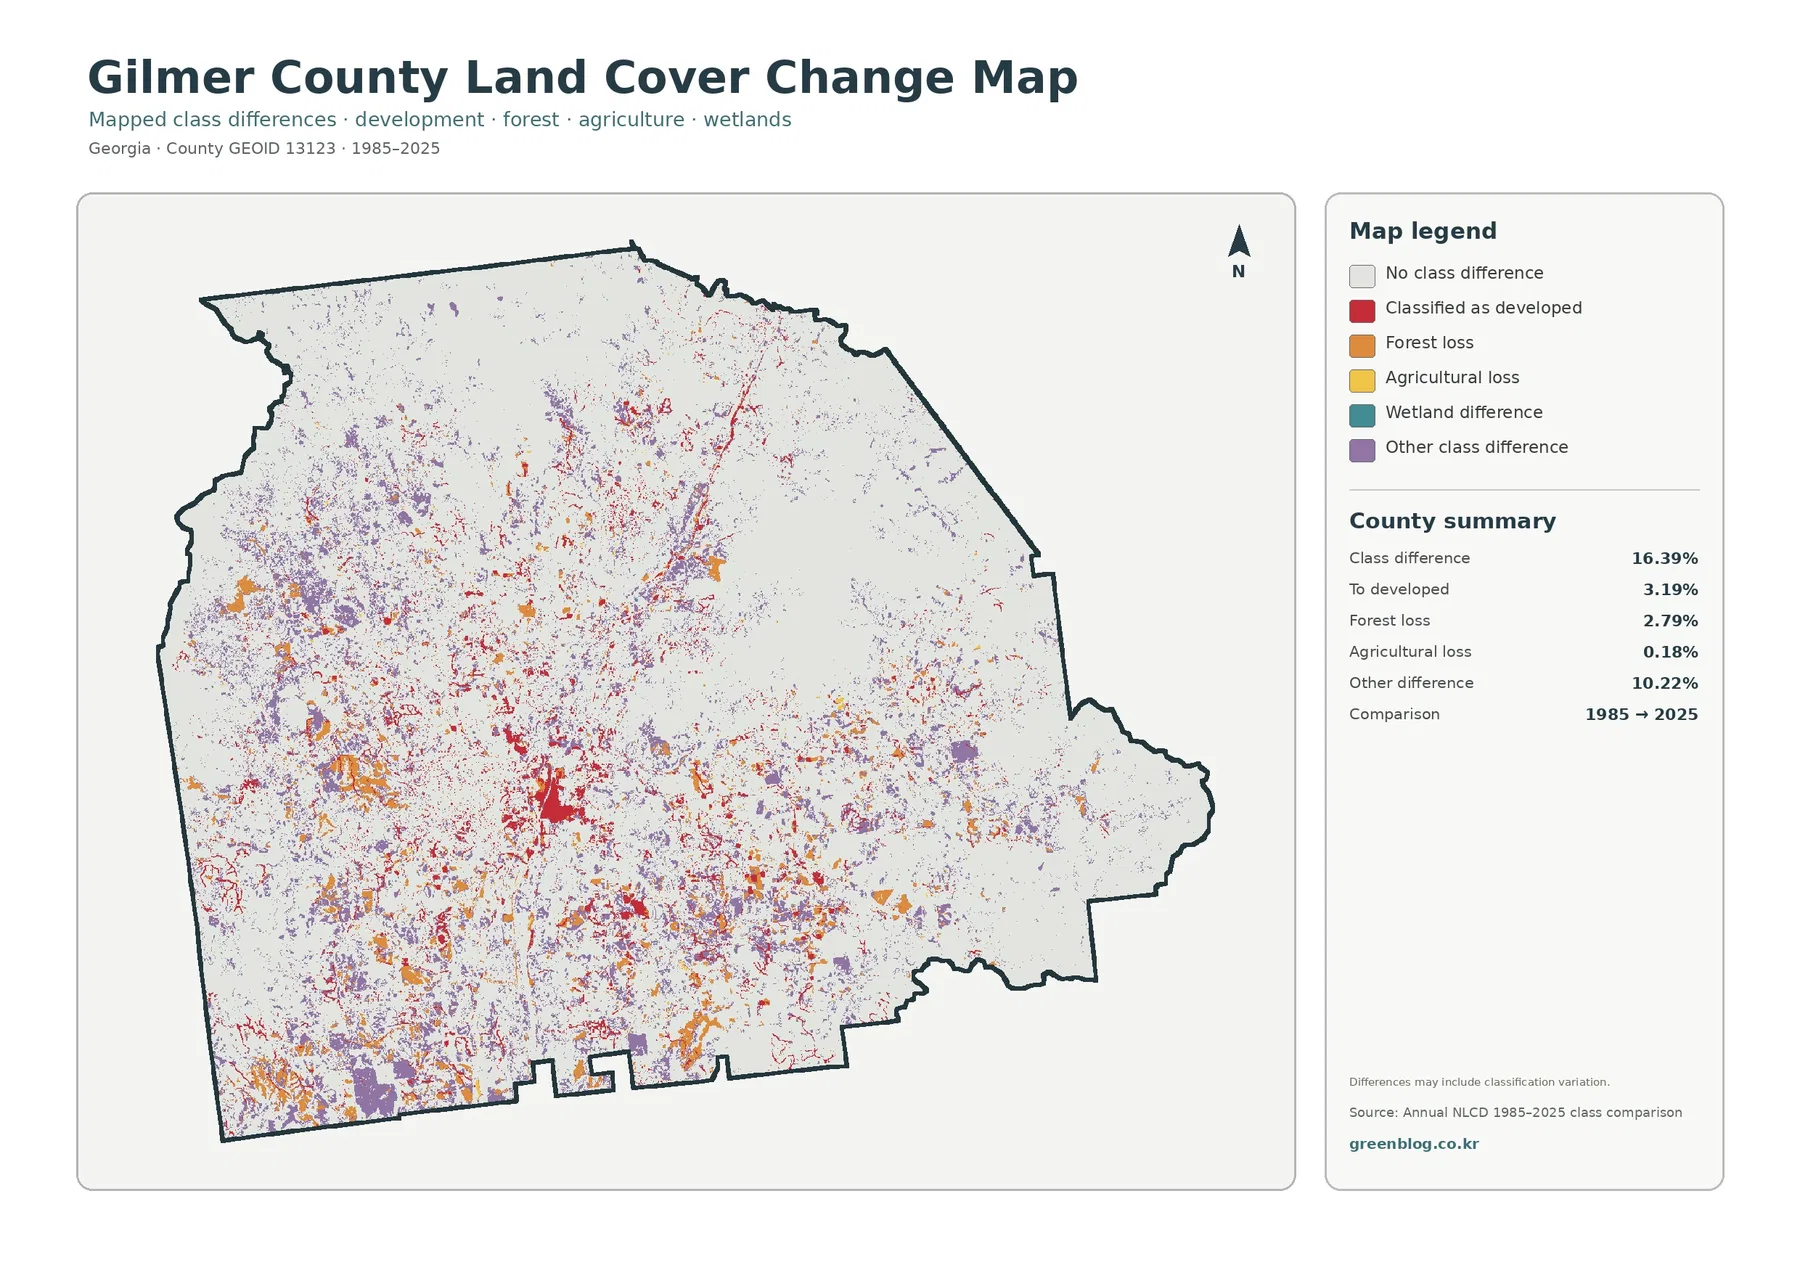
Comparing two endpoints, the change image places the 1985 and 2025 classifications side by side. Its summary marks 16.39% of the county with a class difference. Within that total, 3.19% is listed as change to developed, 2.79% as forest loss, and 0.18% as agricultural loss. Another 10.22% is grouped as other class difference. Areas without a mapped difference remain light, making the colored clusters easier to locate.
Change-to-developed colors are conspicuous around the central Ellijay area and along several settled corridors. Forest-loss and other-difference colors are more scattered, with visible patches in western and southern portions as well as smaller marks elsewhere. Many parts of the broad northern and eastern forest contain less change color, although they are not completely blank. The distribution suggests that mapped differences are uneven rather than spread at the same intensity across the county.
A colored change pixel is not automatically proof of a specific construction project or a confirmed clearing event. The image itself warns that classification variation may be included. Differences in source imagery, classification methods, mixed pixels, seasonal conditions, and boundaries between classes can affect an endpoint comparison. When a particular site matters, historical aerial photographs, intermediate-year imagery, permits, or other local records should be checked before assigning a cause or exact date.
Four maps answer different parts of the same question
Start with the general land-cover map when the goal is a county-wide overview. It places forest, development, agriculture, water, grassland, shrubland, and wetlands in one frame. Switch to the forest-and-farmland image when smaller open agricultural areas need more emphasis. Use the impervious layer for the intensity of hard surfaces, and the change layer for the location of endpoint class differences rather than current cover.
Ellijay is a useful test location because the map types produce visibly different answers there. The general image shows a relatively broad developed area. The impervious image darkens only the places with a higher share of pavement and rooftops, leaving lower-density developed surroundings much lighter. Around the towns, the forest-and-farmland view simplifies wooded and open land. A separate time comparison comes from the change image, which does not identify the exact year or cause of each difference.
Carters Lake provides a second comparison point. Water dominates the first impression on the general map, and forest is emphasized around it in the forest-focused view. Dark impervious surface is much more limited there than in central Ellijay. In the southwest, scattered colors on the change image mark class differences but do not measure reservoir level or shoreline movement. Hydrologic questions about the lake require reservoir and water records rather than a land-cover classification.
Scale, pixels, and dates set important limits
County percentages summarize area but say nothing about whether a class forms one block, a corridor, or many small patches. Those developed and agricultural shares illustrate that problem clearly. A presentation that quotes 8.24% developed cover or 5.81% agriculture should also describe where those classes occur. Pairing a number with its spatial pattern gives the audience a much more accurate picture of the county.
Raster products represent the landscape as a grid of cells. One cell can contain several real surfaces, such as trees, lawn, a road, and a building, before being assigned a representative class. That mixed-pixel effect means a narrow road, small stream, isolated structure, or tiny field may not line up perfectly with aerial photography at high zoom. The maps are designed for consistent county-scale comparison, not parcel surveying or exact feature tracing.
The current-cover products are labeled 2025, so they should be described as a 2025 classification rather than a live view. Construction, clearing, regrowth, or agricultural changes after the observation and processing period may be absent. The 1985–2025 image compares two endpoints and likewise cannot tell you the specific year in which a colored pixel changed. A detailed timeline needs additional dates.
Practical uses for the downloadable JPG set
A classroom exercise can begin with forest dominance and then move to the contrast between developed cover and impervious surface. Students can locate the 83.11% forest pattern, identify the Ellijay developed cluster, and compare the 8.24% developed share with the 1.39% mean impervious value. Adding the change map afterward makes it possible to discuss why an endpoint class difference should be verified before being described as a specific real-world event.
For a local presentation, Ellijay, the broad forested east, and Carters Lake provide three easy reference areas. The set can show a built center, extensive mountain forest, smaller agricultural openings, and a major water feature without changing county boundaries between images. When the topic shifts to water quality, flood hazards, landslides, habitat condition, or zoning, the land-cover maps should be paired with data designed for those questions.
The downloadable ZIP contains four original JPG files at 2480×1754 pixels each. They are easier to place in slides or documents than browser screenshots and can be used individually or side by side. For large-format printing, calculate the resulting pixels per inch from the intended physical size rather than assuming these files satisfy an A3 300-dpi specification.
Land-cover classification does not replace planning records
For legal and development matters, Gilmer County Planning & Zoning addresses zoning, development review, land-use rules, and planning topics that are separate from this classification. A wooded pixel does not establish a legal restriction, and a developed pixel does not identify a residential, commercial, or industrial zoning district. Property purchases, construction, subdivision, permitting, and boundary questions should rely on official records and appropriate professional surveys.
At county scale, however, the four-map set is useful because its main patterns are easy to compare. Forest dominates most of Gilmer County, and the strongest developed and impervious concentration is centered on Ellijay. Agricultural openings remain scattered within the wooded setting, while Carters Lake provides a clear southwest water feature. A final layer comes from the change map, which shows where the 1985 and 2025 classifications differ. Used within those limits, the maps provide a practical visual summary without claiming parcel-level precision.
Frequently Asked Questions
What is the dominant land cover in Gilmer County?
Forest is the dominant 2025 class at 83.11% of the county. Developed cover is 8.24% and agriculture is 5.81%. The map also supports the percentage visually: broad forest areas surround the central Ellijay development cluster and the smaller open patches elsewhere.
Why is Ellijay darker on the impervious-surface map?
Ellijay and East Ellijay contain the county’s strongest concentration of buildings, pavement, parking areas, and major roads, so higher impervious values cluster there. The county-wide mean is only 1.39%, and just 0.69% of the county is mapped at 50% or greater impervious cover, making the central contrast especially easy to see.
Does every colored pixel on the 1985–2025 map represent a confirmed physical change?
No. The image compares mapped classes at two endpoints, and its own note warns that classification variation may be included. Some differences can represent real development, forest loss, or other surface change, while others may be affected by classification methods or mixed pixels. Site-specific conclusions need additional imagery or records. Map File Information The ZIP contains the four original JPG maps used for this Gilmer County land-cover set.
Map File Information
Download the map files associated with this page for reference, printing, and compatible visual projects.
- Included Files: Use only the versions confirmed in the article and supplied images
- File Type: Use the confirmed download contents
- Intended Use: Printing, education, presentations, and map-based projects
Related Maps
- Appling County Georgia Land Cover Map
- Atkinson County Georgia Land Cover Map
- Bacon County Georgia Land Cover Map
Sources and references
- MRLC Annual NLCD Data – official access and background for annual national land-cover products.
- USGS Annual NLCD Land Cover Classification – class definitions and context for interpreting the mapped categories.
- Gilmer County Planning & Zoning – official local information for zoning, development review, and planning matters that are separate from land cover.
- UGA Extension – Gilmer County – county information related to agriculture and natural resources.
- U.S. Army Corps of Engineers – Carters Lake – official information about Carters Lake and the surrounding project area.
Green Map creates custom-edited map images using open geographic data sources such as geoBoundaries, Natural Earth, OpenStreetMap, and government open data.
These maps are edited visual materials, not raw data files, and are provided for education, documents, presentations, and graphic reference.