Agriculture is the largest 2025 land-cover class in Decatur County, but the county does not look like one continuous farm belt. Large field blocks dominate much of the north and northwest, while forest, wetlands, and water become much more prominent toward the center and south. This Decatur County Georgia Land Cover Map set makes those contrasts easy to compare, including the developed concentration around Bainbridge and the river corridor running through the county.
Four WebP previews are included below: 2025 land cover, forest and farmland, impervious surface, and a 1985–2025 class-difference map. The four original 2480 × 1754-pixel JPG maps are also available together in one ZIP. They work well for county profiles, classroom material, presentations, environmental comparisons, and other projects that need a countywide view rather than parcel-level detail.
Table of Contents
A county where fields, forest, and wet ground divide the landscape
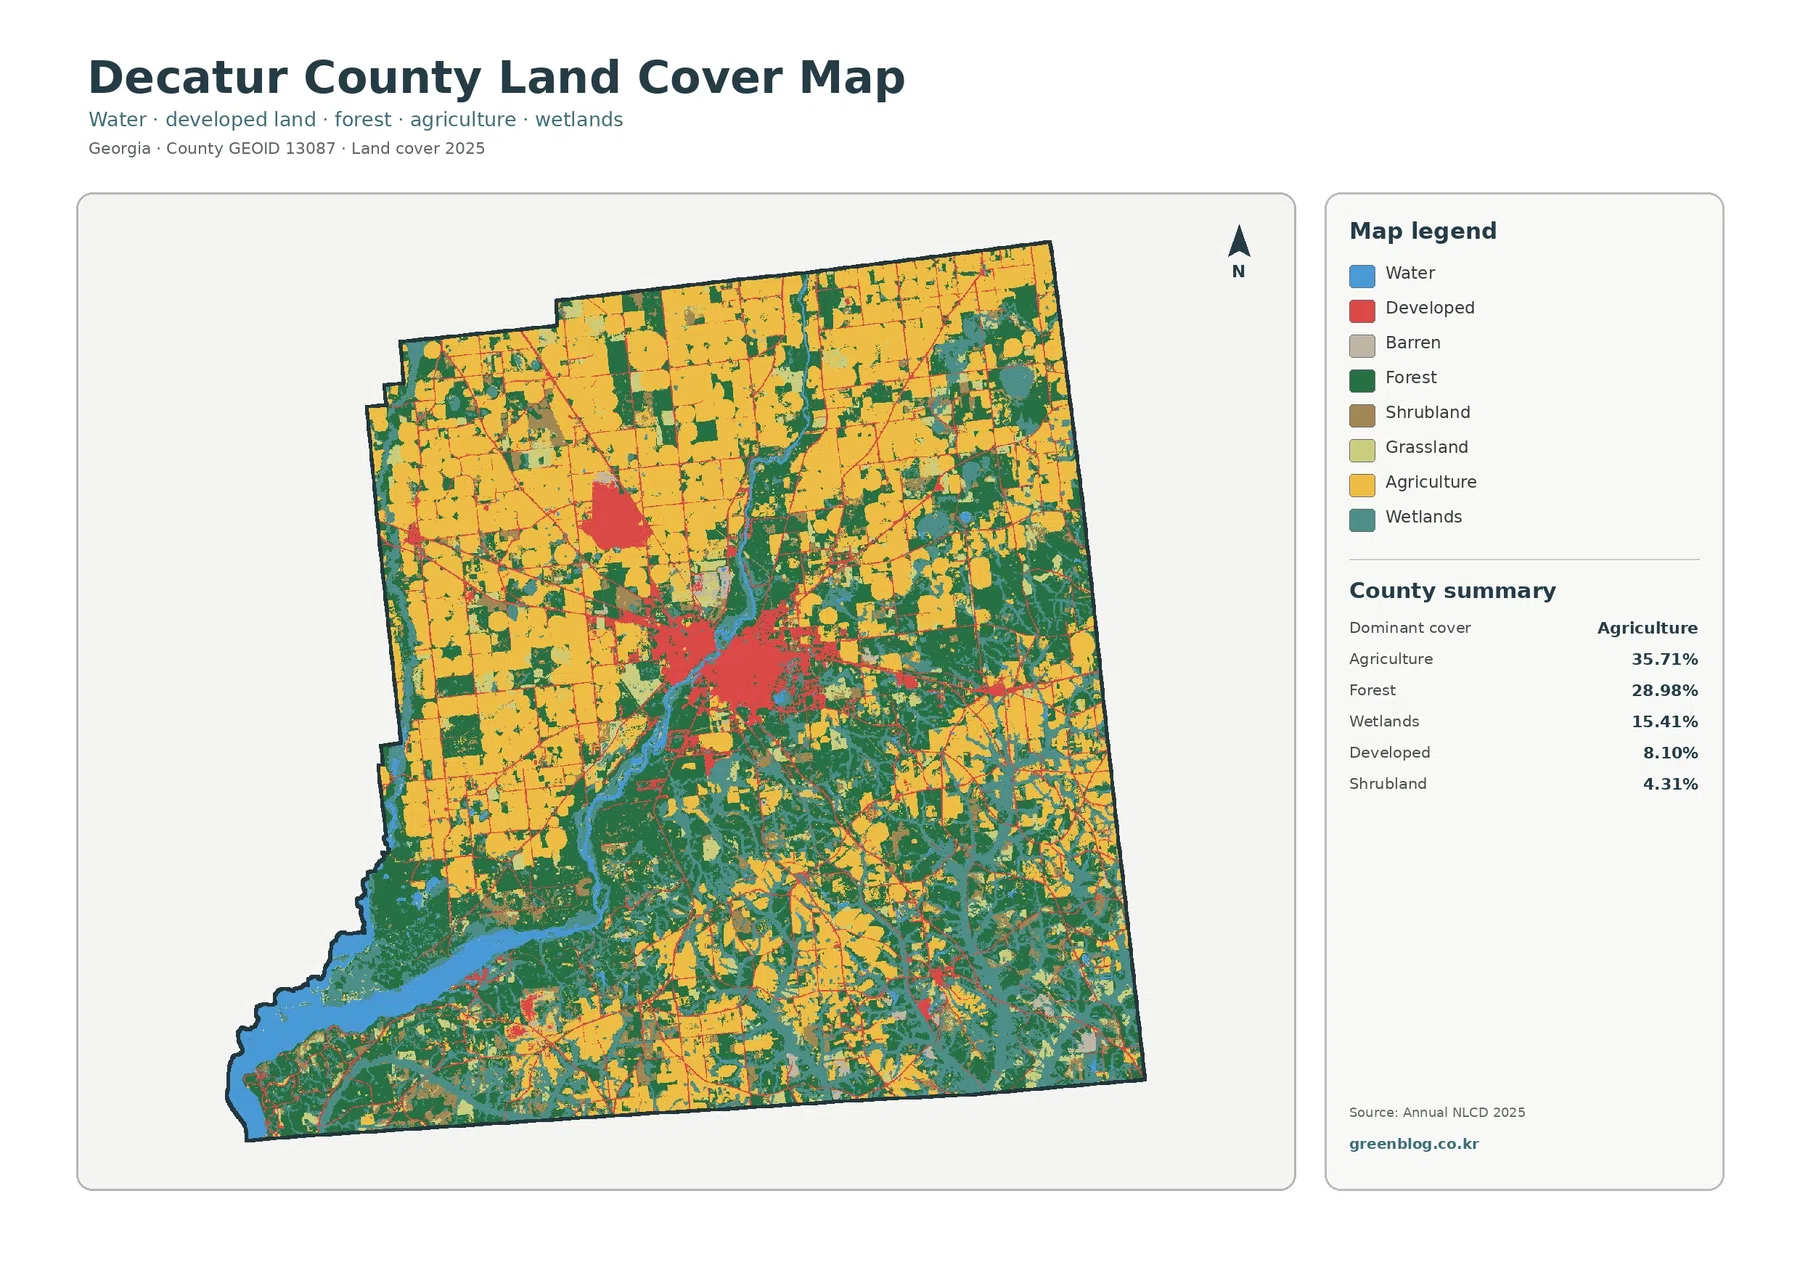
Agriculture covers 35.71% of Decatur County and is especially conspicuous across the upper half of the map. Broad yellow blocks repeat across the north and northwest, separated by smaller areas of forest, wetland, and developed land. Forest is the second-largest class at 28.98%. Its distribution is less blocky and becomes much more extensive through the center, east, and southern part of the county.
Wetlands account for 15.41%, a substantial share that helps distinguish Decatur County from a simple farm-and-town pattern. Teal wetland cells follow low, water-influenced areas and are particularly common near the central river corridor and across parts of the south. The countywide view also includes developed land at 8.10% and shrubland at 4.31%. These classes are important, but neither approaches the area covered by farming and forest.
The principal developed cluster lies near the middle of the county and corresponds closely with the Bainbridge area. Smaller developed patches and narrow lines extend away from that core, while much of the surrounding county remains agricultural or forested. The map does not draw city limits, road names, zoning districts, or parcel boundaries, so the red footprint should not be treated as the legal boundary of Bainbridge or any other municipality.
Water is easy to follow because a blue corridor runs through the middle of the county and expands toward the southwest. Decatur County’s emergency management page links to a Flint River stream gauge at Bainbridge, and the county resources page separately points residents to Lake Seminole level information. Those official references provide useful local context for the mapped river-and-reservoir pattern, but the land-cover image itself is still a generalized raster rather than a detailed hydrologic survey.
The Bainbridge core stands out more clearly on the impervious surface view
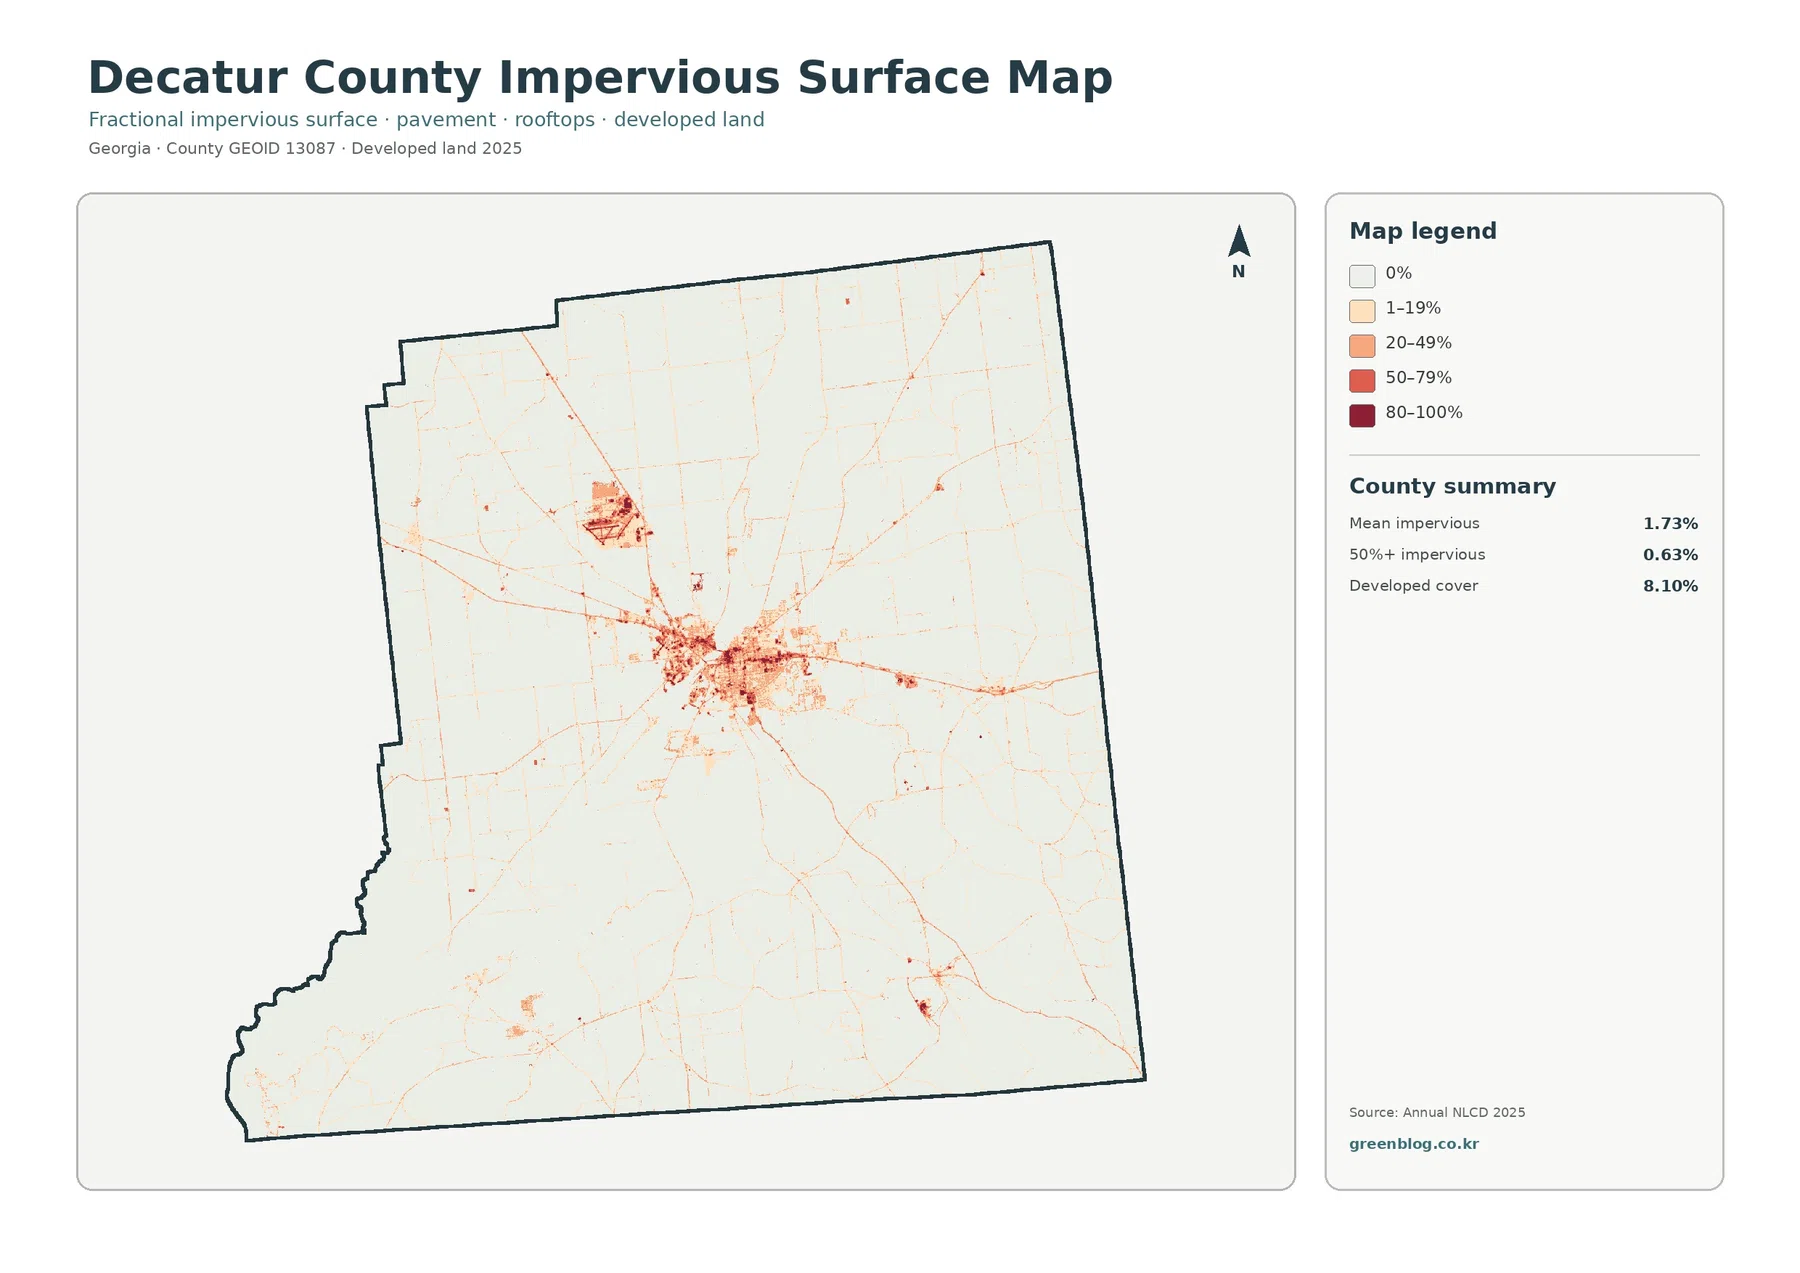
Impervious surface means pavement, roofs, parking areas, and other materials that shed water instead of allowing it to soak readily into the ground. Decatur County has a mean impervious value of 1.73%, and only 0.63% of the county falls in the 50% or greater impervious category. Those numbers are much smaller than the 8.10% developed-cover figure because developed classes can contain lawns, trees, bare soil, and other permeable surfaces around buildings and roads.
Most of the county is very light on this map, which reflects the large agricultural, forested, and wetland areas outside the main settlements. The Bainbridge area is the clear exception. Orange and dark red cells are concentrated around the central urban footprint, and narrow traces extend outward along transportation routes. A separate concentrated patch appears farther northwest of the main core, while scattered small high-value cells occur elsewhere.
This pattern is useful when the question is not simply “where is land developed?” but “where are hard surfaces concentrated?” Two places may both be classified as developed while having very different proportions of roofs and pavement. A low-density residential area with yards can remain relatively light, whereas a commercial block, industrial site, or major road surface can appear much darker. The impervious view therefore adds information that the general land-cover map cannot provide by itself.
Impervious cover is often relevant to stormwater discussions, but this map should not be used to determine drainage capacity or flood risk at a specific property. Topography, soils, ditches, culverts, river levels, and engineered drainage all matter. Decatur County directs flood-preparedness questions to its emergency management services and links to current Flint River data, which are more appropriate sources when present conditions or public safety are the concern.
Farm blocks dominate the north while forest and wetlands expand southward
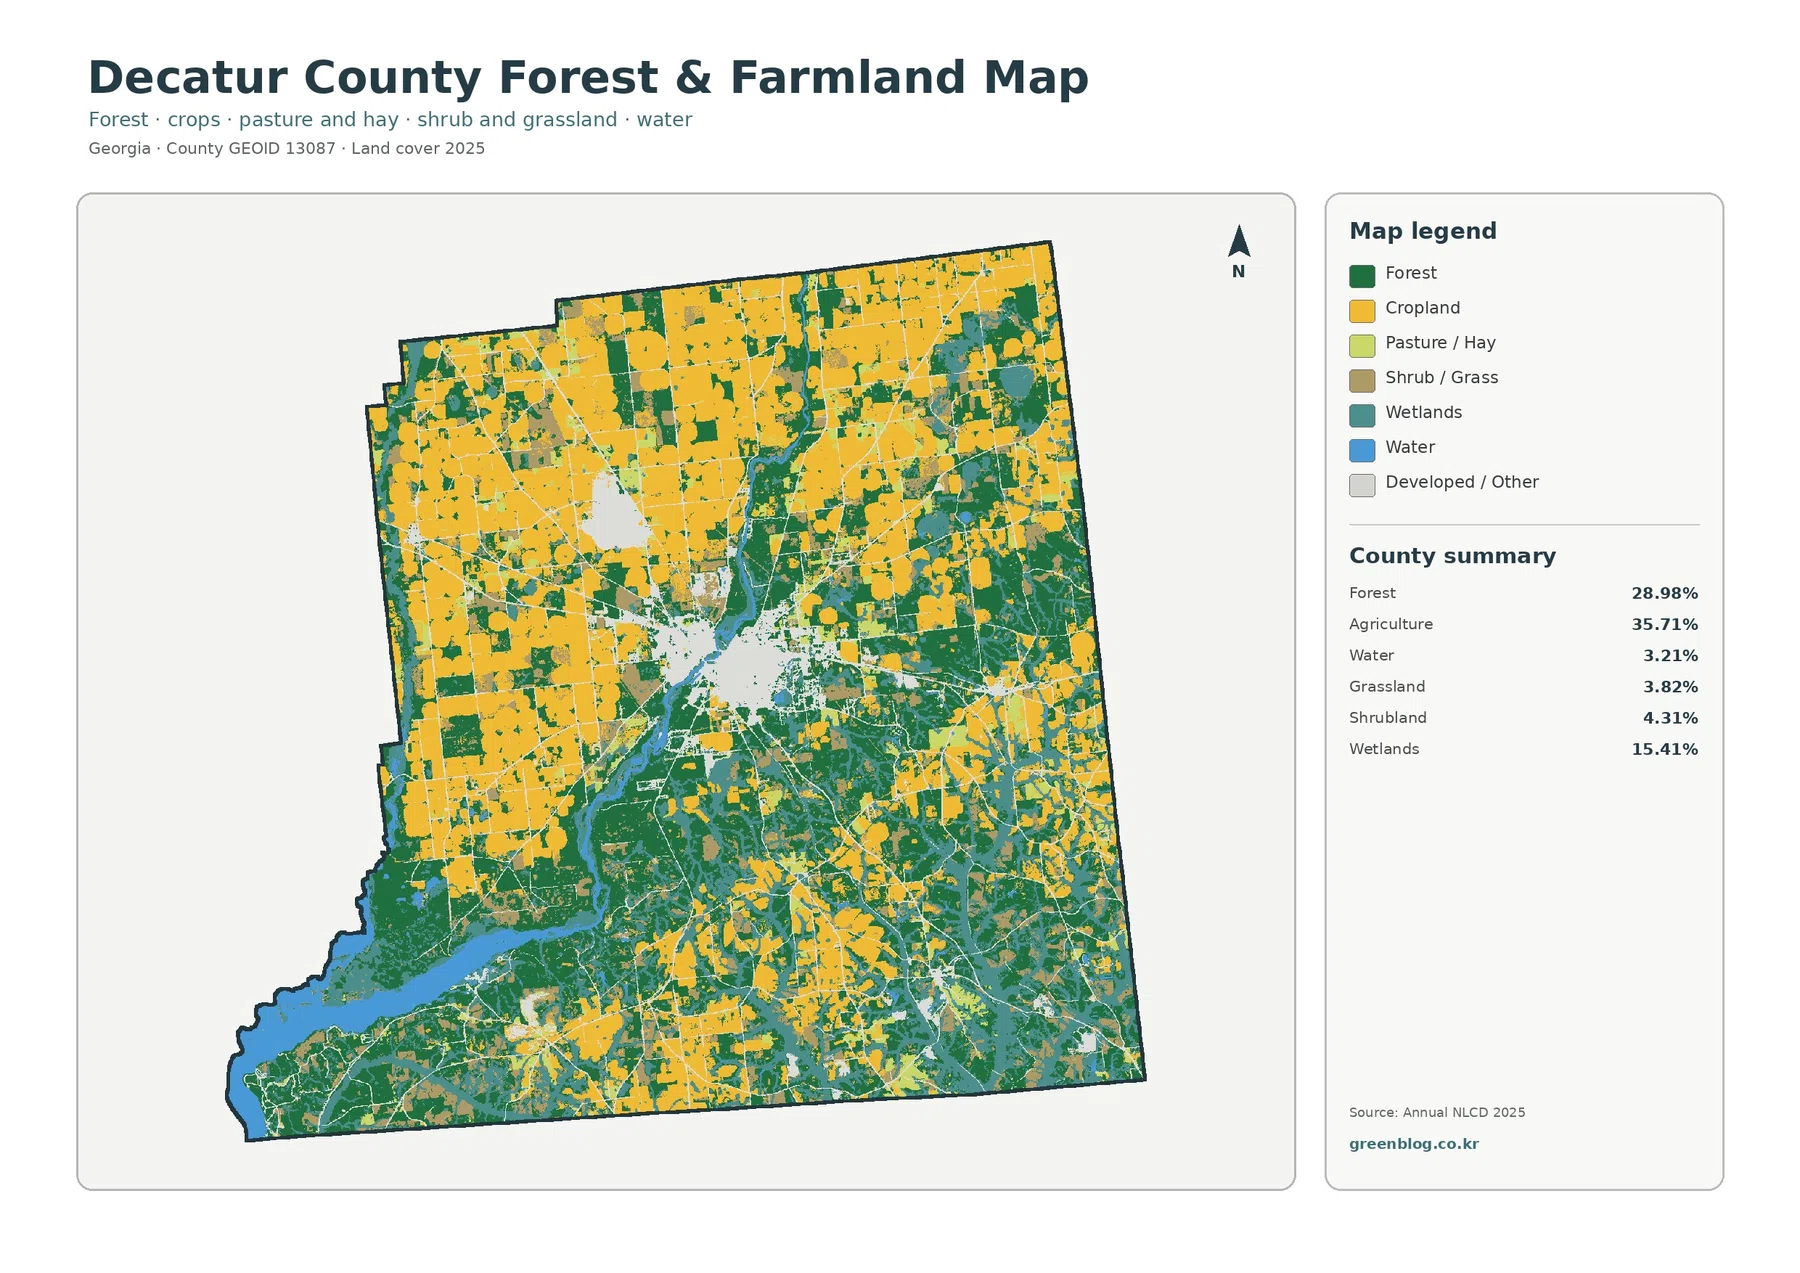
Removing most of the detailed developed classes makes the agricultural structure easier to see. Agriculture remains 35.71% and forest 28.98%, while wetlands occupy 15.41%. Shrubland accounts for 4.31%, grassland for 3.82%, and water for 3.21%. The north and northwest contain many large, regular farm blocks, whereas the central and southern portions contain a more intricate mixture of forest, wet ground, water, and smaller agricultural areas.
That pattern fits the county’s strong agricultural context. The University of Georgia Cooperative Extension office in Decatur County provides research-based production-crop advice, soil and water testing, and other agriculture and natural-resources services. Its Agriculture & Natural Resources page also directs users to field-crop, farm-management, and production resources. The map supports a broad discussion of farmland distribution, but it does not identify which crop is growing in a particular field.
The southern half deserves separate attention because farmland is much less continuous there. Forest and wetland cells join around the river system and the broad water area in the southwest, while agricultural patches break into smaller pieces. This does not mean every green or teal cell has the same ecological condition. A 30-meter classification cell records a dominant surface, and narrow streams, field edges, trees, wet soil, and roads can be mixed inside the same cell.
For teaching or presentation work, this view is useful when the full land-cover legend feels too busy. It can show the difference between the farm-heavy upper county and the more forested, wetter lower county without asking the viewer to interpret every developed subtype. It also makes the 3.21% open-water value easier to place next to the much larger 15.41% wetland share.
The 1985–2025 comparison is led by forest-loss classification, not new development
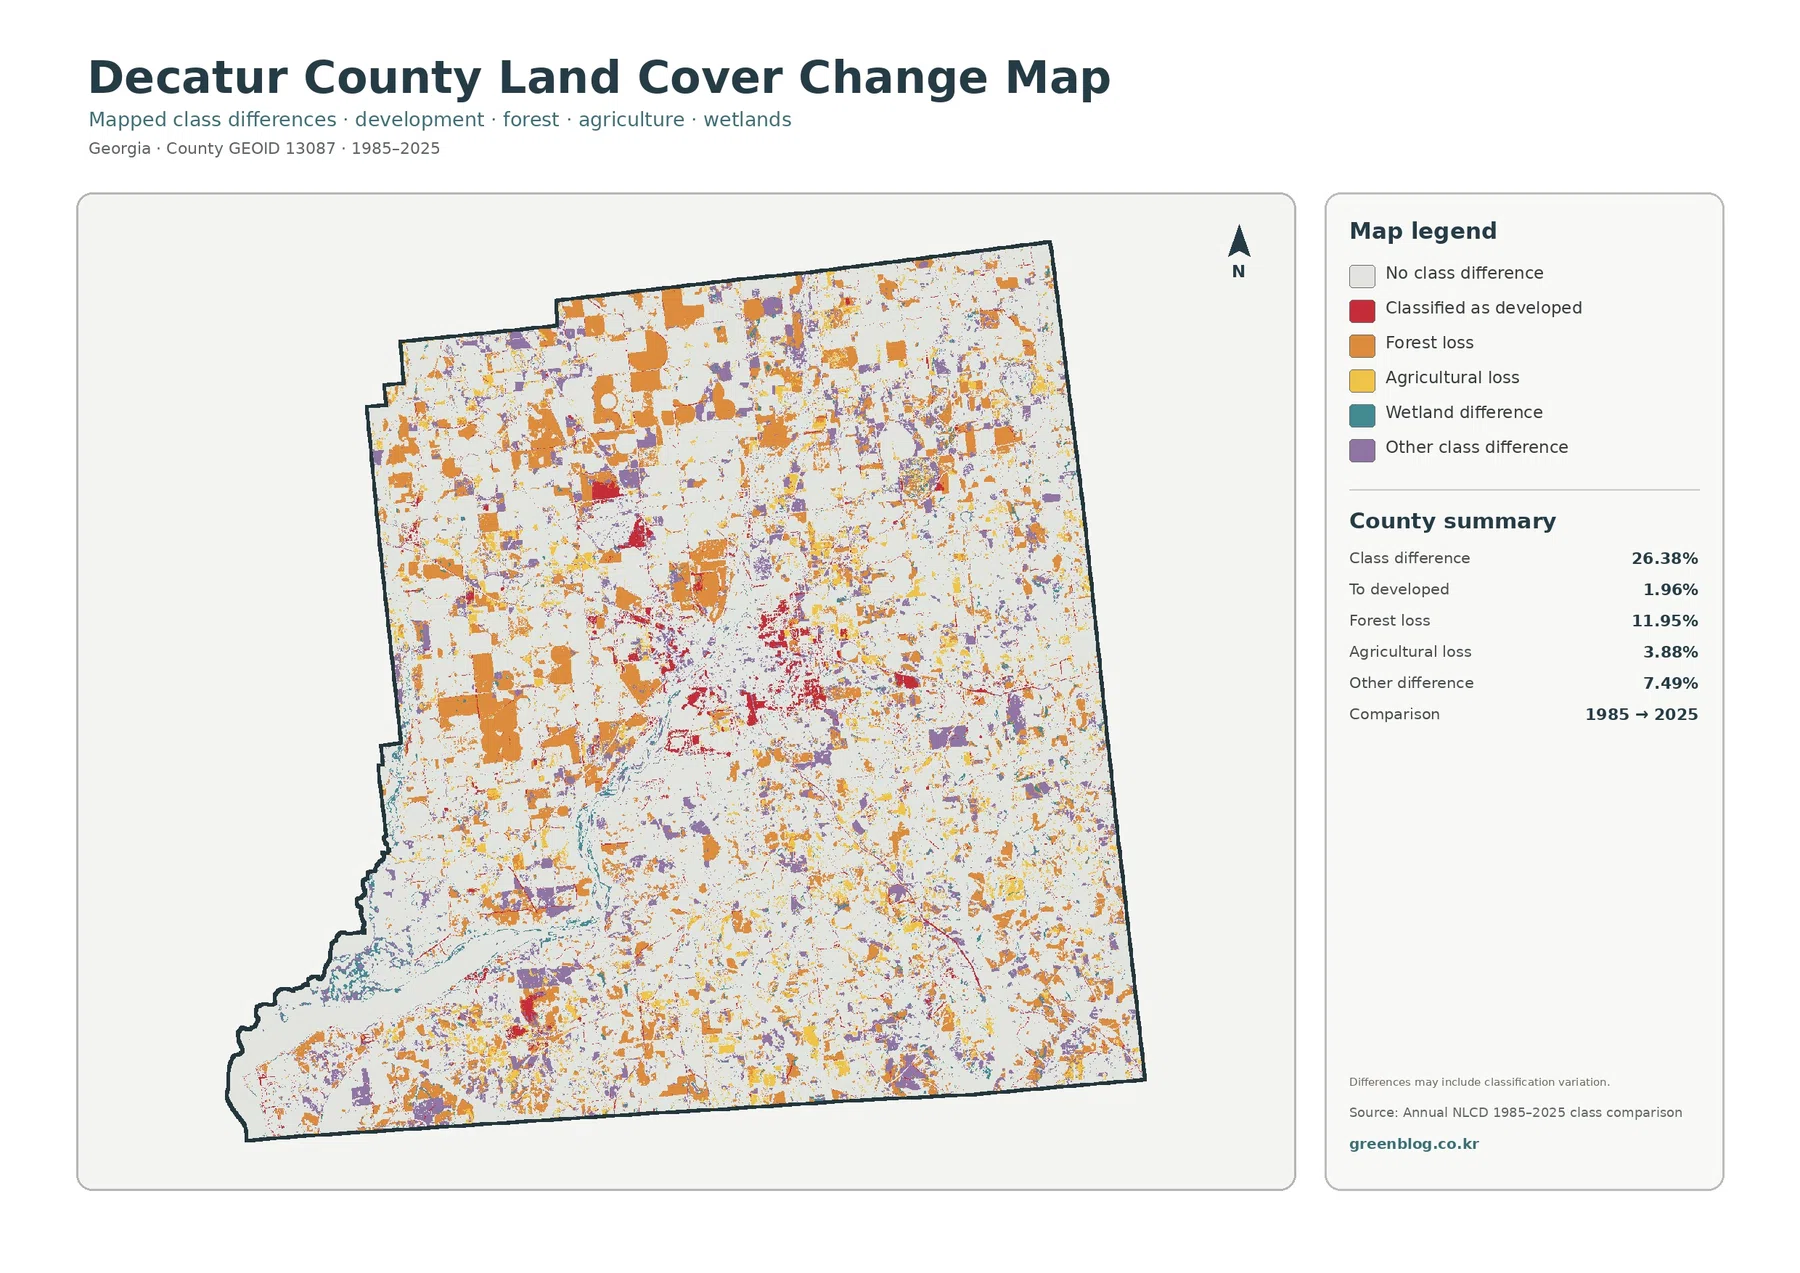
The endpoint comparison shows class differences across 26.38% of the county. Forest loss is the largest named component at 11.95%. Other class differences account for 7.49%, agricultural loss for 3.88%, and cells classified as developed at the 2025 endpoint after another class in 1985 account for 1.96%. The remaining mapped change categories should be read from the legend rather than estimated from the summary.
Orange forest-loss cells are scattered widely and are especially noticeable across parts of the farm-heavy north and west. Red cells classified as developed are more concentrated around Bainbridge and other smaller developed locations. That distinction matters. The countywide class-difference value is not a measurement of urban growth, and even the forest-loss class should not automatically be described as permanent clearing.
A cell can change class because the surface truly changed, but forestry cycles, harvest and regrowth, agricultural conversion, wet conditions, imagery differences, and classification uncertainty can also affect an endpoint comparison. The map itself warns that mapped differences may include classification variation. A specific orange or purple patch therefore needs intermediate-year imagery, aerial photographs, or local records before anyone assigns a cause.
The comparison also says nothing about the exact year of change. It connects 1985 and 2025 rather than documenting every year between them. Its strength is screening: it quickly separates areas that retained the same class from places where the two endpoints differ. Researchers or students can use it to choose locations for a deeper time-series review instead of treating it as a complete forty-year history.
Why the river and wetland pattern matters when reading the county map
Open water covers 3.21% of Decatur County, but that relatively modest percentage has a strong visual presence because the river corridor forms a long connected feature. It passes close to the main Bainbridge development and continues toward the large southwestern water body. Wetlands cover nearly five times as much area as open water, so teal wetland cells spread well beyond the visible blue channels and reservoir surface.
This distinction is useful for general environmental education. Open water is meant to represent exposed water surfaces, while wetland classes can include vegetation and ground strongly influenced by water. A viewer who looks only at the blue portions may underestimate how much of the county’s land-cover pattern is related to wet conditions. Reading blue water together with teal wetlands and surrounding forest provides a better countywide picture.
The county’s official resources reinforce the practical importance of this water system. Decatur County’s website directs users to Lake Seminole level reports, and its emergency management page highlights a Flint River stream gauge at Bainbridge. Those links are better sources for current water conditions. The land-cover maps are useful for showing where water and wet ground sit relative to farming, forest, and developed areas at the supplied observation dates.
Choosing the right map for a report, lesson, or county profile
The general 2025 land-cover image is the best starting point when the audience needs the full county pattern in one view. It shows the agricultural north, the forest-and-wetland mixture farther south, the Bainbridge development core, and the river system at the same time. For a simpler agriculture-versus-natural-cover discussion, the forest and farmland version removes much of the visual competition from developed classes.
The impervious surface map is more useful when roads, roofs, parking areas, or the concentration of hard surfaces matters. It makes the difference between 8.10% developed cover and 1.73% mean impervious cover easy to explain. The change map serves a different purpose: it identifies where the 1985 and 2025 classes disagree and separates several change categories instead of describing the current surface alone.
Using two views side by side often works better than trying to make one map answer every question. A county profile can pair the general map with the forest-and-farmland view. A development discussion can pair the general map with impervious cover. A long-term comparison can start with the change map and then return to the 2025 map to see what class occupies the same area now.
Each original JPG measures 2480 × 1754 pixels. That is useful for webpages, standard documents, classroom handouts, and many presentation layouts, but the package does not mark the files as meeting an A3 high-resolution reference. Test the intended print size before using them for a large poster. Upscaling the image can make the file larger, but it cannot create new land-cover detail that was absent from the original raster.
What the maps can show—and what they cannot
Land cover is not zoning, ownership, a parcel survey, or a statement about whether land may be developed. It classifies what appears to cover the ground at the observation date. A yellow agricultural cell is not proof of an agricultural zoning designation, and a green forest cell is not automatically a protected tract. Decatur County’s Building and Planning materials should be consulted for planning rules and development regulations.
Annual NLCD uses 30-meter cells, so each square summarizes a fairly large piece of ground. A farm edge may contain crop rows, trees, a ditch, a driveway, and a building, yet the mapped result must simplify that mixture. Zooming in enlarges the cell but does not reveal parcel boundaries or building outlines. Higher-resolution imagery and current local GIS data are needed for site-specific questions.
The year matters as well. The 2025 maps describe the supplied observation year; construction, harvest, vegetation recovery, flooding, or other changes after that date may not appear. The 1985–2025 image is an endpoint comparison rather than an annual chronology. For a decision that depends on current conditions, use these maps as background and confirm the site with newer imagery, local records, and field information when appropriate.
Frequently Asked Questions
Is Decatur County mostly farmland?
Agriculture is the largest single 2025 class at 35.71%, but it does not cover a majority of the county. Forest accounts for 28.98% and wetlands for 15.41%, with the strongest farm blocks concentrated in the north and northwest and more forested, wetter cover toward the center and south.
Why is developed cover 8.10% while mean impervious cover is only 1.73%?
Developed classes can include permeable surfaces such as lawns, trees, and bare ground around buildings and roads. Impervious cover isolates harder surfaces such as pavement, roofs, and parking areas, so the countywide mean is much lower even though both measures highlight the Bainbridge area.
Does the 26.38% class-difference value mean that much land was developed after 1985?
No. Only 1.96% is summarized as cells classified as developed at the 2025 endpoint after another 1985 class. Forest loss is 11.95%, agricultural loss is 3.88%, and other class differences are 7.49%. The comparison may also include classification variation, so a site-specific cause requires additional evidence.
Sources and Reference Data
- MRLC Annual NLCD Data – official access to Annual NLCD land-cover and comparison products
- USGS Annual NLCD Land Cover Classification – definitions and guidance for forest, agriculture, wetlands, developed land, and related classes
- U.S. Census Bureau TIGER/Line Shapefiles – official geographic reference for the Decatur County boundary
- Decatur County, Georgia – official county information for southwest Georgia and Bainbridge-based county services
- UGA Extension – Decatur County Agriculture & Natural Resources – local production-crop, agriculture, soil, water, and natural-resource information
- Bainbridge-Decatur County Building and Planning – official planning, development, permitting, and land-regulation information
Map File Information
The ZIP contains four original JPG maps for comparing Decatur County agriculture, forest, wetlands, Bainbridge-area hard surfaces, the Flint River corridor, and 1985–2025 class differences.
- Included Files: Use only the versions confirmed in the article and supplied images
- File Type: Use the confirmed download contents
- Intended Use: Printing, education, presentations, and map-based projects
Related Maps
- Appling County Georgia Land Cover Map
- Atkinson County Georgia Land Cover Map
- Bacon County Georgia Land Cover Map
Green Map creates custom-edited map images using open geographic data sources such as geoBoundaries, Natural Earth, OpenStreetMap, and government open data.
These maps are edited visual materials, not raw data files, and are provided for education, documents, presentations, and graphic reference.