Chatham County is one of the clearest coastal contrasts in the supplied Georgia map set. Wetlands cover 43.70% of the county in the 2025 summary, while developed land accounts for 28.55% and open water for 14.44%. This Chatham County Georgia Land Cover Map makes the divide easy to see: a broad urbanized area occupies much of the northwest and interior, while wetlands, tidal waterways, and island landscapes dominate the east and south.
Four map views are included on this page: 2025 land cover, forest and farmland, impervious surface, and a 1985–2025 class-difference comparison. The WebP versions are placed beside the discussion, and the four original 2480 × 1754-pixel JPG maps are available together in one ZIP. They work well when a county profile needs both the Savannah-area urban pattern and the coastal wetland setting in the same set of graphics.
Table of Contents
A county where wetlands, water, and developed land all matter
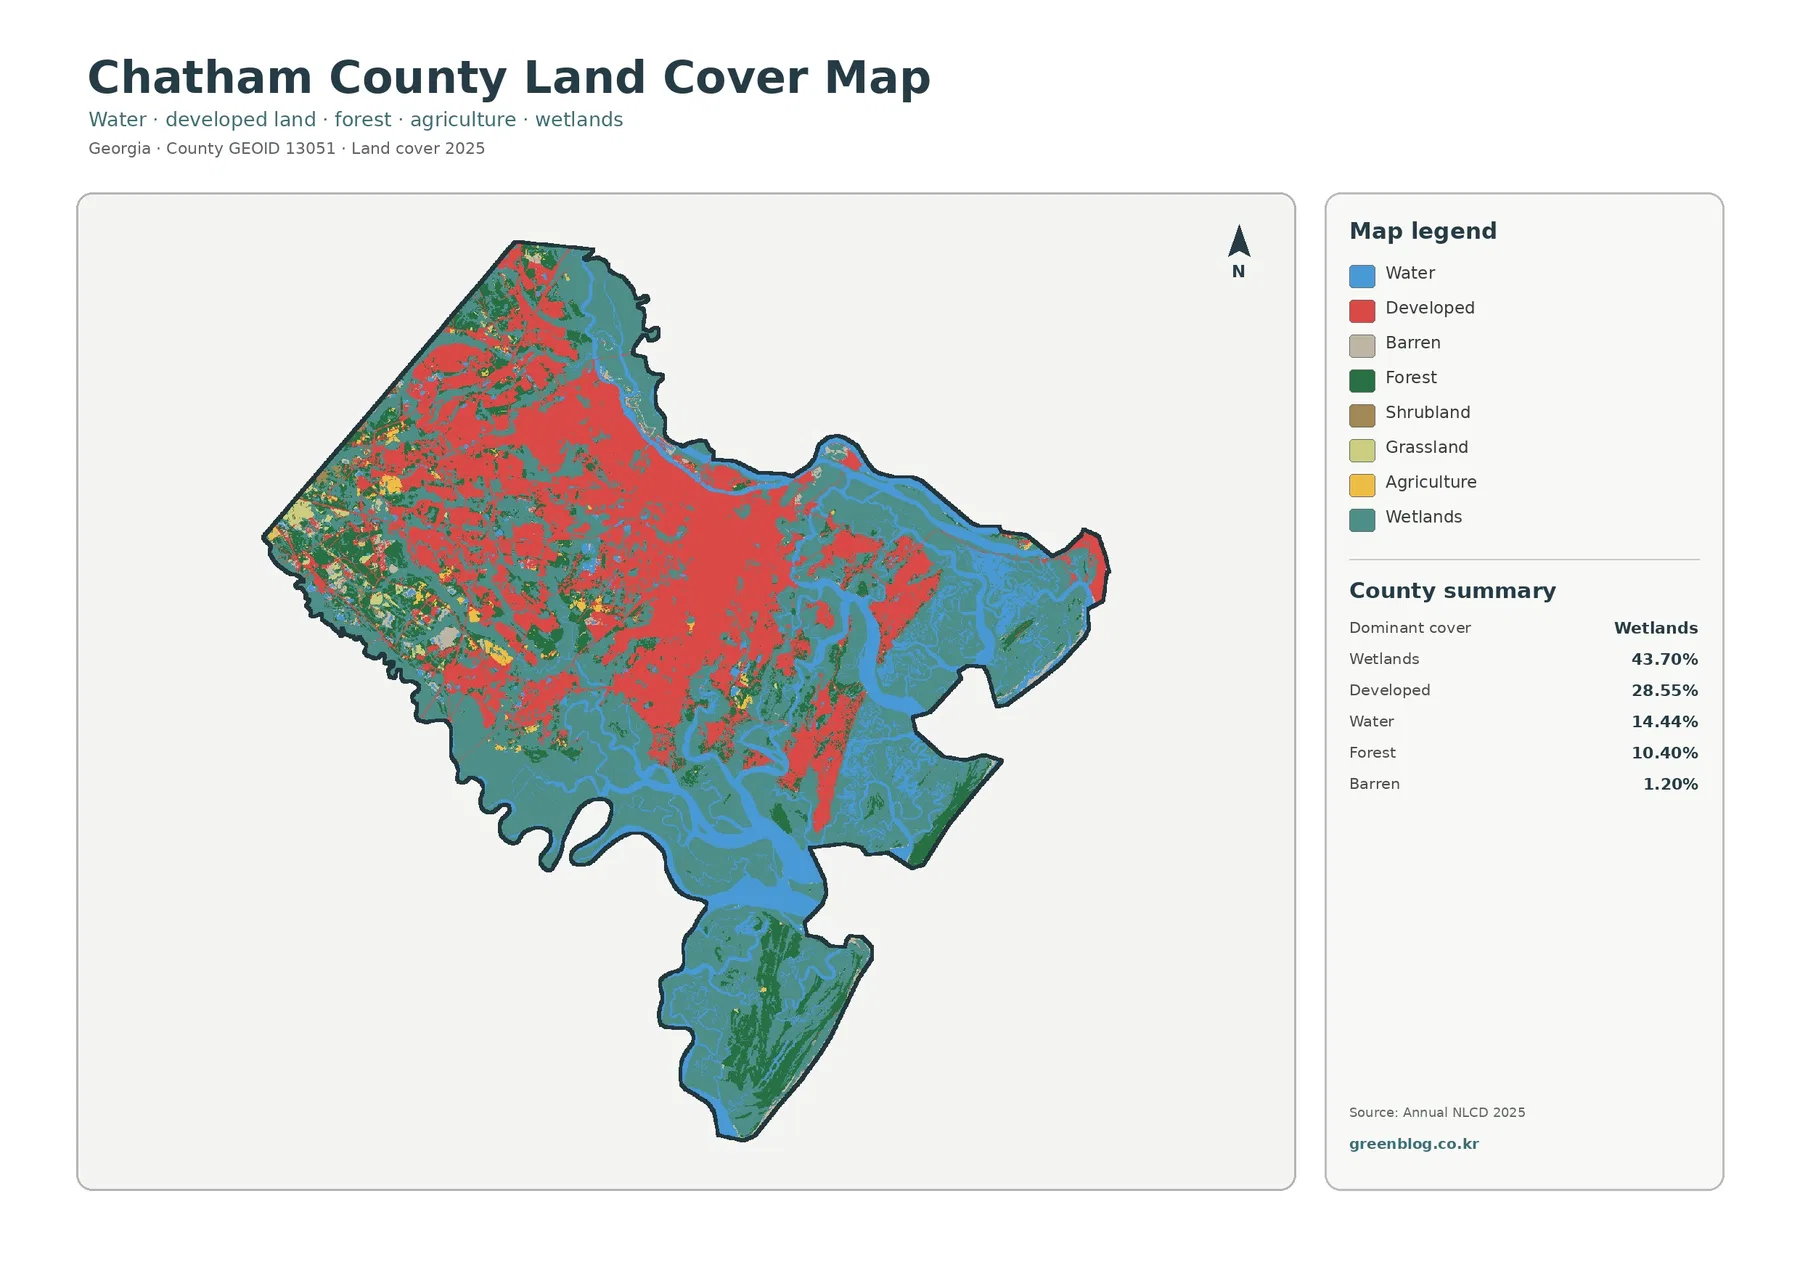
The countywide image is not dominated by one uniform landscape. Teal wetlands occupy large eastern and southern areas, and blue water threads through those zones in broad channels and smaller branches. Red developed land forms an extensive block across the northwest and pushes into the center. Darker green forest appears between these larger classes, especially along the inland edges and in portions of the south. The result is a map in which coastal natural surfaces and a substantial metropolitan footprint sit very close to one another.
The summary values give that visual contrast useful scale. Wetlands are the largest class at 43.70%, developed land follows at 28.55%, open water covers 14.44%, and forest accounts for 10.40%. Barren land is 1.20%, while the remaining classes are comparatively small. Those numbers also explain why the county should not be described only as an urban area or only as a coastal marsh landscape. Both are major parts of the 2025 classification.
Wetlands and water should remain separate in any caption or report. Open water represents exposed water surfaces such as rivers, channels, and other water bodies, while wetland classes include vegetated or saturated ground influenced by water. Chatham County’s official Floodplain Management Plan describes estuarine and marine wetlands along the coast and wetlands associated with creeks across the county. That local description is consistent with the broad wetland-and-water network visible on the supplied map.
The same official material also makes clear why a land-cover map should not be treated as a regulatory wetland map. Annual NLCD classifies the surface appearance of raster cells. It does not establish jurisdictional wetland boundaries, property ownership, zoning, building rights, or parcel lines. A teal cell is useful for regional interpretation, but a site-specific permit or property decision requires the appropriate local, state, or federal record.
Forest and farmland are secondary, but their locations still tell a story
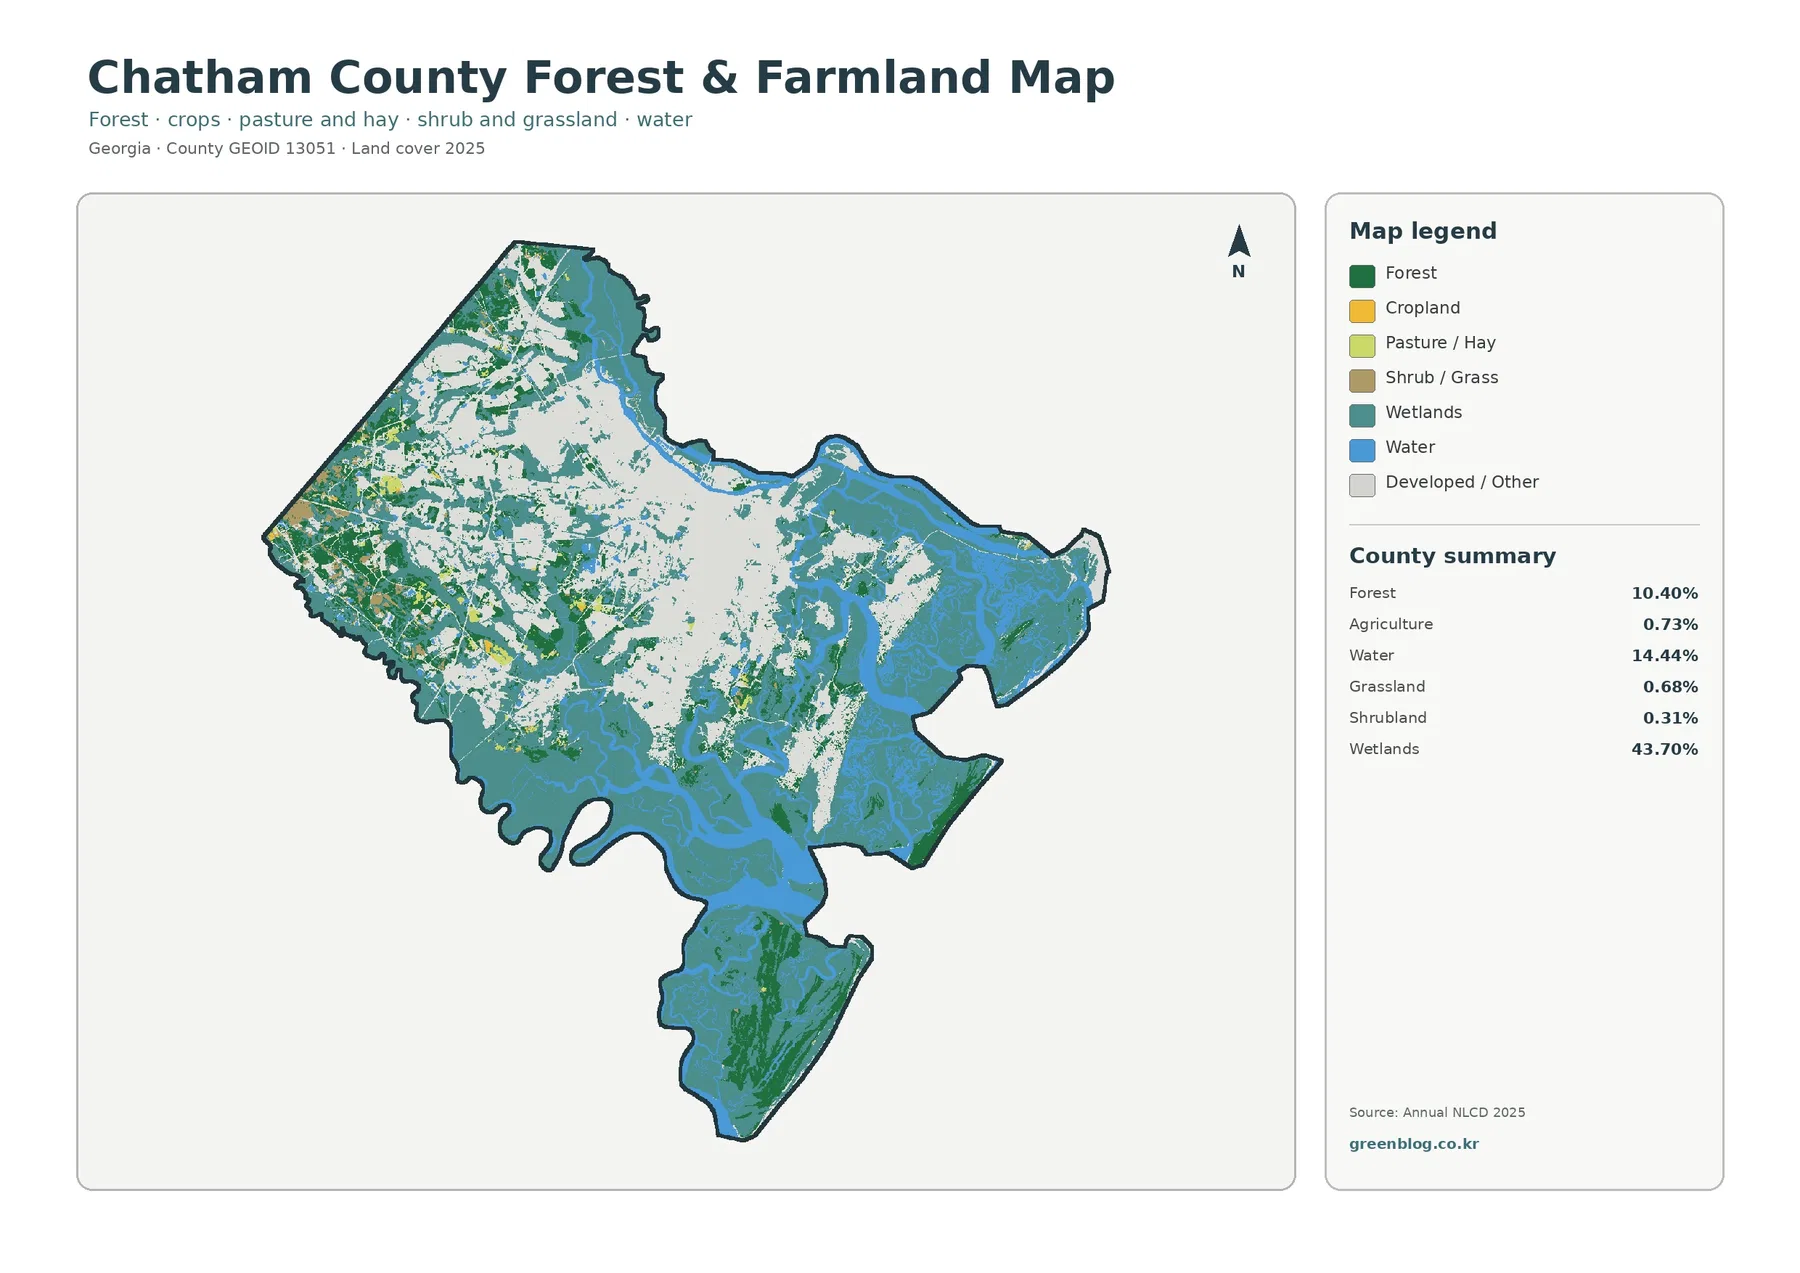
The forest-and-farmland view changes the emphasis. Instead of giving developed land its own strong color, it leaves developed and other surfaces pale so that forest, agriculture, wetlands, and water stand out. Forest covers 10.40% of the county, but agriculture is only 0.73%. Grassland is 0.68% and shrubland 0.31%. These values fit the image: farm colors appear in small scattered patches rather than in the broad field systems seen in many inland Georgia counties.
Forest is more persistent than farmland. Green areas remain along the western and southwestern side of the county, around the edges of developed land, and in portions of the coastal and southern landscape. The forest is fragmented in places, especially where the metropolitan area expands across the northwest. Farther from the largest developed block, green forest often meets wetland directly, which is a useful detail when the goal is to explain how upland and wet environments alternate across the county.
The long southern portion of the county is especially useful for comparison because it contains far less of the pale developed-or-other background than the urbanized northwest. Wetlands, water, and forest occupy much of that area. The eastern side also contains broad wetland and water zones with smaller forest patches. These patterns make the map useful for environmental education: students can compare a dense urban county center with coastal natural cover without changing county boundaries or map scale.
Agriculture deserves careful wording because 0.73% is a small share. Yellow cropland and related agricultural cells appear mostly as limited pockets in the western part of the county rather than as a defining countywide cover. A profile that calls Chatham an agricultural county would therefore overstate what the supplied 2025 map shows. It is more accurate to say that agriculture is present but minor beside wetlands, developed land, water, and forest.
The 1985–2025 comparison puts development change in context
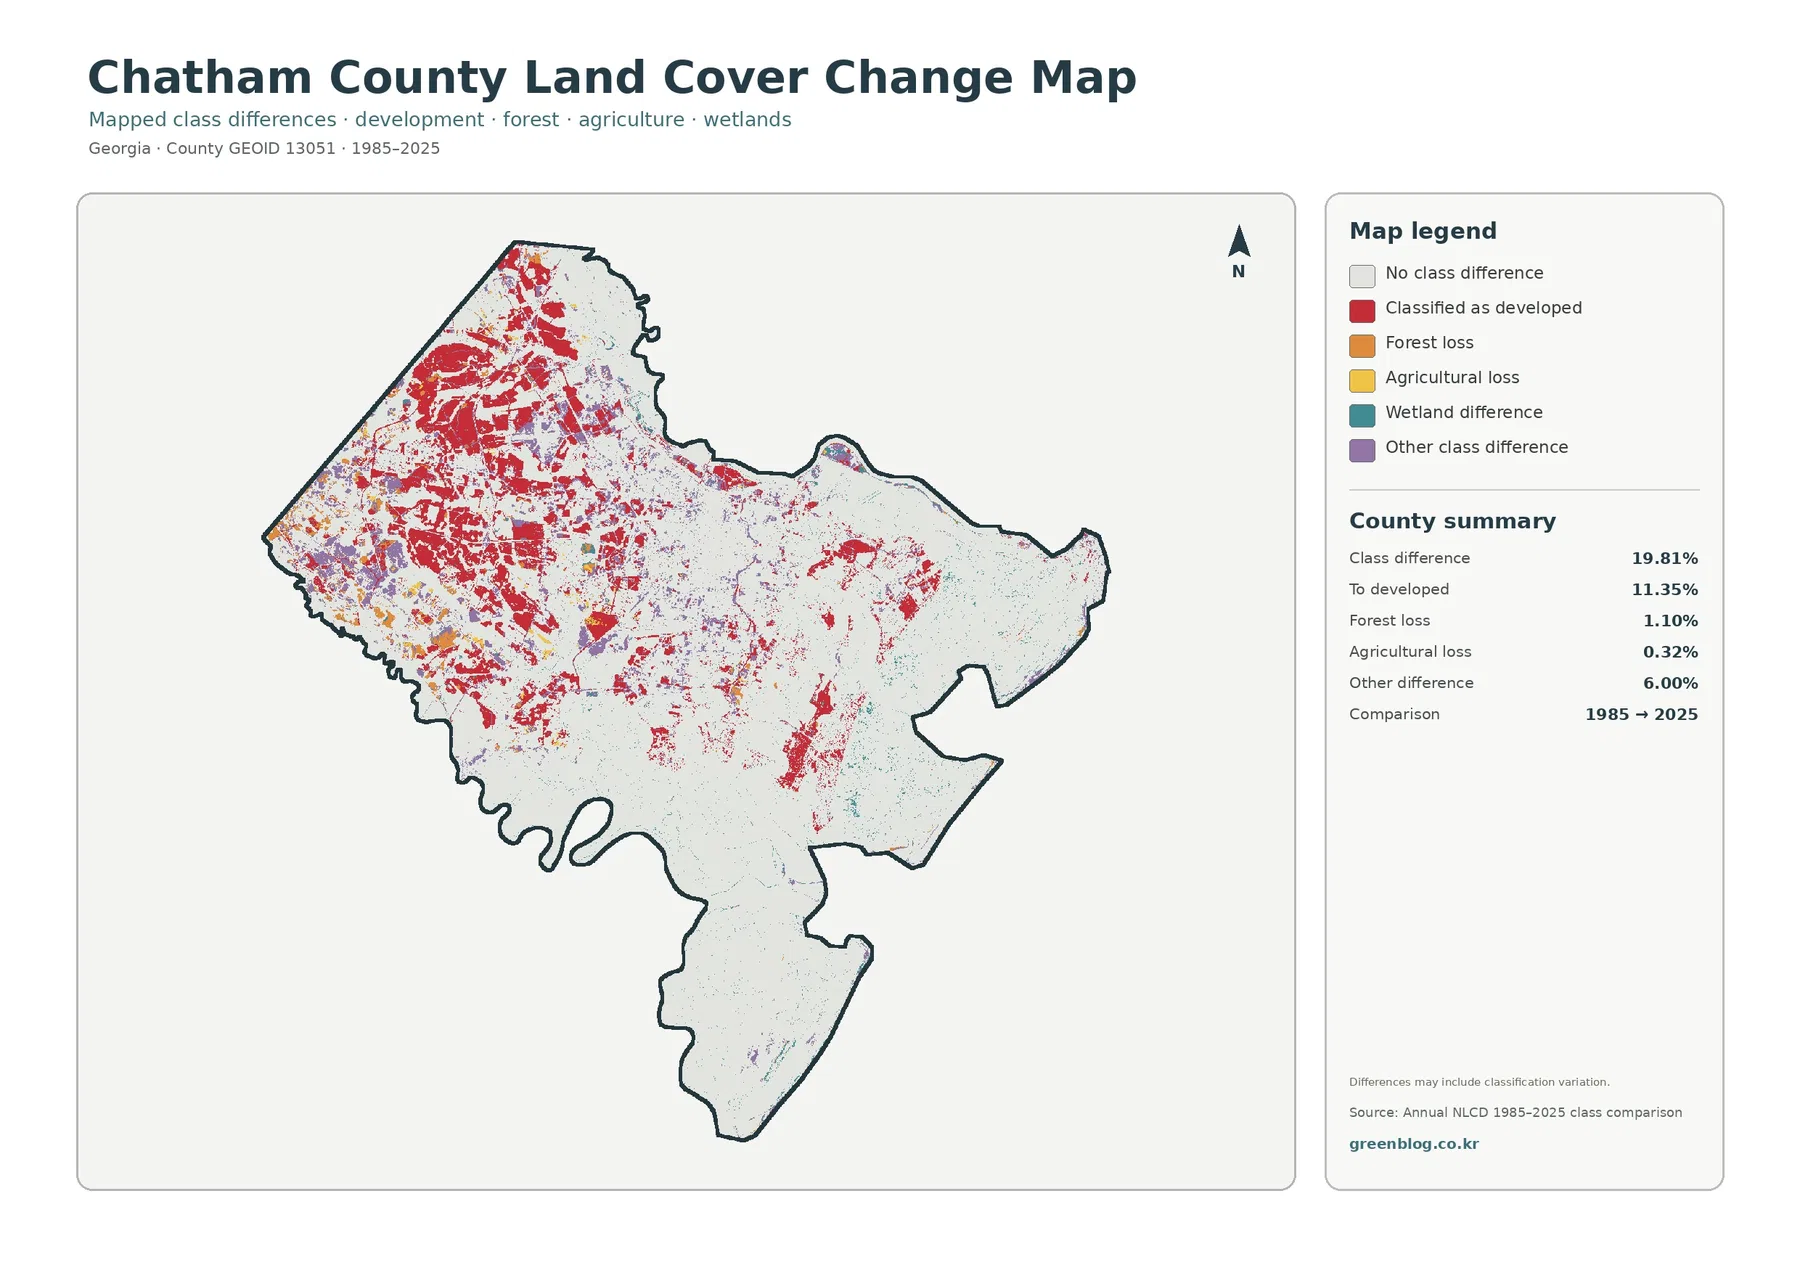
The change map compares two endpoints rather than showing a continuous forty-year timeline. Across Chatham County, 19.81% of cells have a class difference between 1985 and 2025. The largest named component is the 11.35% classified as developed at the 2025 endpoint after another class at the earlier endpoint. Red change cells are concentrated in the northwest and west-central parts of the county, with additional clusters and corridors extending through the developed interior.
That pattern broadly matches the current developed footprint, but it should not be used to assign a construction year to individual neighborhoods. A cell marked “classified as developed” only tells the reader that its endpoint classes differ in that direction. It does not say when a building, road, parking lot, or subdivision appeared. Intermediate Annual NLCD years, historical aerial photography, and local records are needed if the timing of development matters.
Forest loss accounts for 1.10% of the county in this endpoint comparison, while agricultural loss is 0.32% and other class differences total 6.00%. Those values should not be added casually to produce a single story of environmental decline. A class difference can represent a real surface change, but some differences can also reflect mixed pixels, classification boundaries, changing vegetation conditions, or the way a cell is assigned to its predominant class.
Large pale areas on the map indicate no class difference between the two endpoints. Much of the eastern coastal landscape and the long southern section contain fewer red developed-change cells than the northwest. “No class difference” does not mean that nothing happened there for forty years. It only means the dominant mapped class at the start and end of the comparison remained the same, so smaller within-class changes and temporary changes between those dates may not appear.
Impervious surface reveals the strength of the urban core
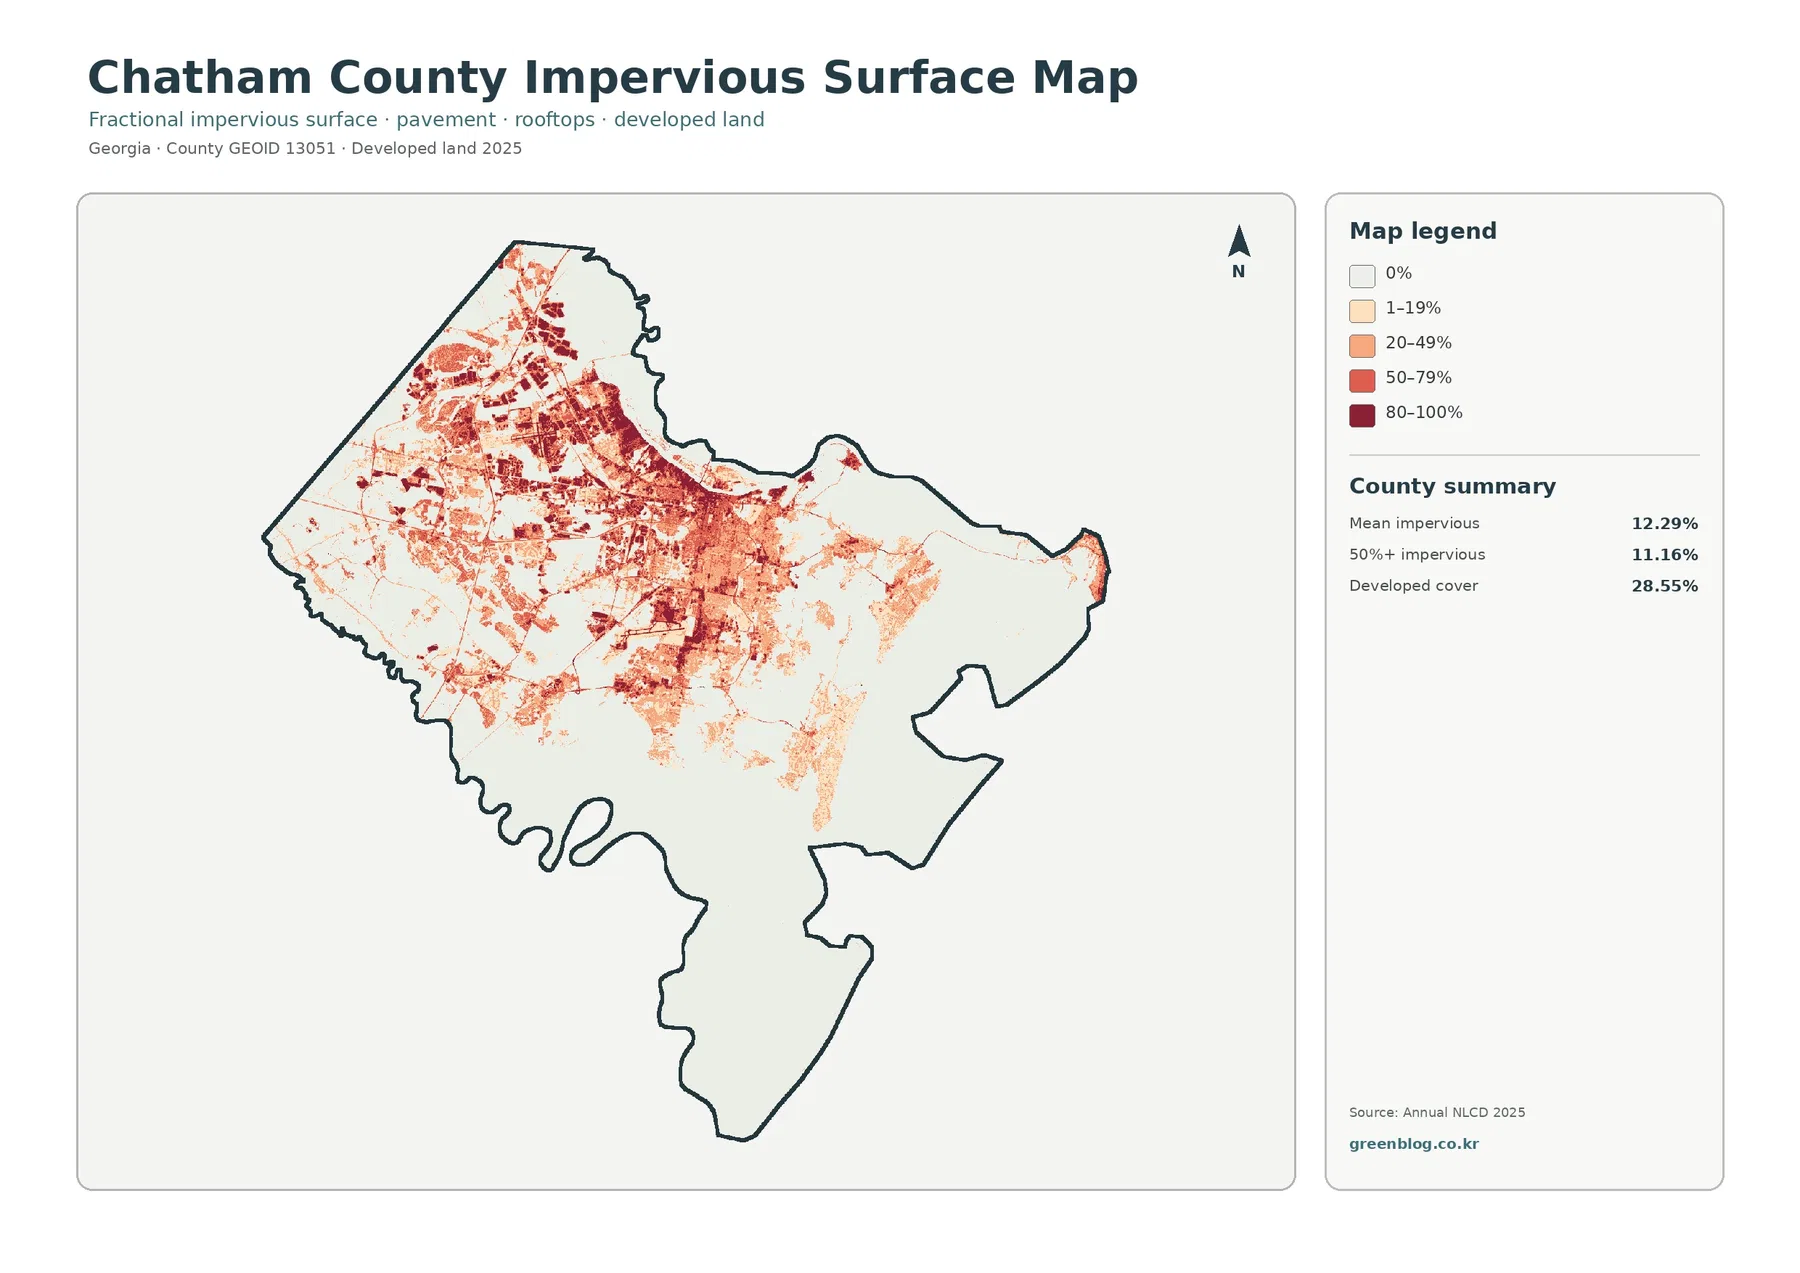
The impervious-surface map is the best of the four views for separating heavily built surfaces from the broader developed category. Dark reds mark cells where roofs, pavement, parking areas, and similar hard materials make up a large share of the ground. Those colors cluster across the northwest and north-central urban area, with branching linear features and additional developed pockets extending outward. Much of the eastern and southern wetland landscape stays very light.
The countywide mean impervious value is 12.29%. Cells with at least 50% impervious cover account for 11.16%, while developed land as a land-cover category covers 28.55%. The gap between those values is expected. Developed classes can include lawns, trees, bare soil, landscaped ground, and other permeable surfaces around roads and buildings. Impervious cover isolates the harder surfaces within that broader developed footprint.
This distinction is especially useful in the Savannah metropolitan area. A general land-cover map can identify the broad red developed zone, but the impervious map shows where hard surfaces are densest inside it. Chatham County–Savannah Metropolitan Planning Commission materials address growth, transportation, land use, and natural resources across Chatham County and Savannah. When those planning topics are being discussed, the impervious map provides a useful visual reference for the existing surface pattern without pretending to be a zoning or transportation plan.
Impervious cover can help frame runoff questions, yet it is not a flood-risk calculation. Chatham County’s coastal setting adds tides, low elevations, drainage systems, storm intensity, and extensive floodplain conditions that are not shown here. The county engineering and floodplain materials should be used for actual flood-zone or drainage work. This map is better treated as a screening graphic that identifies where hard surface is concentrated.
Reading the four maps as one coastal-urban set
Each image answers a different part of the same county story. The 2025 land-cover map establishes the largest classes and their broad geography. The forest-and-farmland map removes visual competition from developed classes so that remaining green, yellow, teal, and blue areas are easier to compare. The change map shows where endpoint classifications differ, and the impervious map measures the intensity of hard surface within and around developed land.
For a coastal-environment lesson, the strongest pairing is usually the countywide land-cover map with the forest-and-farmland view. The first provides the 43.70% wetland and 14.44% water context; the second helps the reader see where forest meets those wet areas and how little agriculture occupies the county. For an urban-growth discussion, the change map and impervious map are more direct because they show developed-class differences and the present concentration of hard surfaces.
A presentation does not need all four maps on one slide. One primary image plus one supporting image is often clearer. A county profile might lead with the 2025 land-cover map and add the impervious map to explain the Savannah-area urban concentration. A habitat or coastal-resources lesson might instead pair the land-cover map with the forest-and-farmland view. The endpoint change map works best when the caption explicitly says “1985–2025 class comparison” rather than implying a continuous annual record.
The summary percentages also become more meaningful when they are kept in their own categories. Developed land at 28.55% is not the same measure as mean impervious surface at 12.29%. Wetlands at 43.70% are not interchangeable with open water at 14.44%. The 11.35% mapped as changing to developed between endpoints is not the same as the entire present developed area. Keeping those distinctions intact prevents several common interpretation errors.
Scale, classification, and practical limits
Annual NLCD products generally use 30-meter raster cells. A single cell can contain a house, lawn, street, trees, drainage features, and bare ground, yet it still receives a predominant class for the land-cover product. Enlarging the image makes the cell visible but does not create parcel-level detail. Questions about a particular property require higher-resolution imagery, local GIS layers, current records, and often field inspection.
The supplied current maps represent the 2025 observation year. Construction, vegetation recovery, storm damage, shoreline change, or other events after that observation may not appear. Coastal environments can also vary with water level and vegetation conditions. For current permitting, zoning, infrastructure, or site planning, use the latest information from Chatham County, the Metropolitan Planning Commission, and the appropriate environmental agencies.
Legal land use is another separate subject. A red developed cell does not identify a residential, commercial, industrial, or institutional zoning district. A teal wetland cell is not a survey of a regulated wetland boundary. The maps are useful for regional land-cover context, education, and comparison, but they are not substitutes for parcel maps, property surveys, flood determinations, wetland delineations, or engineering studies.
Each downloadable JPG measures 2480 × 1754 pixels and is kept at the source resolution supplied in the package. That is larger than the WebP preview used in the article, but the manifest does not mark the JPGs as meeting an A3 high-resolution reference. They are practical for screens, reports, and moderate-size print layouts. For a large poster, make a test print first so the legend and boundary line remain readable.
Choosing and using the original JPG files
Start with the question rather than the map title. Use the 2025 land-cover image when you need the simplest countywide summary of wetlands, developed land, water, forest, and smaller classes. Choose the forest-and-farmland image when the location of remaining forest or the very small agricultural share matters. Use the impervious image for hard-surface concentration, and use the endpoint-change image only when the 1985-to-2025 class comparison is relevant.
Because all four maps use the same county outline, they can be compared in a document without changing the geographic frame. Keep the legends visible whenever possible. Similar colors do not mean the same thing from one map to another, and the pale background on the forest-and-farmland image has a different role from the pale background on the change or impervious maps. A short map-specific caption is more useful than a generic caption repeated four times.
Avoid enlarging and recompressing the JPGs repeatedly during editing. Small tidal channels, narrow developed corridors, and class boundaries can become harder to read after multiple exports. If the map must be reduced for a slide or web page, preserve its aspect ratio and confirm that the summary values and legend remain readable at the final display size.
Files included in the Chatham County download
The ZIP contains one original JPG for 2025 land cover, one for forest and farmland, one for impervious surface and developed land, and one for the 1985–2025 land-cover class comparison. Together they provide a compact set for explaining a county where a large metropolitan footprint occupies the inland side while wetlands and waterways dominate much of the coast and southern landscape.
Frequently Asked Questions
Why are wetlands 43.70% while open water is 14.44%?
They describe different surface classes. Open water covers exposed water surfaces, while wetland classes include saturated or water-influenced land with vegetation. Chatham County contains extensive coastal marshes, tidal channels, and other wet environments, so both categories are large without being interchangeable.
Does 28.55% developed land mean that 28.55% of the county is pavement or rooftops?
No. Developed land can include permeable surfaces such as lawns, trees, and bare ground around buildings and roads. The separate impervious product estimates hard surfaces more directly: the countywide mean is 12.29%, and 11.16% of cells have at least 50% impervious cover.
Can the 11.35% changing to developed be used to date individual subdivisions?
No. The change image compares the 1985 and 2025 endpoint classes. It does not identify the exact year of a change or prove its cause. Intermediate annual products, aerial imagery, and local development records are needed to establish timing for a specific location.
Sources and Reference Data
- MRLC Annual NLCD Data – official access point for annual land-cover and comparison products
- USGS Annual NLCD Land Cover Classification – definitions and guidance for developed, forest, agricultural, wetland, and related classes
- U.S. Census Bureau TIGER/Line Shapefiles – official county-boundary reference for Chatham County
- Chatham County–Savannah Metropolitan Planning Commission Comprehensive Plan – local planning information covering growth, land use, transportation, and natural resources
- Chatham County Floodplain Management Plan – county information on coastal floodplains, creeks, and wetland environments
Map File Information
The ZIP contains four original JPG maps for comparing Chatham County's coastal wetlands and water, Savannah-area developed land, impervious surfaces, remaining forest, limited agriculture, and 1985–2025 class differences.
- Included Files: Use only the versions confirmed in the article and supplied images
- File Type: Use the confirmed download contents
- Intended Use: Printing, education, presentations, and map-based projects
Related Maps
- Appling County Georgia Land Cover Map
- Atkinson County Georgia Land Cover Map
- Bacon County Georgia Land Cover Map
Green Map creates custom-edited map images using open geographic data sources such as geoBoundaries, Natural Earth, OpenStreetMap, and government open data.
These maps are edited visual materials, not raw data files, and are provided for education, documents, presentations, and graphic reference.