Wetlands define more than half of Charlton County in the supplied 2025 data, while forest fills much of the remaining natural landscape. The broad western wetland block contrasts sharply with the narrower eastern and southern areas where forest, shrub and grass cover, small agricultural patches, and developed land are mixed. This Charlton County Georgia Land Cover Map set lets you compare that countywide pattern with forest and farmland, hard surfaces, and the 1985–2025 class comparison.
The four original JPG maps are available together in one ZIP. Each image is 2480 × 1754 pixels, so the set works well for county profiles, classroom handouts, slides, and side-by-side environmental comparisons. These are land-cover reference graphics rather than parcel, zoning, ownership, wetland-jurisdiction, or permitting maps, so detailed property decisions require current local records and higher-resolution sources.
Table of Contents
A county split between broad wetland country and a narrower settled east
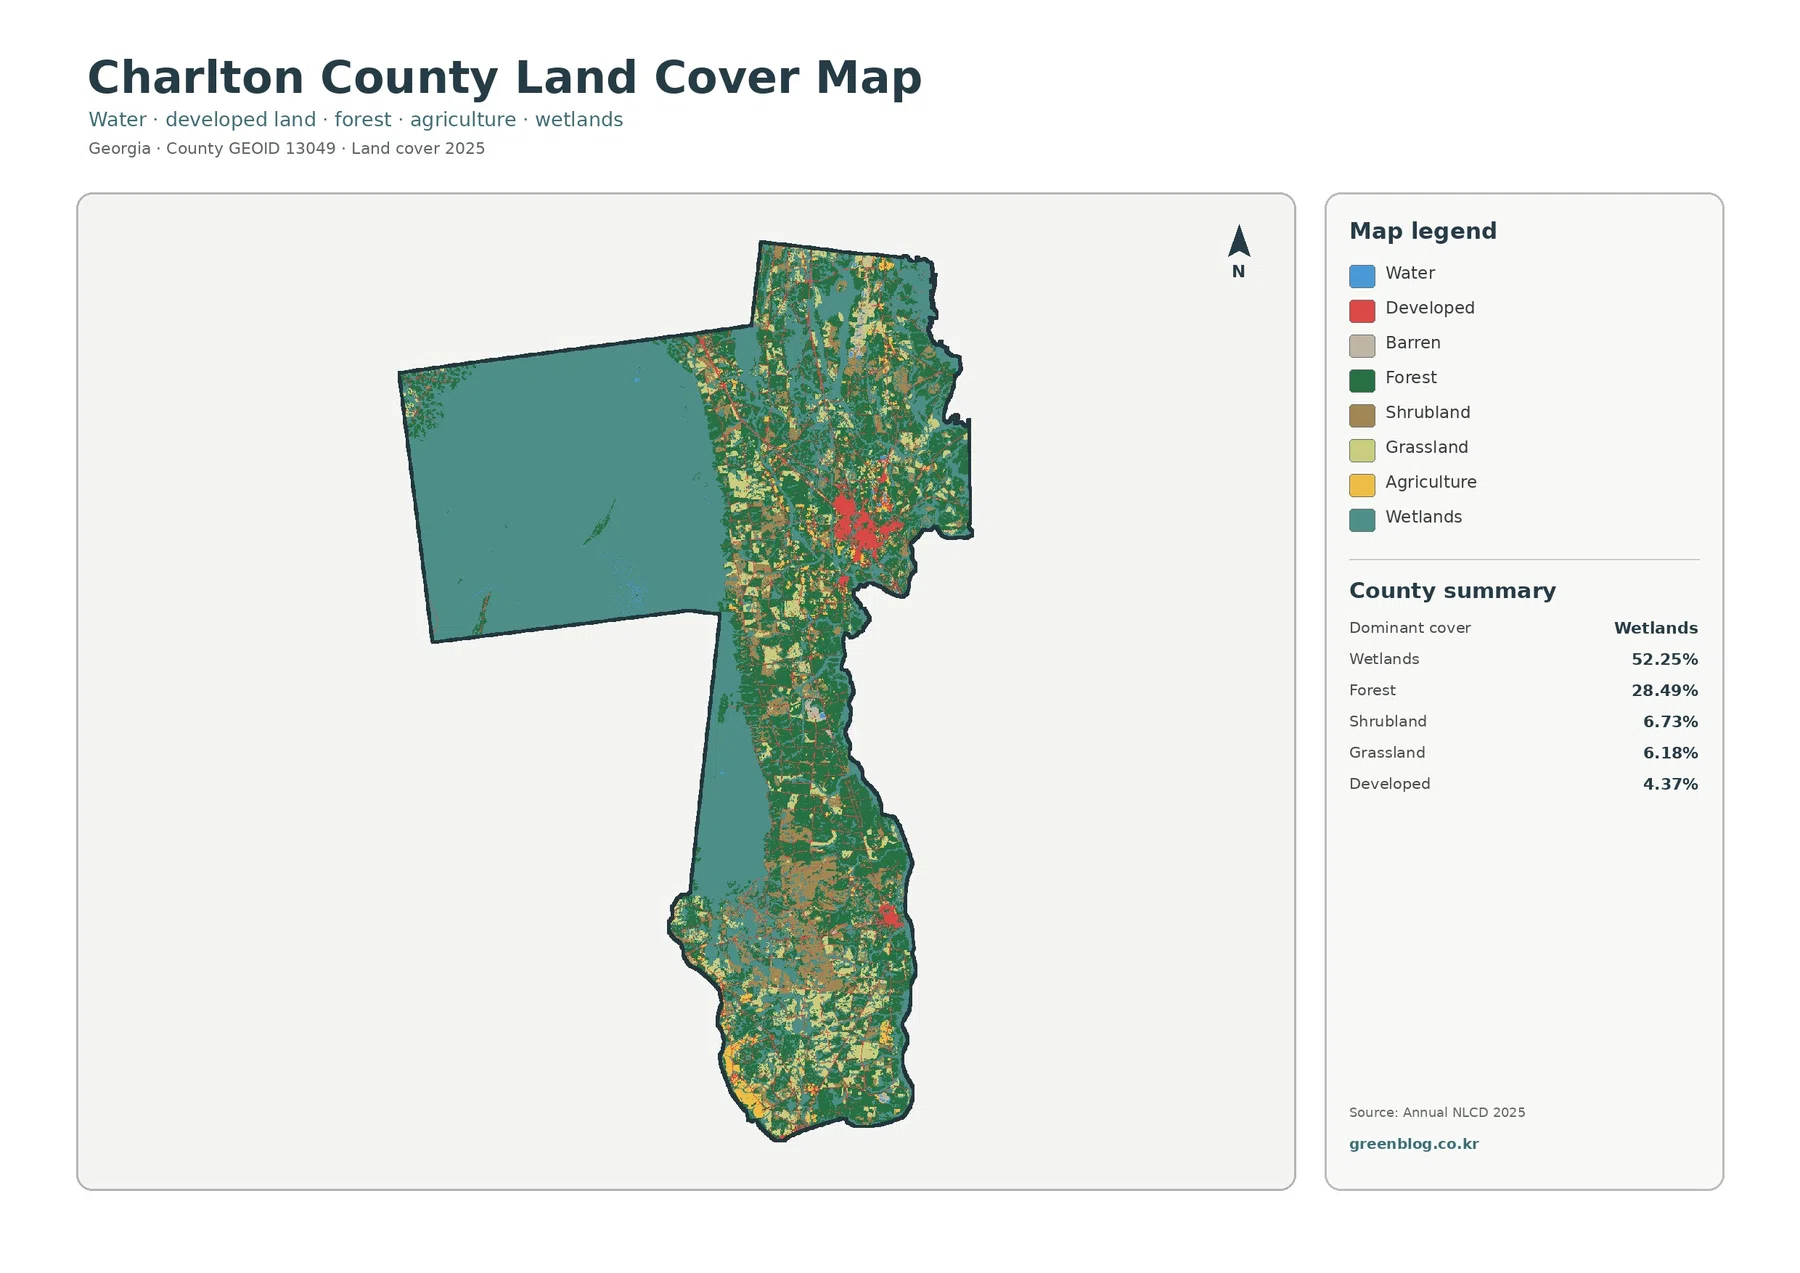
The county summary immediately sets Charlton County apart from a typical farm-dominated landscape. Wetlands account for 52.25% of the mapped area and forest for 28.49%. Shrubland contributes 6.73%, grassland 6.18%, developed land 4.37%, and agriculture 1.33%. The map therefore describes a place where wet and wooded surfaces dominate, while built and cultivated land occupy much smaller shares.
The western side is the clearest visual feature. A large teal wetland block covers most of the west, with only small interruptions of other classes. This pattern fits the Okefenokee landscape associated with Charlton County. The U.S. Fish and Wildlife Service places the main Suwannee Canal Recreation Area southwest of Folkston and describes the refuge as a mosaic of wet prairie, forested cypress swamp, and other habitats. The land-cover image does not draw the refuge boundary, but that official context helps explain why western Charlton looks so different from the county’s settled east.
East of that broad wetland area, the colors break into smaller pieces. Forest remains common, yet it is interspersed with wetlands, shrubland, grassland, scattered agriculture, and compact red developed clusters. The strongest developed concentration lies around the Folkston and Homeland area. Because municipal boundaries are not printed on the land-cover image, the red footprint should not be treated as the exact shape of either city. It is better used to show where developed surfaces are concentrated within the county.
The 1985–2025 comparison is mostly about forest-class differences, not urban expansion
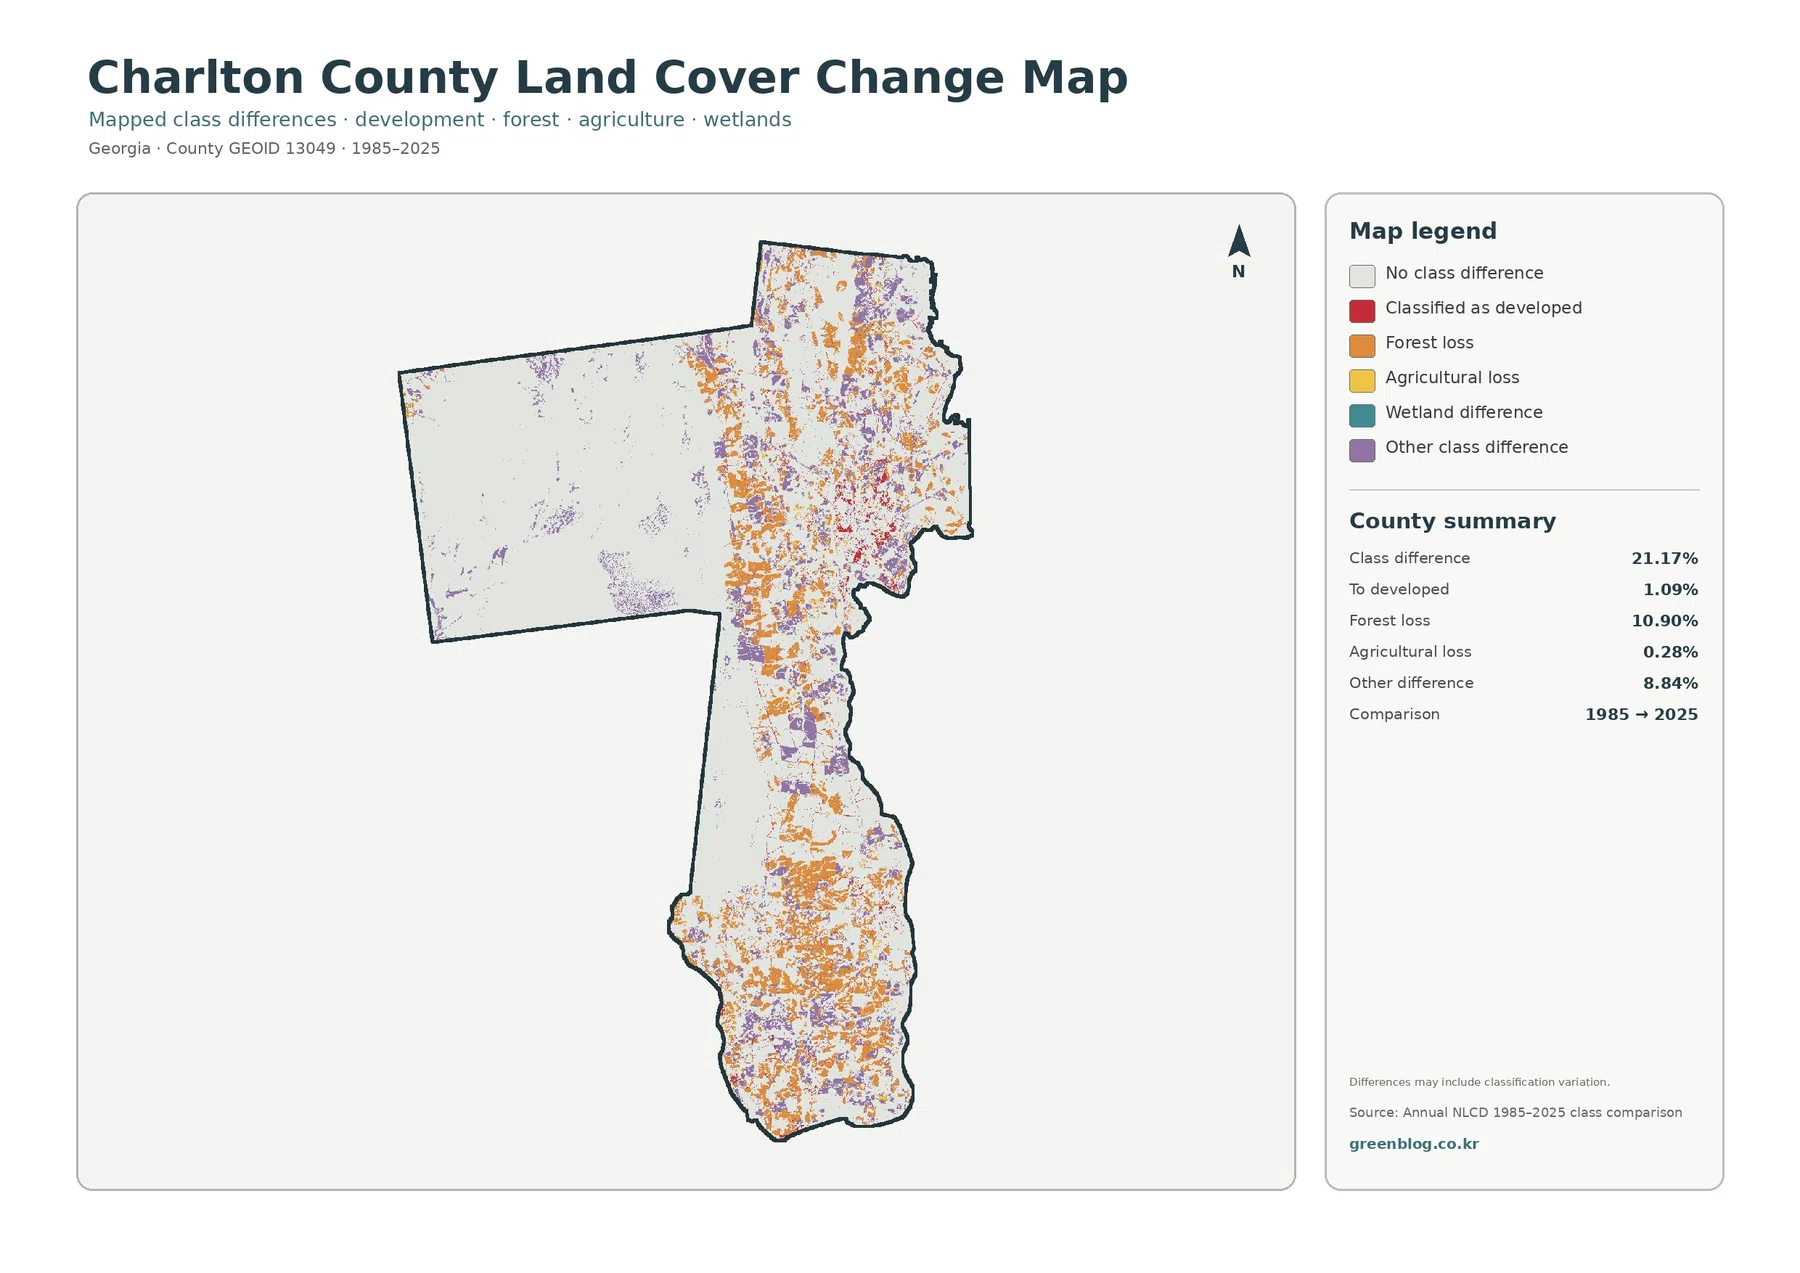
The change map compares the 1985 and 2025 endpoints rather than showing every year in between. Its summary reports a 21.17% class difference across the county. The largest named component is the forest-loss category at 10.90%. Cells classified as developed at the 2025 endpoint account for 1.09%, agricultural loss for 0.28%, and other class differences for 8.84%. A wetland-difference color also appears in the legend, but the supplied summary does not give a separate exact percentage for it.
Orange forest-loss cells are scattered widely through the eastern and southern portions of the county, with additional patches in the north. In contrast, much of the large western wetland block remains light, indicating many cells with no class difference between the two endpoints. The result is not a simple story of urban growth spreading across Charlton County. Development-related change is visible, but it represents a much smaller share than the mapped forest-loss category and the broader set of other class differences.
The label “forest loss” also needs careful wording. It identifies cells that moved away from a forest class between the two mapped endpoints; it does not, by itself, establish the date, cause, or permanence of a forest change. Timber activity, vegetation shifts, disturbance, recovery, and classification variation can all require closer investigation. A specific site should be checked against intermediate-year imagery, aerial photography, management records, or field observations before a cause is assigned.
Forest and wetland dominate; agriculture is a small mapped share
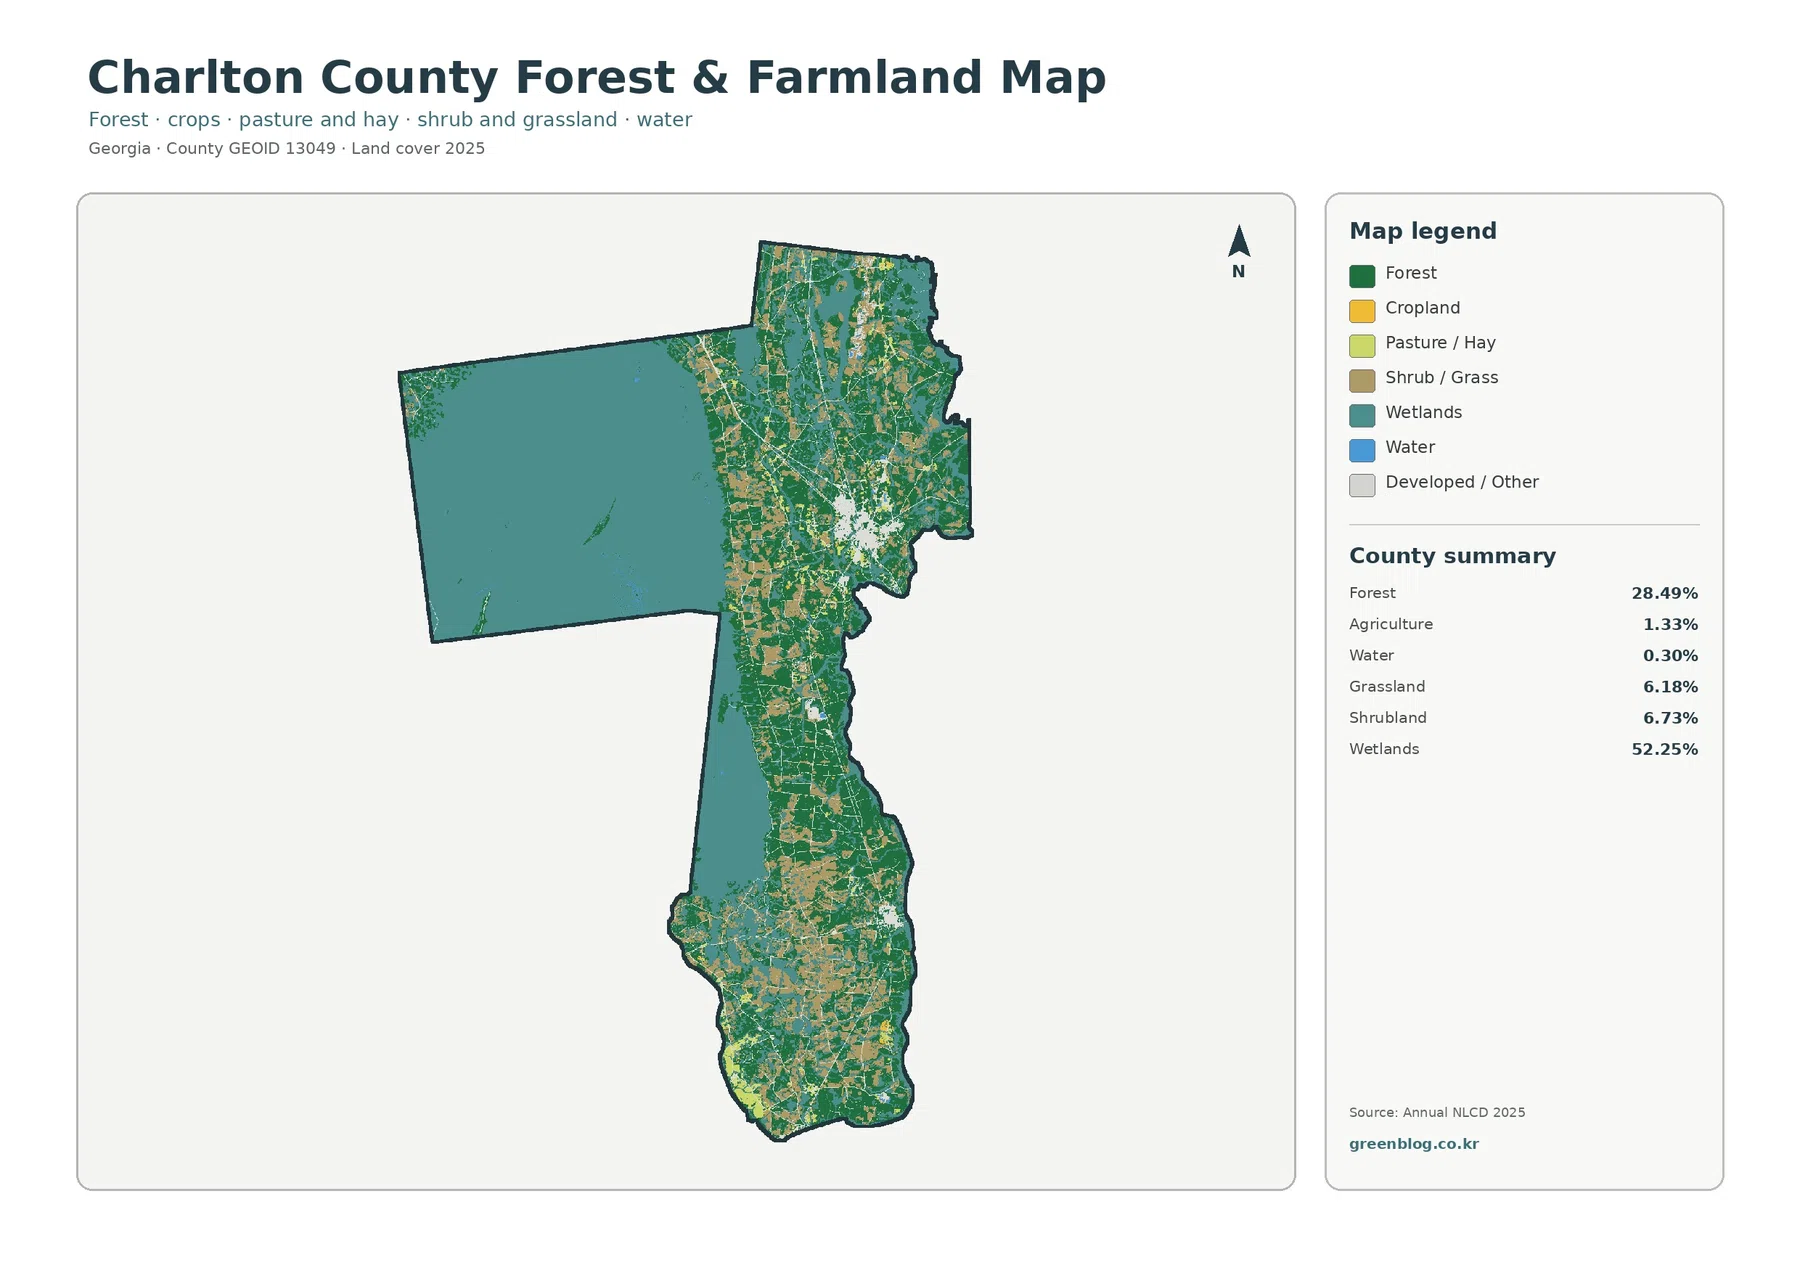
The forest-and-farmland view makes the county’s natural-cover balance easier to read. Wetlands still lead at 52.25%, followed by forest at 28.49%. Agriculture is only 1.33%, while grassland and shrubland together occupy a noticeably larger share. Open water is 0.30%. The large gap between wetland and water percentages is important: wetland classes can include saturated or water-influenced vegetation, while the water class is intended for open water surfaces.
Forest is not evenly distributed as one unbroken blanket. Large green areas run through the eastern and southern portions of the county and meet the edge of the broad western wetland. Smaller openings, shrub or grass areas, and wetland pockets interrupt those forest blocks. This mosaic is useful for habitat and landscape comparisons because it shows the transition from the Okefenokee side of the county to the more varied cover around settled areas without suggesting that every green cell represents identical forest conditions.
Hard surfaces cluster around Folkston and along thin travel lines
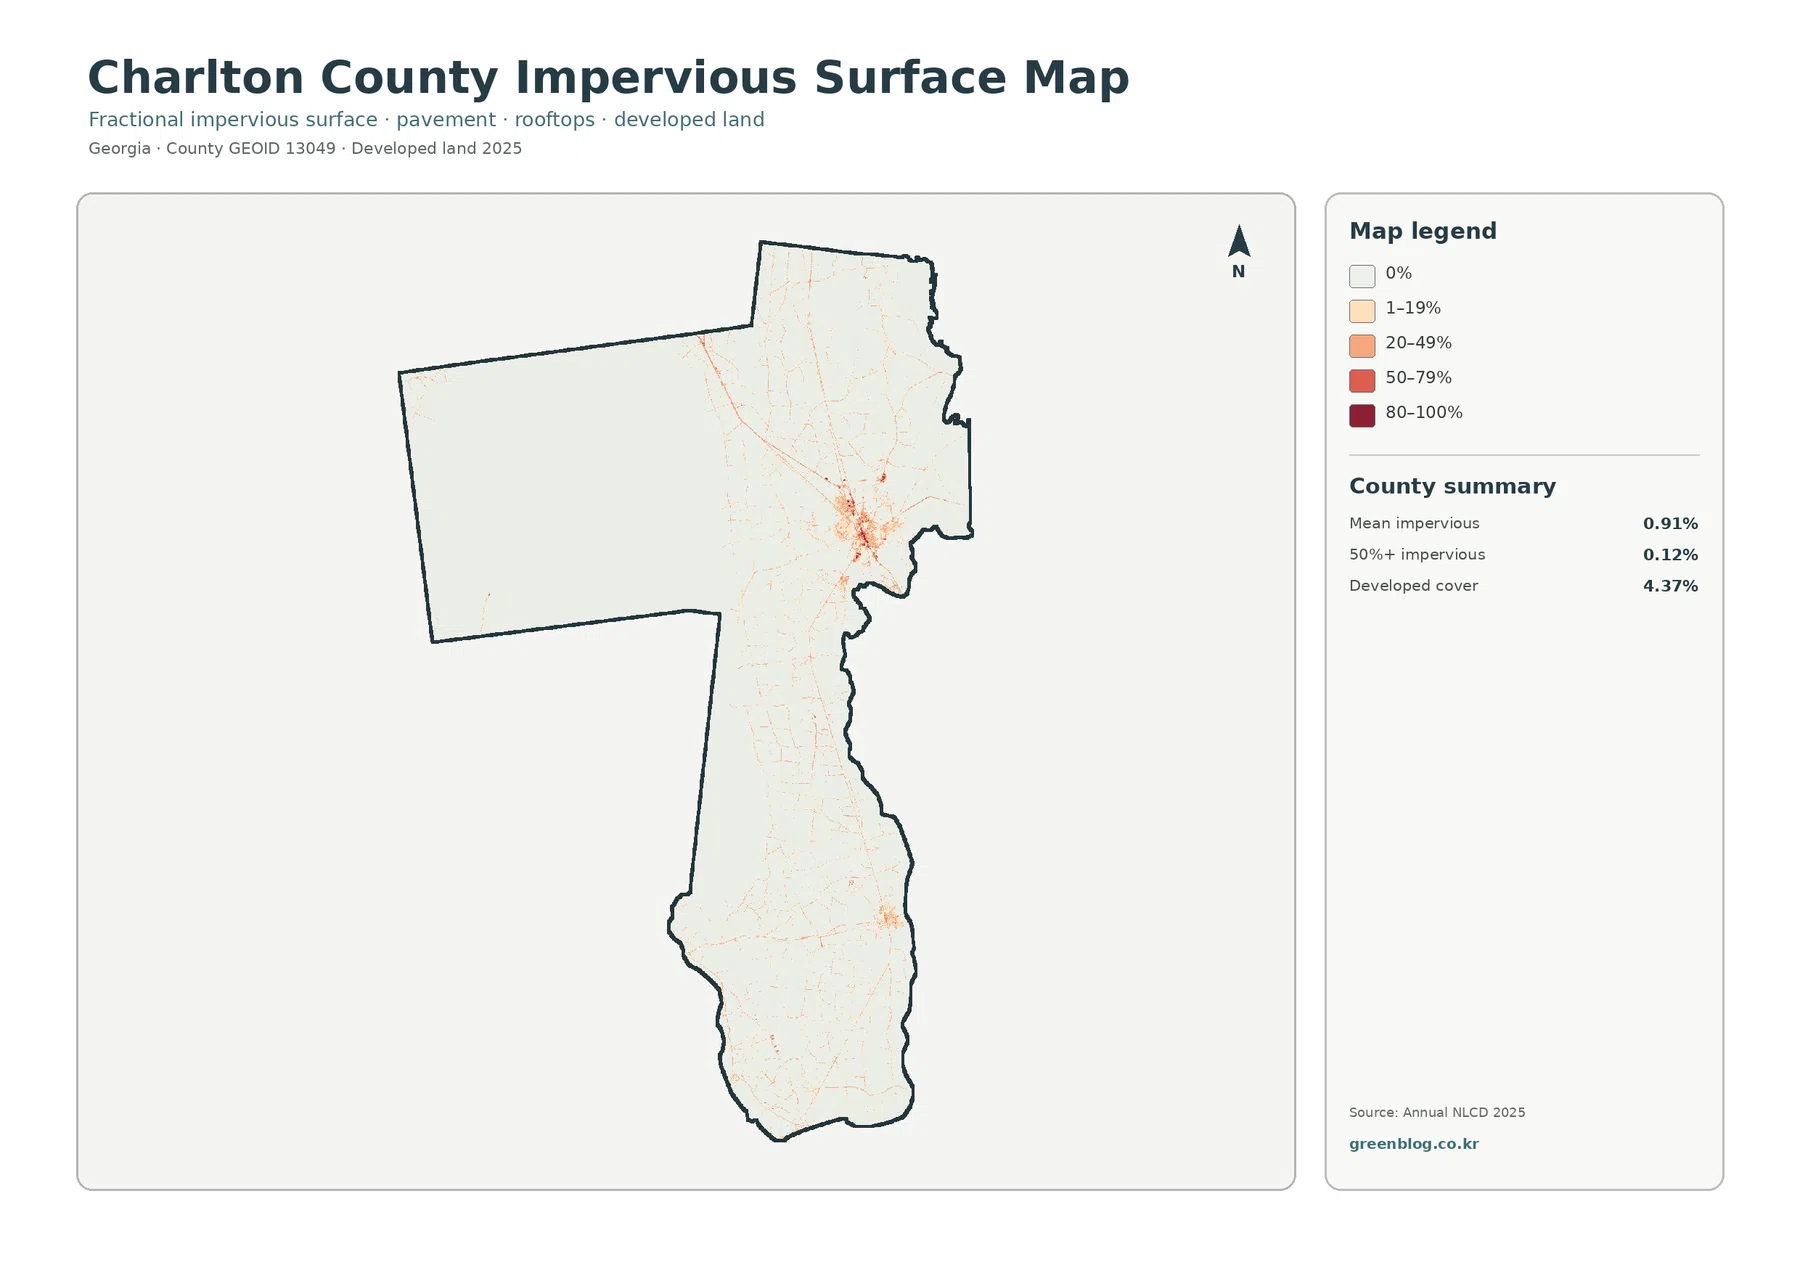
The impervious-surface image looks sparse because hard cover occupies only a small share of Charlton County. Mean impervious cover is 0.91%, and cells that are at least 50% impervious make up 0.12%. Developed land is higher at 4.37% because a developed land-cover class can include lawns, trees, soil, and other permeable surfaces around buildings and streets. Impervious cover is narrower: it focuses on surfaces such as roofs, pavement, and parking areas where water has difficulty soaking into the ground.
The brightest cluster is around Folkston, with a compact center and thin lines extending outward. Those lines have the appearance of transportation corridors, although road names are not printed on this product. Federal refuge information identifies routes from Folkston toward the Suwannee Canal Recreation Area and Kingfisher Landing, which provides useful local orientation. The image should still be paired with an official road map when a route name or exact alignment matters.
How to use the four files without over-reading the pixels
Scale is an important limitation. Annual NLCD is designed for consistent regional land-cover comparison, not parcel surveying. A 30-meter raster cell represents a square area on the ground and receives one predominant class even when several surfaces are present. Mixed pixels are common around narrow roads, small ponds, forest edges, yards, and small agricultural patches. Zooming the JPG makes those pixels larger on screen but does not create new detail.
Four original JPG maps in one file set
The ZIP contains one original JPG for 2025 land cover, one for forest and farmland, one for impervious surface and developed land, and one for the 1985–2025 land-cover comparison. Keeping all four together makes it easier to use the same county boundary while changing the question from current surface cover to natural-cover balance, hard-surface concentration, or endpoint difference. Choose the single map that matches the immediate topic, or place several side by side when the relationship between current cover and change is important.
Frequently Asked Questions
Why do wetlands cover 52.25% of Charlton County while open water is only 0.30%?
Wetlands and open water are different land-cover classes. Wetlands can include saturated ground and vegetation influenced by water, while the water class focuses on open water surfaces. That distinction is especially important in the Okefenokee landscape, where extensive wetland vegetation does not appear as a single open-water body.
Can the bright Folkston cluster be used as the official city boundary?
No. The developed and impervious clusters provide broad land-cover context, not municipal boundaries. They line up with the Folkston and Homeland settlement area, but exact city limits, zoning districts, road names, and development rules should come from official county, city, or state planning sources.
Does the 10.90% forest-loss category mean 10.90% of the county was definitely clear-cut?
No. It is the share assigned to the forest-loss category in the 1985–2025 endpoint comparison. It indicates a class change away from forest at those cells, but it does not establish when the change occurred or why. Intermediate imagery, forestry records, and field information are needed to determine a specific cause.
Sources and Reference Data
- MRLC Annual NLCD Data – official access to Annual NLCD land-cover and comparison products
- USGS Annual NLCD Land Cover Classification – class definitions and guidance for forest, wetlands, agriculture, developed land, and related cover types
- U.S. Census Bureau TIGER/Line Shapefiles – official county-boundary reference for Charlton County
- U.S. Fish & Wildlife Service – Okefenokee National Wildlife Refuge – official context for the Okefenokee landscape and Folkston-area refuge access
- Georgia DCA – Charlton County with Cities of Folkston & Homeland – state planning resources for Charlton County, Folkston, and Homeland
Map File Information
The ZIP contains four original JPG maps for comparing Charlton County's 2025 wetlands and forest, small agricultural share, Folkston-area hard surfaces, and 1985–2025 class differences.
- Included Files: Maps described in this article
- File Type: ZIP archive available from the download link below
- Intended Use: Printing, education, presentations, and map-based projects
Related Maps
- Appling County Georgia Land Cover Map
- Atkinson County Georgia Land Cover Map
- Bacon County Georgia Land Cover Map
Green Map creates custom-edited map images using open geographic data sources such as geoBoundaries, Natural Earth, OpenStreetMap, and government open data. These maps are edited visual materials, not raw data files, and are provided for education, documents, presentations, and graphic reference.