Forest is the largest land-cover class in Catoosa County, but the county is far from uniformly wooded. The supplied 2025 summary gives forest 43.54%, developed land 27.16%, and agriculture 26.18%. On this Catoosa County Georgia Land Cover Map, the broadest built concentration sits in the northwest while larger, more continuous forest patches occupy much of the east and southeast.
This page pairs that countywide view with a forest-and-farmland map, an impervious-surface map, and a 1985–2025 class-difference map. All four WebP previews appear beside the explanation, and the four original 2480 × 1754-pixel JPG maps are available together in one ZIP. The set works best as a county-scale reference rather than a parcel or engineering map.
Table of Contents
Forest leads the total, yet developed and agricultural land nearly split the remainder
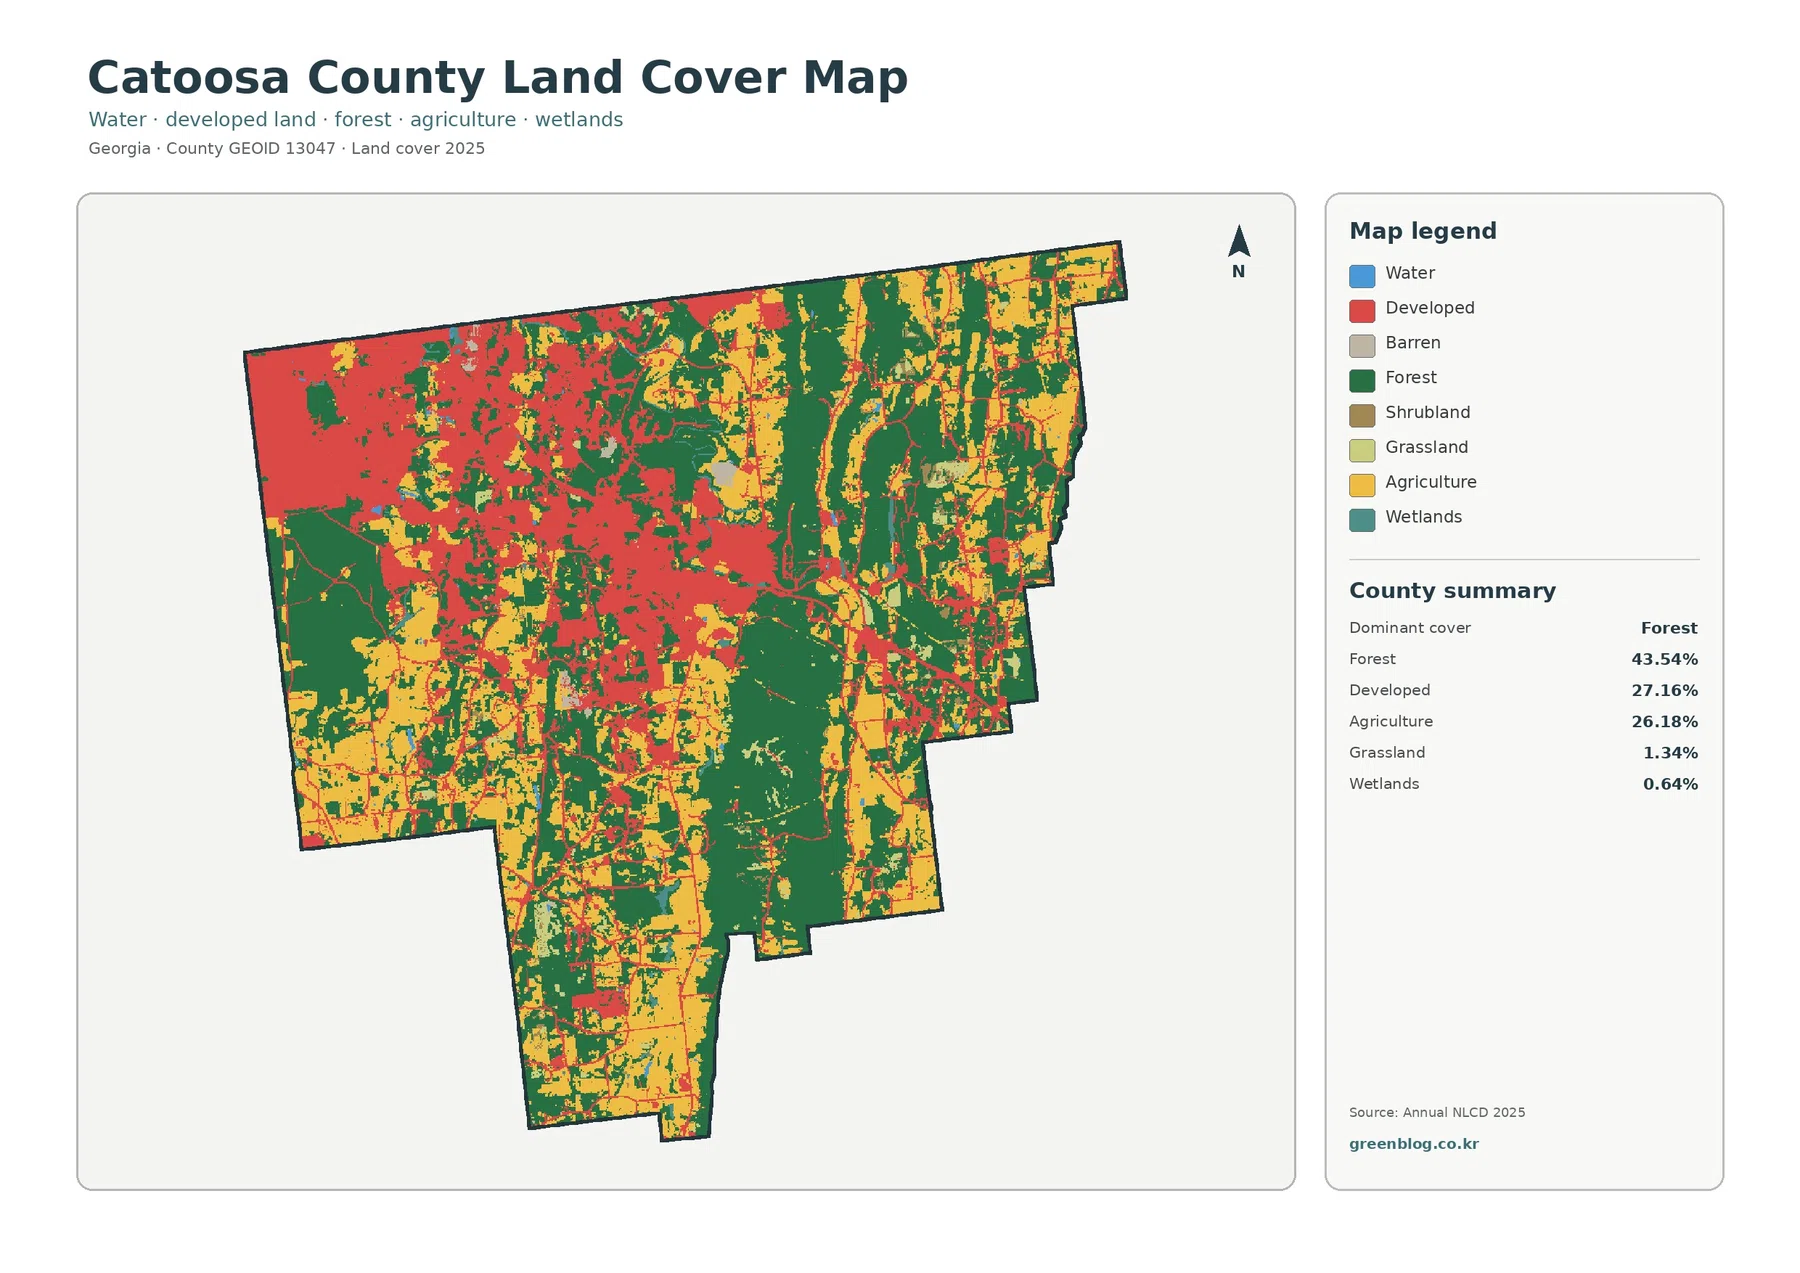
The balance among the three largest classes is what makes this county visually distinctive. Forest accounts for 43.54%, while developed land and agriculture are close at 27.16% and 26.18%. Grassland is 1.34% and wetlands are 0.64%; the companion natural-cover summary also lists water at 0.26% and shrubland at 0.59%. Barren ground appears only in small scattered pieces rather than as a major countywide surface.
Red developed cells spread across much of the northwest and western side and also form a diagonal band through the interior. Farther east, dark green becomes more continuous, with agricultural colors appearing as elongated blocks and smaller openings between wooded areas. The southern extension of the county has a mixed pattern as well, so the map does not divide neatly into one urban half and one rural half. Instead, the transition repeats at several scales.
That pattern makes sense when the map is placed beside Catoosa County’s settlement and transportation geography. Fort Oglethorpe lies on the western side, Ringgold is a major center farther east, and Interstate 75 crosses the county diagonally. Georgia’s current comprehensive plan describes four I-75 interchanges and treats the interstate as an important access corridor connected to Chattanooga and regional business activity. The land-cover map shows association with that corridor, but it cannot prove why any individual cell became developed.
Land cover should also be kept separate from legal land use. A satellite-derived developed class does not tell the reader whether a parcel is residential, commercial, industrial, or zoned for future development. Likewise, a forest-class cell is not automatically conservation land. The map classifies visible surface cover at a generalized scale; ownership, zoning, easements, permits, and parcel boundaries require other official records.
The impervious map isolates the northwest urban footprint and the I-75 corridor
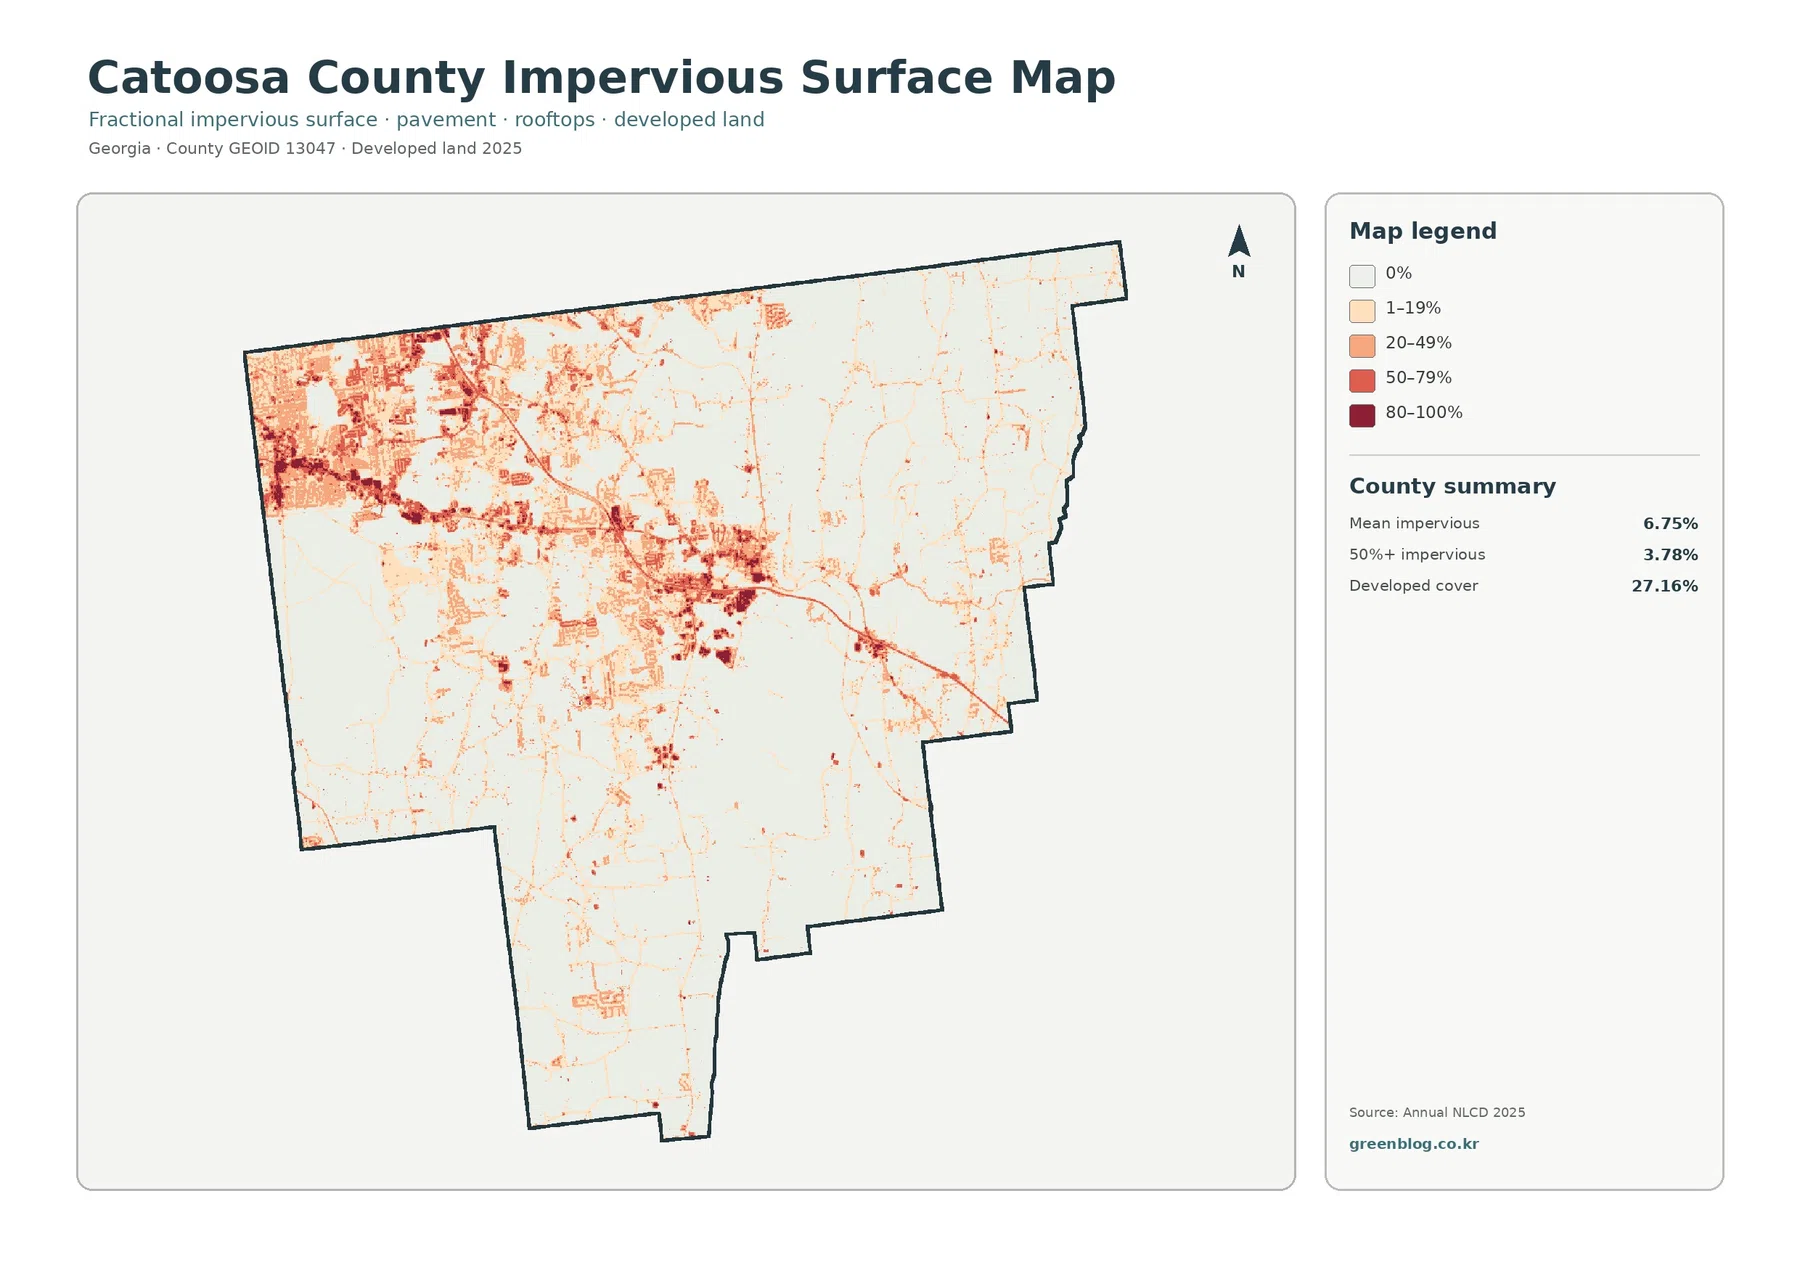
Impervious surface means material such as pavement or a roof that does not readily absorb rainfall. The countywide mean is 6.75%, and 3.78% of mapped cells are at least 50% impervious. Those figures are much lower than the 27.16% developed-cover share because developed classes can contain lawns, trees, bare soil, and other permeable surfaces around homes, stores, schools, and roads. The two measures answer related but different questions.
The strongest hard-surface cluster occupies the northwest. Dense dark patches are also linked by a diagonal route across the upper and central part of the county, while most of the east and south show thinner lines and isolated spots. That contrast is more obvious here than on the general land-cover map because vegetation and farmland are visually suppressed. A reader studying settlement intensity can quickly distinguish broad urban fabric from narrow road traces and small rural developed sites.
Catoosa County’s 2026 comprehensive plan identifies interstate-gateway areas at I-75 interchanges with Cloud Springs Road, Battlefield Parkway, Alabama Highway, and US 41/US 76. It also notes the county’s proximity to Chattanooga and its role in the metropolitan transportation system. The impervious image does not label those roads, so it should not be used as a navigation map. It is useful, however, for comparing the concentration of hard surfaces with a separate road or planning map.
Hard-surface concentration can be relevant to discussions of stormwater or urban heat, but this image does not map either hazard directly. Drainage infrastructure, slope, soil, rainfall, stream position, shade, and building form all matter. A dark red patch simply indicates a high impervious fraction within the mapped cell. Treat it as a screening layer that points to intensively built areas, not as a flood-risk or temperature forecast.
Wooded ridges become clearer when developed land is pushed into the background
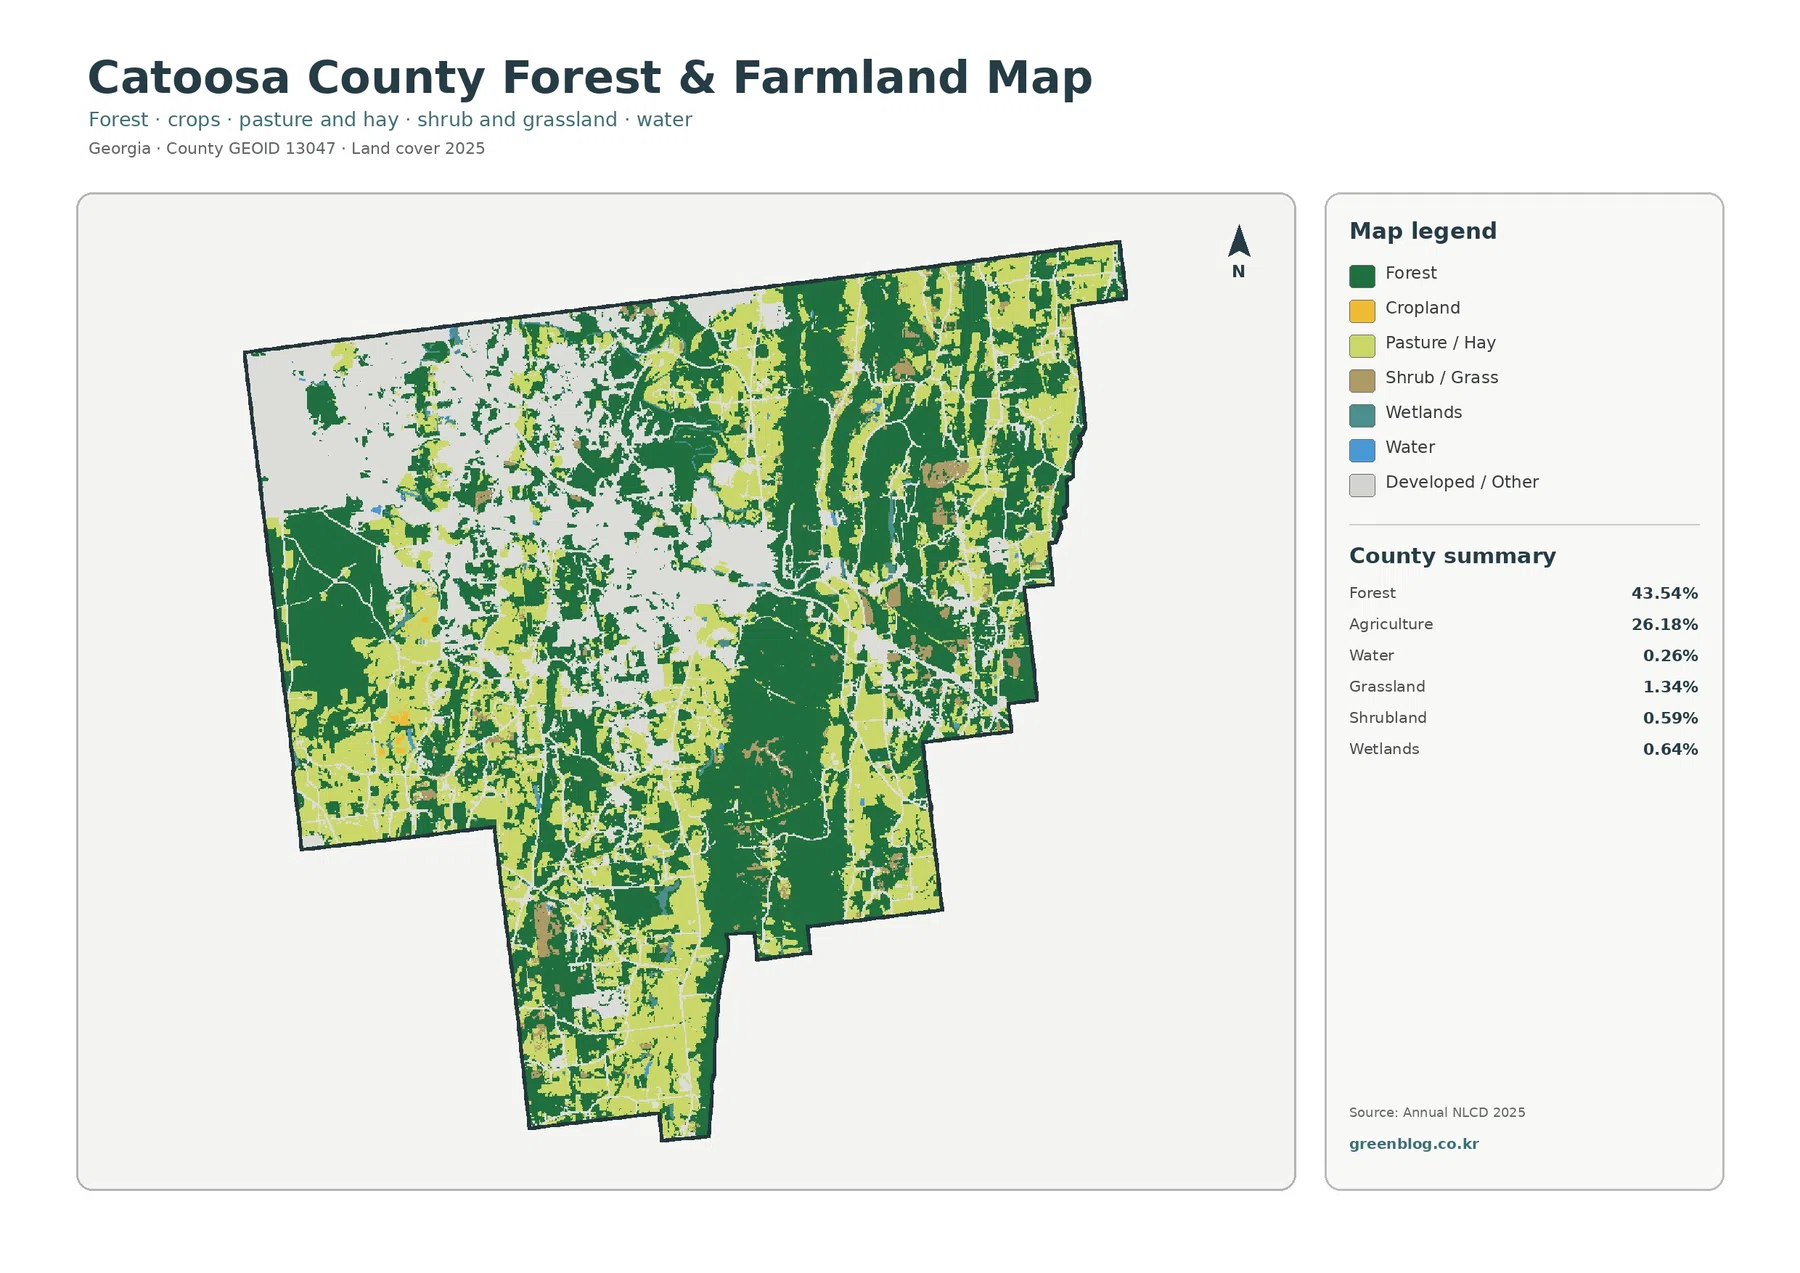
Removing the strong developed color changes the visual story. Forest forms wide connected areas through the eastern and southeastern portions of Catoosa County and another substantial block in the south-central interior. Agricultural land is more broken, appearing in long strips, medium-size fields, and smaller openings around the wooded pattern. In the west, pale developed areas interrupt both forest and farmland more frequently, matching the denser settlement visible in the impervious view.
The county sits within Georgia’s Appalachian Ridge and Valley region. Local planning and state geological sources describe a western Chickamauga Valley area and prominent eastern ridges associated with White Oak Mountain and Taylor Ridge. That physical setting provides useful context for the long wooded bands on the eastern side of the map. It would still be a mistake to derive exact elevation from land cover alone, because this image has no contours, slope classes, or hillshade.
Agriculture remains a major part of the county at 26.18%, nearly matching developed land in the county summary. Working or open land is not confined to one corner. It appears between forested areas in the east, through parts of the south, and in scattered western pockets where development is less dense. Catoosa County’s UGA Cooperative Extension maintains a local Agriculture and Natural Resources program, a useful reminder that the agricultural pattern on the map corresponds to an active local land-management context.
Open water covers only 0.26% and wetlands 0.64% in the supplied summaries. Those small area shares explain why blue and teal rarely dominate a large block. Narrow streams can also be difficult to represent continuously in a 30-meter land-cover grid, especially when a cell contains water, vegetation, bank material, and nearby development at the same time. The small mapped water share should not be interpreted as evidence that streams are unimportant in the county.
One quarter of cells differ between the 1985 and 2025 endpoint classifications
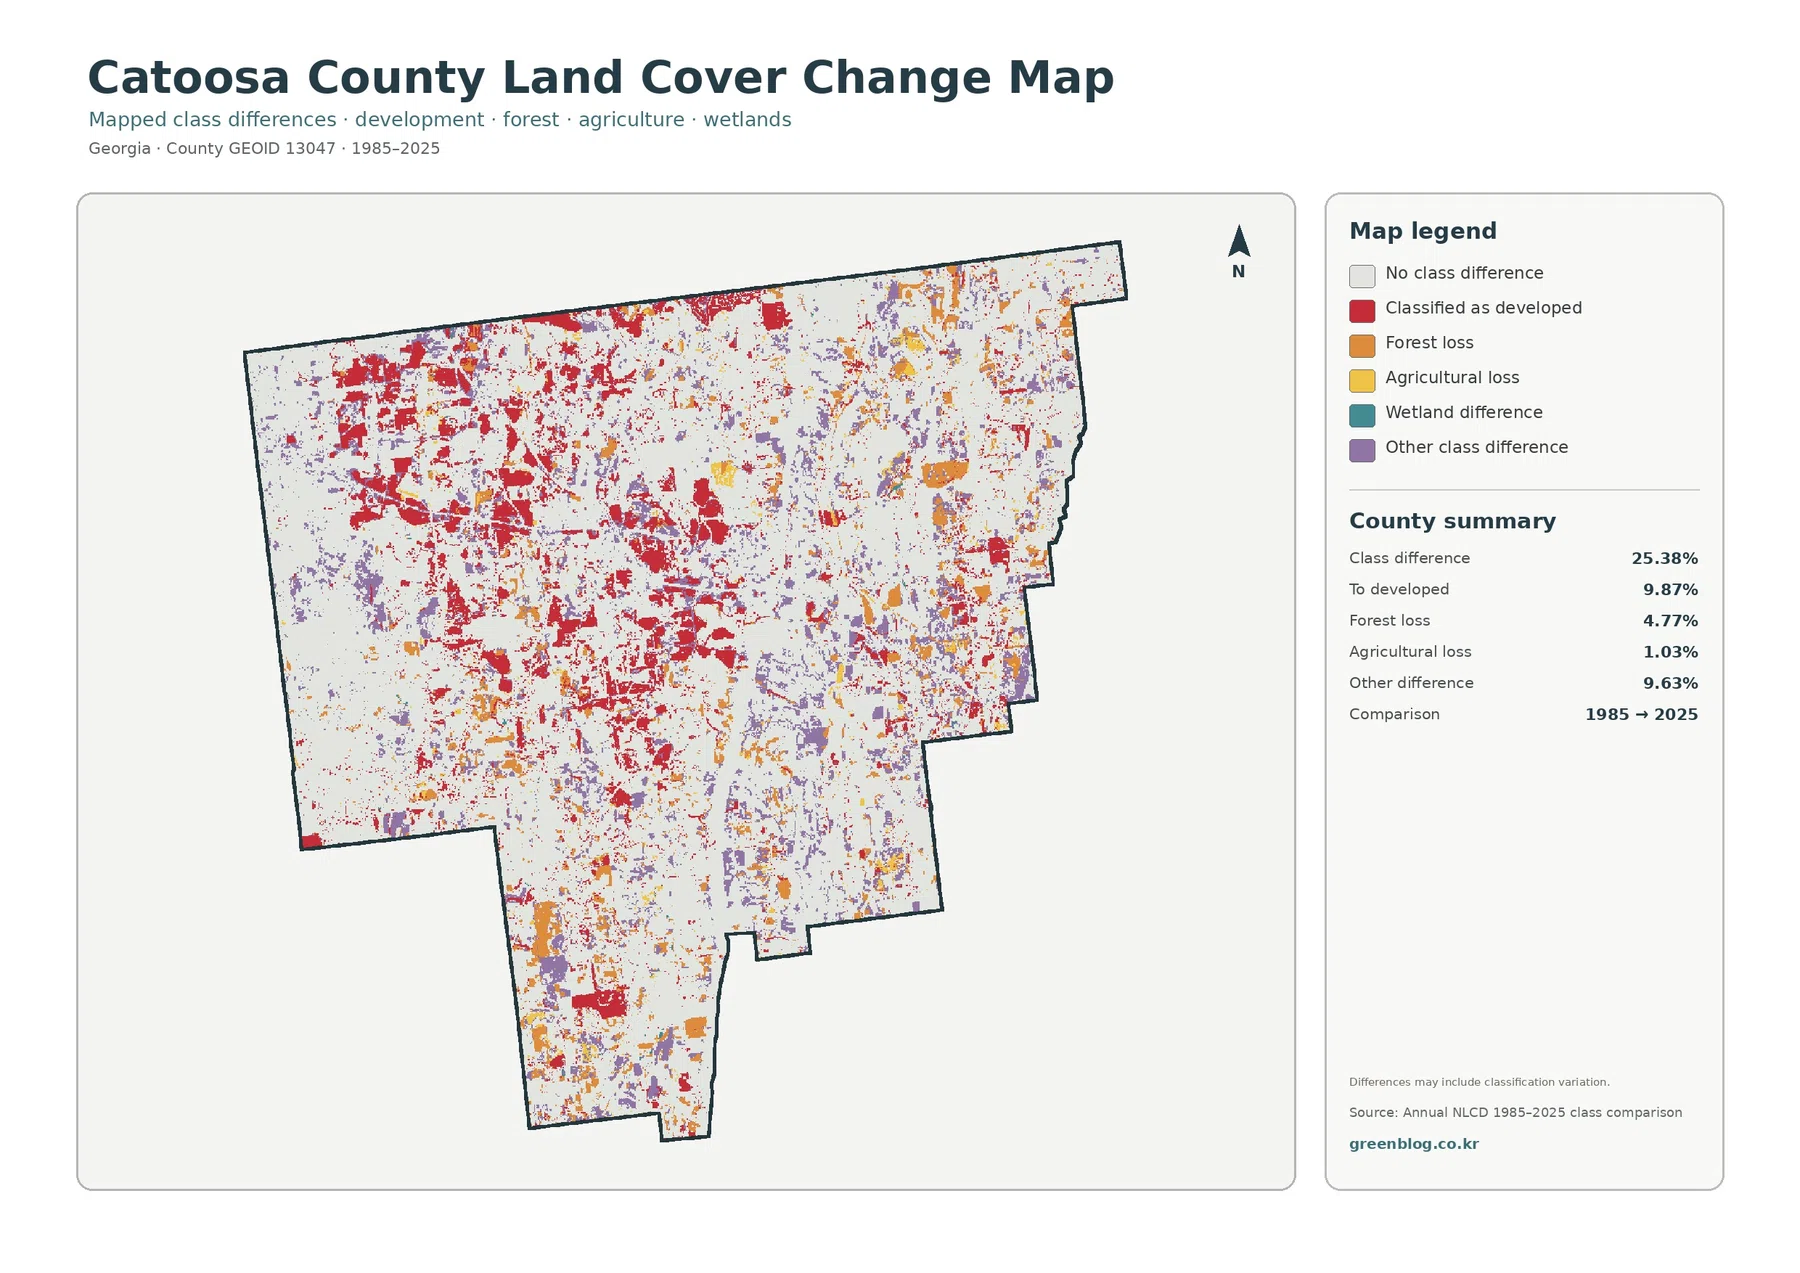
The change summary reports a class difference across 25.38% of cells. Of the named categories, 9.87% are classified as developed at the 2025 endpoint after another 1985 class, 4.77% are mapped as forest loss, 1.03% as agricultural loss, and 9.63% as other differences. The large pale background represents places whose endpoint classes match. Matching endpoints do not guarantee that nothing happened between the two dates.
Red transition-to-developed cells are especially conspicuous in the northwest and appear along the same broad diagonal corridor that stands out on the impervious map. They also occur in smaller clusters elsewhere. Orange forest-loss marks are more scattered across the east, center, and south, while agricultural-loss marks occupy a much smaller share. The map therefore separates several kinds of endpoint change rather than collapsing every difference into one generic change color.
This is not a year-by-year development history. A cell that changed from forest to another class sometime after 1985 and then returned to forest by 2025 could finish with matching endpoints and disappear from the difference layer. Conversely, a small classification shift at one endpoint may be mapped even when the landscape change is subtle. The note on the supplied map explicitly warns that class differences may include classification variation.
For research, the best use of this layer is to locate areas worth checking more closely. A broad red cluster can be followed with historical aerial photography, intermediate-year land-cover products, road records, or local planning documents. That sequence can help narrow down timing and context without turning a two-date raster comparison into an unsupported claim about a specific subdivision, business, or transportation project.
South and West Chickamauga Creeks add context that area percentages alone miss
Catoosa County’s open-water percentage is small, but named creeks are important geographic references. The county’s official outdoor-activities page describes South Chickamauga Creek access in downtown Ringgold and West Chickamauga Creek access near Fort Oglethorpe and Cloud Springs. The streams continue toward Tennessee and the Chattanooga area. These narrow water features can shape local geography even though they occupy only a small fraction of the county’s mapped surface.
South Chickamauga Creek also provides a useful way to connect the land-cover maps with a real place. Ringgold sits where the ridge-and-valley terrain narrows around a gap, and the creek passes through the city. When forest, agriculture, development, and water are viewed together, the county reads less like a set of abstract percentages and more like a sequence of wooded ridges, settled valleys, transportation corridors, and narrow drainage routes.
Still, the land-cover water and wetland classes are not substitutes for a stream network, flood map, or regulatory wetland inventory. A narrow channel may be generalized, and wet vegetation may be classified differently depending on the cell and source imagery. Anyone evaluating a specific property, crossing, drainage project, or wetland jurisdiction should move from this county-scale reference to the appropriate official hydrology and parcel resources.
Use the four views as a sequence rather than forcing one map to answer every question
For a general county profile, begin with the 2025 land-cover map because it establishes the three-way balance among forest, developed land, and agriculture. If the discussion turns to working land or habitat context, the forest-and-farmland view removes much of the visual weight of development and makes the eastern wooded bands easier to follow. That second map is also better for comparing small agricultural openings with larger forest blocks.
For transportation or settlement discussions, move to the impervious map. Its percent scale distinguishes lightly developed areas from cells dominated by pavement and roofs, which is useful around Fort Oglethorpe, Ringgold, and the I-75 corridor. Then use the change map only when the question involves differences between 1985 and 2025. Keeping those roles separate prevents a developed class from being mistaken for a hard-surface percentage or an endpoint difference from being treated as a dated construction record.
In a classroom, presentation, or county comparison, the maps can also be shown side by side. Ask first where the forest is most continuous, then where the hard surfaces cluster, and finally whether the change layer emphasizes the same places. That approach encourages readers to compare evidence rather than memorize one statistic. It is particularly effective in Catoosa County because the northwest-to-east contrast remains visible across several layers while each layer adds a different kind of information.
Scale and classification limits matter before zooming into individual sites
Annual NLCD products use 30-meter raster cells, meaning the landscape is divided into squares and each square is summarized rather than surveyed as a parcel. A cell may include part of a road, several trees, lawn, a roof, and bare soil. Mixed pixels are therefore unavoidable near edges between forest, fields, subdivisions, and water. Enlarging the JPG makes the pixels larger on screen; it does not create missing building or property detail.
The current land-cover views represent the supplied 2025 observation year. Construction, timber harvest, farm conversion, vegetation recovery, storm effects, or other changes after that observation may not appear. The 1985–2025 comparison has another limitation because it summarizes only its endpoints. Current planning or site decisions should use recent aerial imagery and local records in addition to these reference graphics.
Classification should be read in broad patterns first. Large connected forest blocks, a persistent northwest hard-surface cluster, and repeated red endpoint differences are more useful at this scale than one isolated pixel. Small cells near roads, streambanks, field edges, and suburban lots deserve caution because neighboring materials can influence the assigned class. This is one reason the maps are suited to countywide explanation but not legal boundary or site-design work.
Each original JPG is 2480 × 1754 pixels. The supplied asset manifest does not mark the files as meeting an A3 high-resolution reference, so a large poster should be test-printed before final use. For documents, web references, teaching slides, and moderate-size graphics, keeping the original file dimensions and avoiding repeated recompression will preserve the legend and boundary lines more reliably.
What is included in the four-map JPG download
The ZIP contains one JPG each for 2025 countywide land cover, forest and farmland, impervious surface and developed land, and 1985–2025 land-cover change. Together they cover four different questions: the current countywide surface, natural-cover detail, hard-surface concentration, and endpoint differences. They are reference maps, not survey plats, zoning maps, wetland delineations, flood maps, or engineering drawings.
Frequently Asked Questions
Why does Catoosa County look heavily developed if forest is still the largest class?
Development is spatially concentrated rather than evenly distributed. Forest leads at 43.54%, but developed land still covers 27.16% and forms a broad northwest cluster plus a diagonal corridor through the county. Large forest blocks remain more continuous in the east and southeast, so both impressions can be true depending on which part of the map a reader is viewing.
Does 27.16% developed cover mean 27.16% of the county is pavement or rooftops?
No. Developed land can include permeable surfaces such as lawns, soil, and trees around buildings and roads. The separate impervious layer is designed to isolate hard surfaces more directly; its countywide mean is 6.75%, and 3.78% of cells are at least 50% impervious. Those metrics should not be treated as interchangeable.
Can the 9.87% transition to developed land be used as an exact construction total?
No. It represents raster cells that end in a developed class in 2025 after having another class in the 1985 endpoint. It does not provide building footprints, permit dates, parcel acreage, or the exact year of change, and some mapped differences may reflect classification variation. Historical imagery and local records are needed for site-specific development history.
Sources and Reference Data
- MRLC Annual NLCD Data – official access point for annual land-cover and comparison products
- USGS Annual NLCD Land Cover Classification – definitions and guidance for forest, agriculture, wetlands, developed land, and related classes
- U.S. Census Bureau TIGER/Line Shapefiles – official county-boundary reference for Catoosa County
- Georgia DCA – Catoosa County, Fort Oglethorpe & Ringgold Comprehensive Plan – official local planning material covering transportation, land use, community character, and I-75 access
- Catoosa County Outdoor Activities – county information on South and West Chickamauga Creek access around Ringgold, Fort Oglethorpe, and Cloud Springs
- UGA Cooperative Extension – Catoosa County Agriculture & Natural Resources – local agriculture and natural-resource education and services
Map File Information
The ZIP contains four original JPG maps for comparing Catoosa County's 43.54% forest share, developed and agricultural land, the I-75-area hard-surface pattern, and 1985–2025 class differences.
- Included Files: Use only the versions confirmed in the article and supplied images
- File Type: Use the confirmed download contents
- Intended Use: Printing, education, presentations, and map-based projects
Related Maps
- Appling County Georgia Land Cover Map
- Atkinson County Georgia Land Cover Map
- Bacon County Georgia Land Cover Map
Green Map creates custom-edited map images using open geographic data sources such as geoBoundaries, Natural Earth, OpenStreetMap, and government open data.
These maps are edited visual materials, not raw data files, and are provided for education, documents, presentations, and graphic reference.