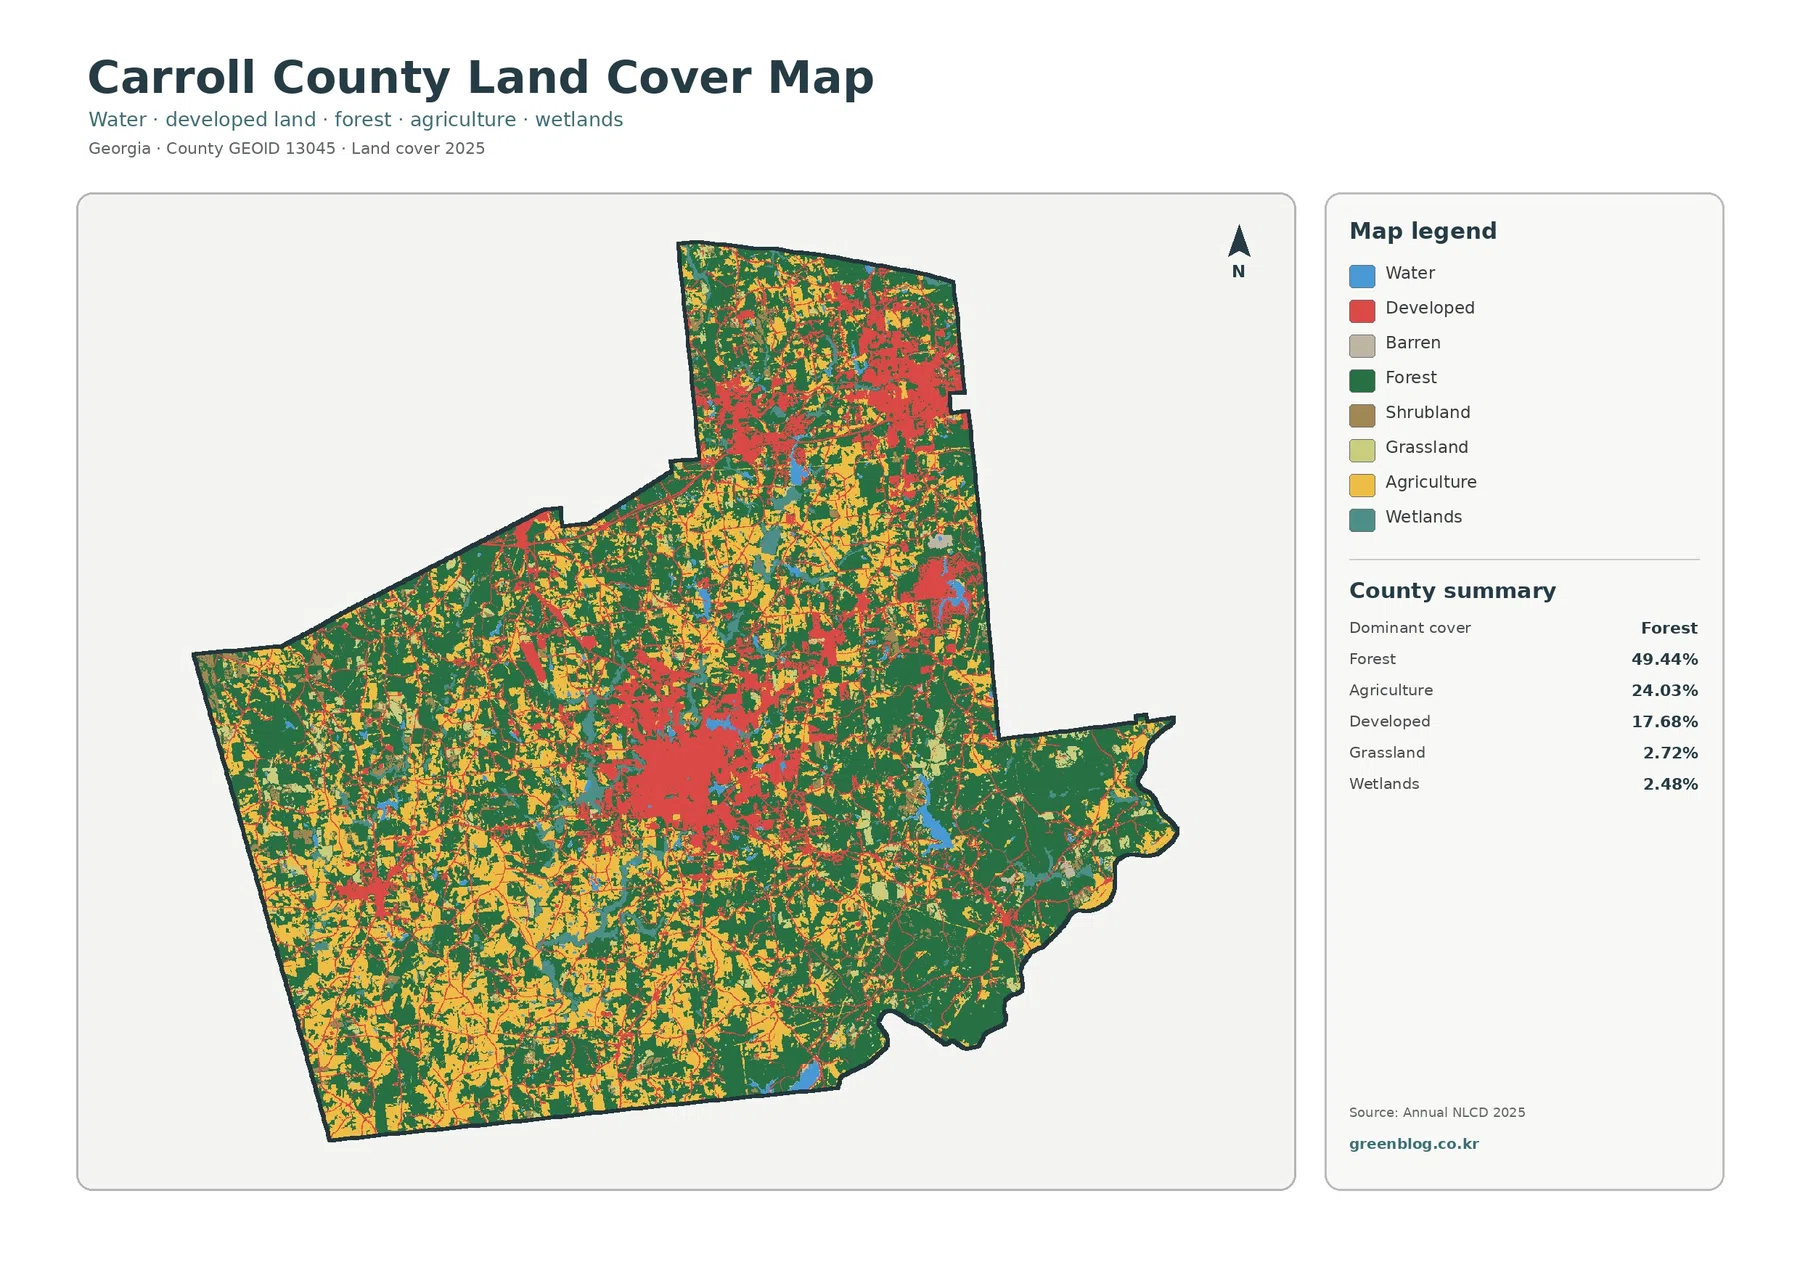
Carroll County sits in western Georgia, where the 2025 land-cover map shows a county that is still strongly forested but far from uniformly rural. Forest accounts for 49.44% of the mapped area, agriculture adds 24.03%, and developed land reaches 17.68%. The contrast is easy to see: broad green areas dominate much of the county, while large developed concentrations stand out near the center and in the northeast, with smaller built-up traces extending between and beyond them.
This page brings together four views of the same county: overall land cover, forest and farmland, impervious surface and developed land, and a 1985–2025 class-difference map. The WebP versions are placed in the article for quick viewing, while the four original JPG maps are provided together in one ZIP download. Reading the maps side by side helps separate questions about what covers the ground today from questions about paved surfaces or locations where the mapped class differs between 1985 and 2025.
Table of Contents
A county that is nearly half forest, with farms woven through the western side
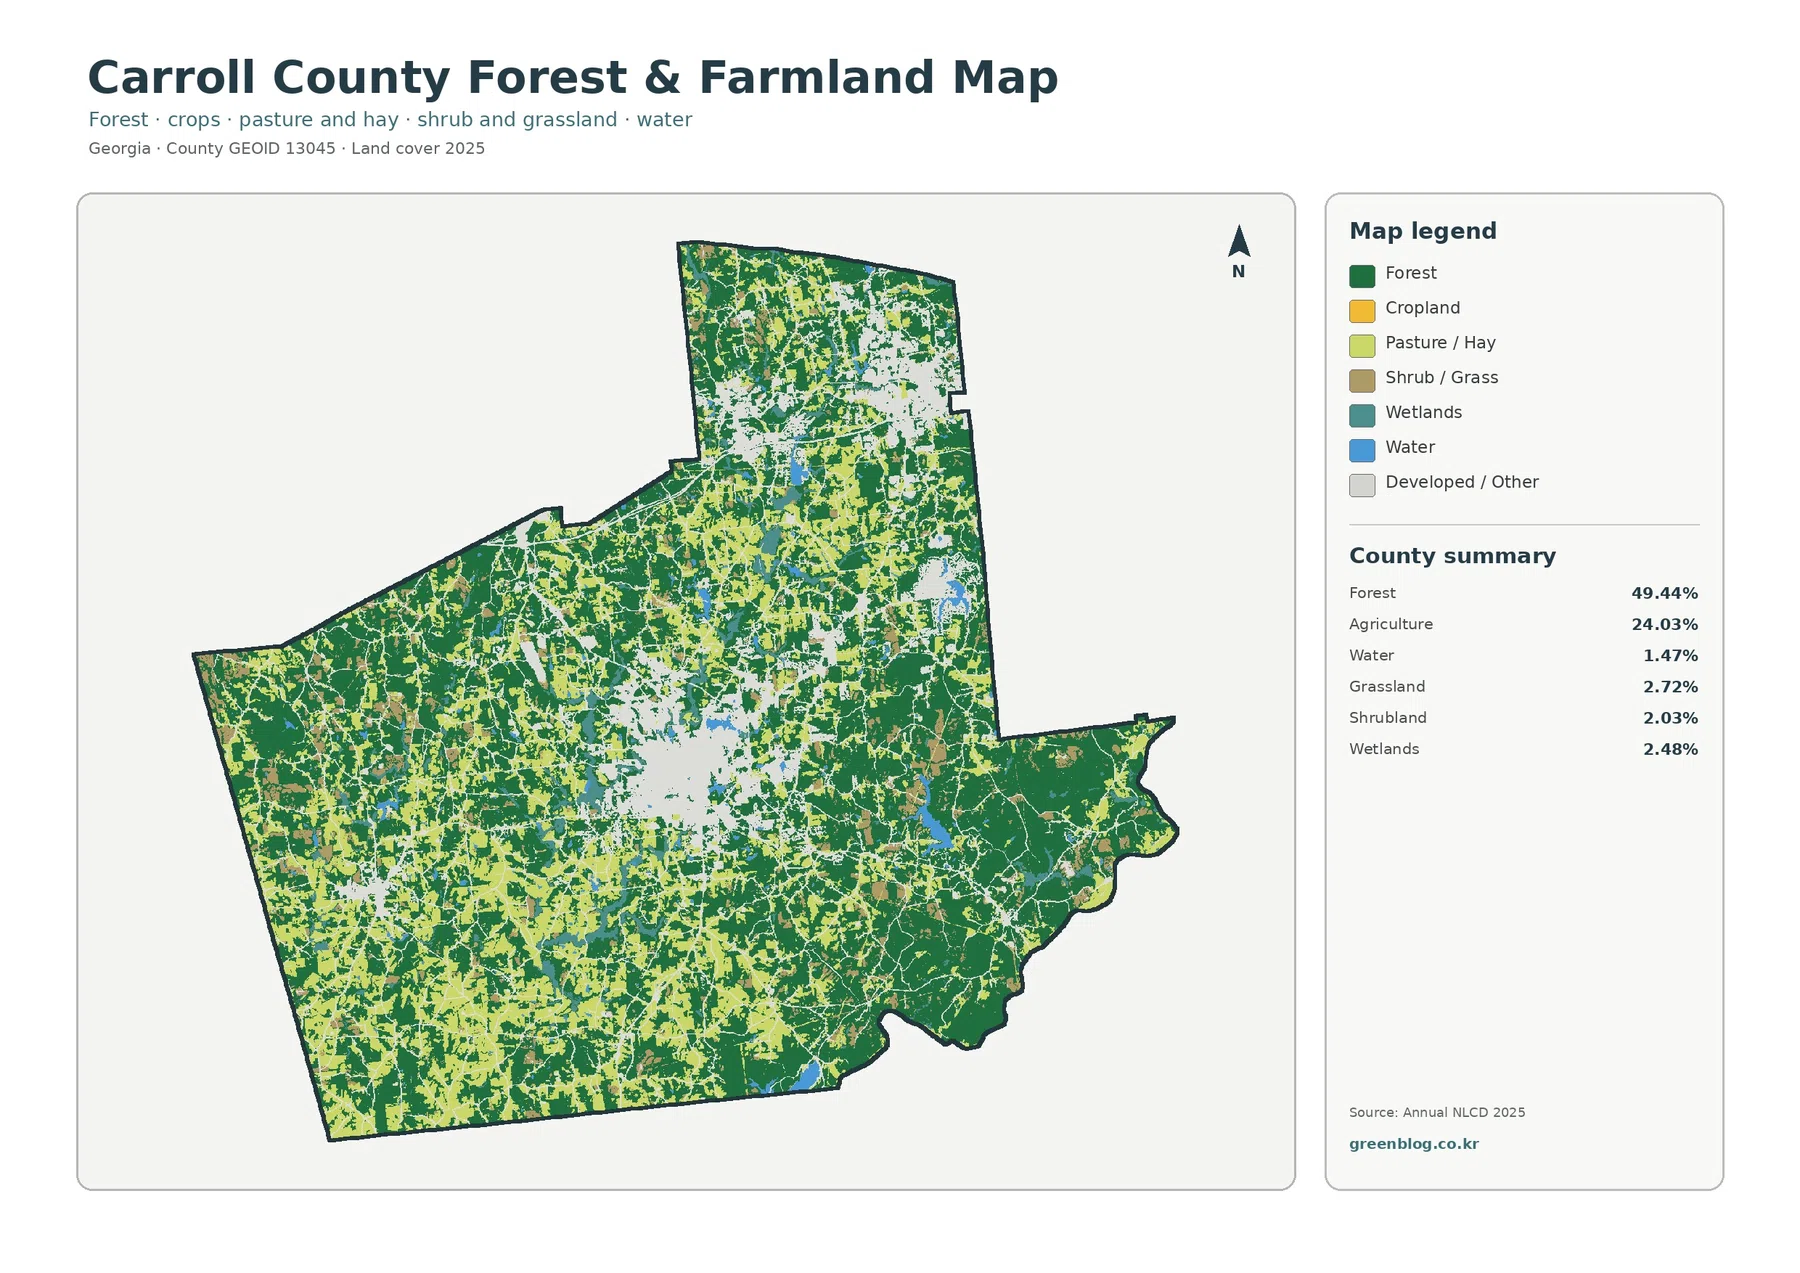
The overall 2025 map is led by forest at 49.44%. Large green areas are especially noticeable across the eastern and southeastern portions of Carroll County, but forest is not limited to one corner. It also breaks up agricultural blocks in the west and southwest and surrounds much of the developed center. Agriculture covers 24.03% of the county and appears as a patchwork rather than one continuous farming belt. Yellow agricultural areas are frequent on the western half, with smaller pieces mixed among forest and development elsewhere.
Developed land is the third major category at 17.68%. It forms a large concentration in the central part of the county and another strong cluster in the northeast. Smaller red areas and thin developed traces spread outward from those concentrations. Grassland accounts for 2.72%, wetlands 2.48%, shrubland 2.03%, and water 1.47%. Those smaller classes do not dominate the county total, yet they help explain why the boundaries between forest, agriculture, and development look irregular instead of forming clean blocks.
Impervious surfaces reveal where the built environment is most concentrated
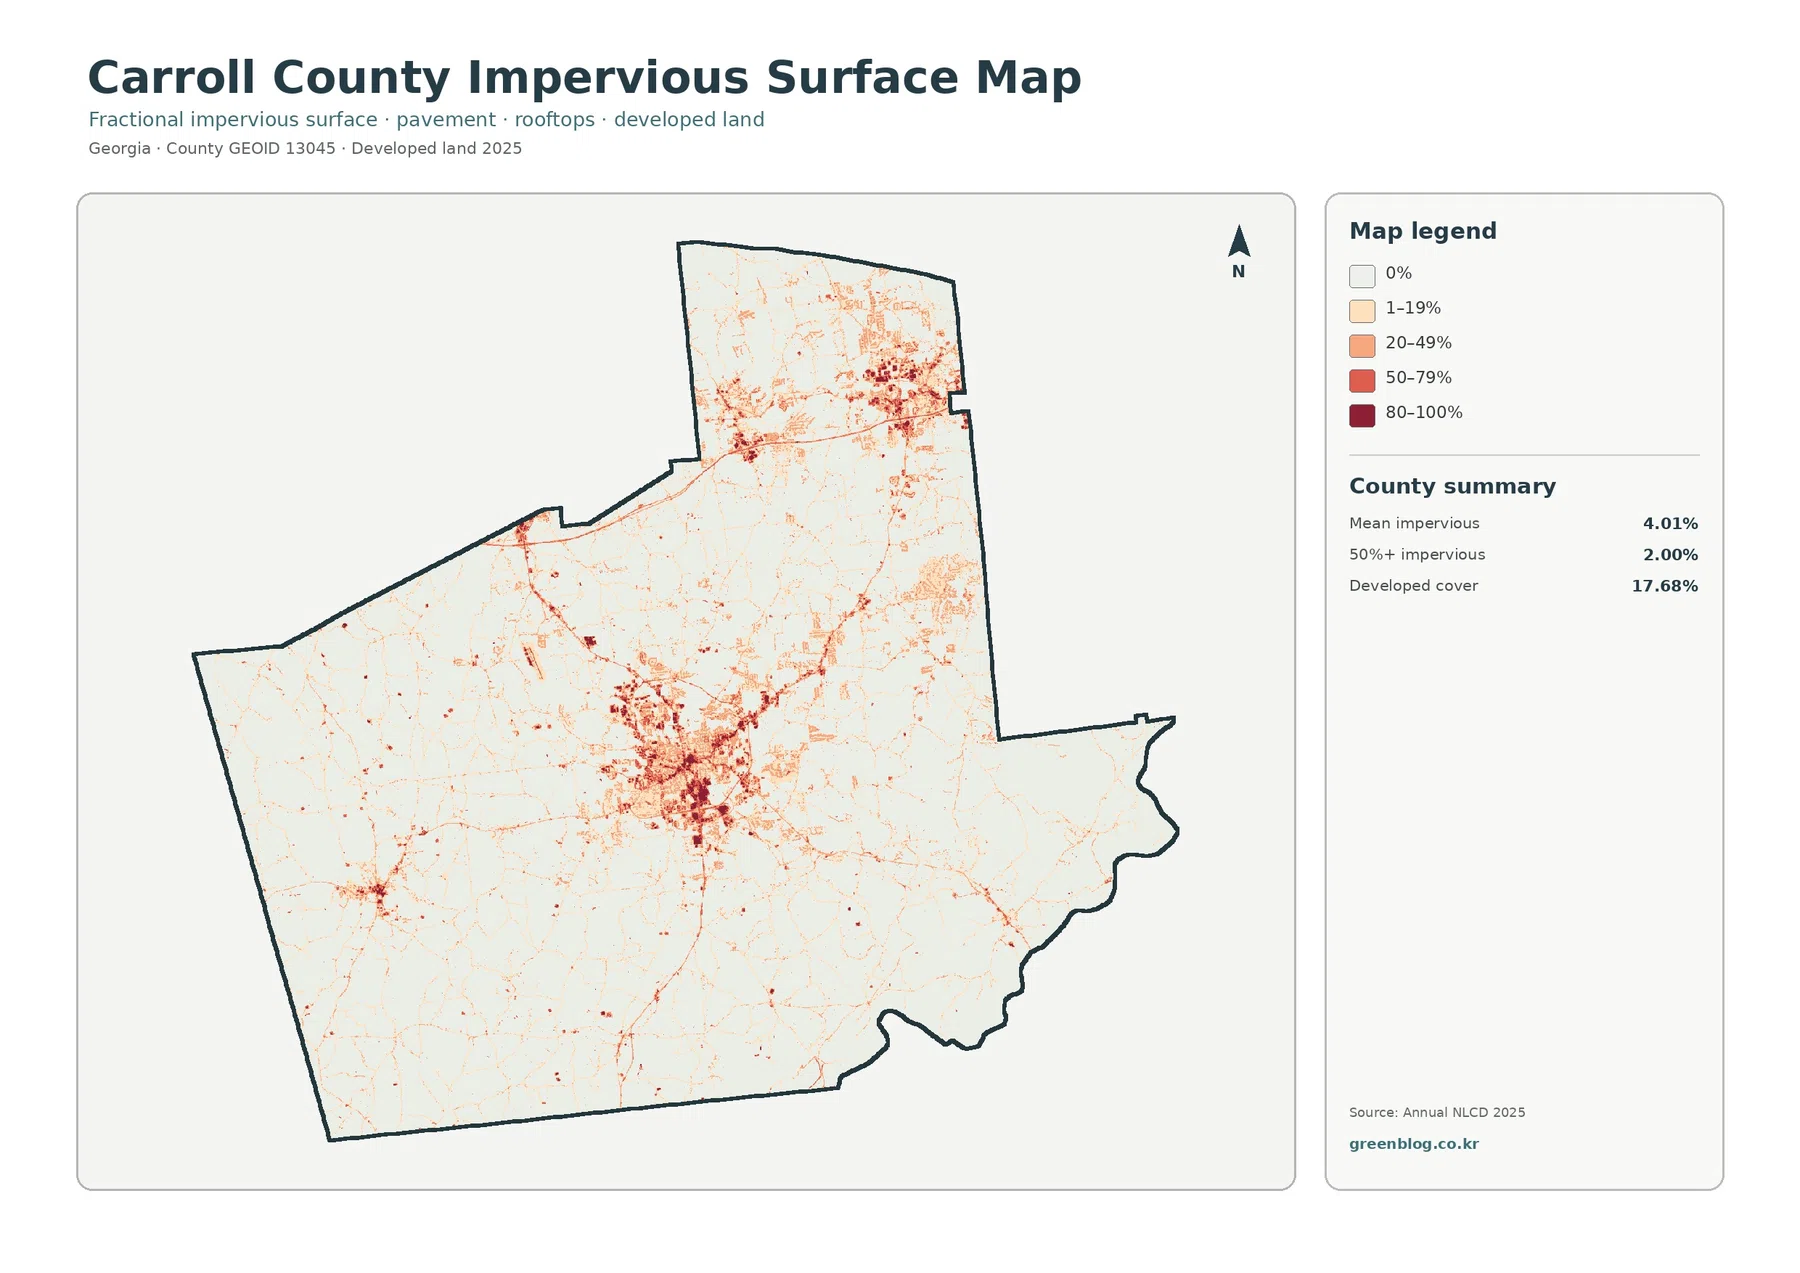
The impervious-surface map answers a narrower question than the general developed class. Impervious surfaces are hard areas such as pavement and rooftops where water does not readily soak into the ground. Carroll County’s mean impervious value is 4.01%, while 2.00% of the county is mapped at 50% impervious or higher. Those numbers are much lower than the 17.68% developed-cover figure because a developed landscape can still contain trees, lawns, bare soil, and other surfaces that allow water to infiltrate.
The forest-and-farmland view removes urban color to make the rural pattern easier to compare
When the goal is to compare wooded land with agricultural cover, the forest-and-farmland map is easier to read than the full legend. Forest remains the dominant class at 49.44%, while agriculture accounts for 24.03%. Agriculture is most visually persistent across the western and southwestern portions of the county, but forest repeatedly cuts between those fields. The result is a mosaic of wooded and open working landscapes rather than a simple east-versus-west divide.
UGA Cooperative Extension’s Carroll County Agriculture & Natural Resources program provides local resources for soil and water testing, forages, livestock, pond management, forestry contacts, and other agricultural needs. Its county impact material also describes a substantial local farm sector and a strong cattle presence. Those sources help explain why agriculture is an important part of the county landscape, but they should not be used to assign the NLCD agricultural pixels to specific crops, farms, or livestock operations. The map class records surface cover, not ownership or commodity production.
The 1985–2025 map marks class differences, not a complete history of every land-use decision
The change map compares the mapped class in 1985 with the class in 2025. A total of 29.15% of Carroll County is shown with a class difference. Within that summary, 6.54% is categorized as change to developed, 7.57% as forest loss, 1.90% as agricultural loss, and 12.99% as other class difference. White areas indicate no mapped class difference between the two endpoints, while the colored areas show the categories used for the comparison.
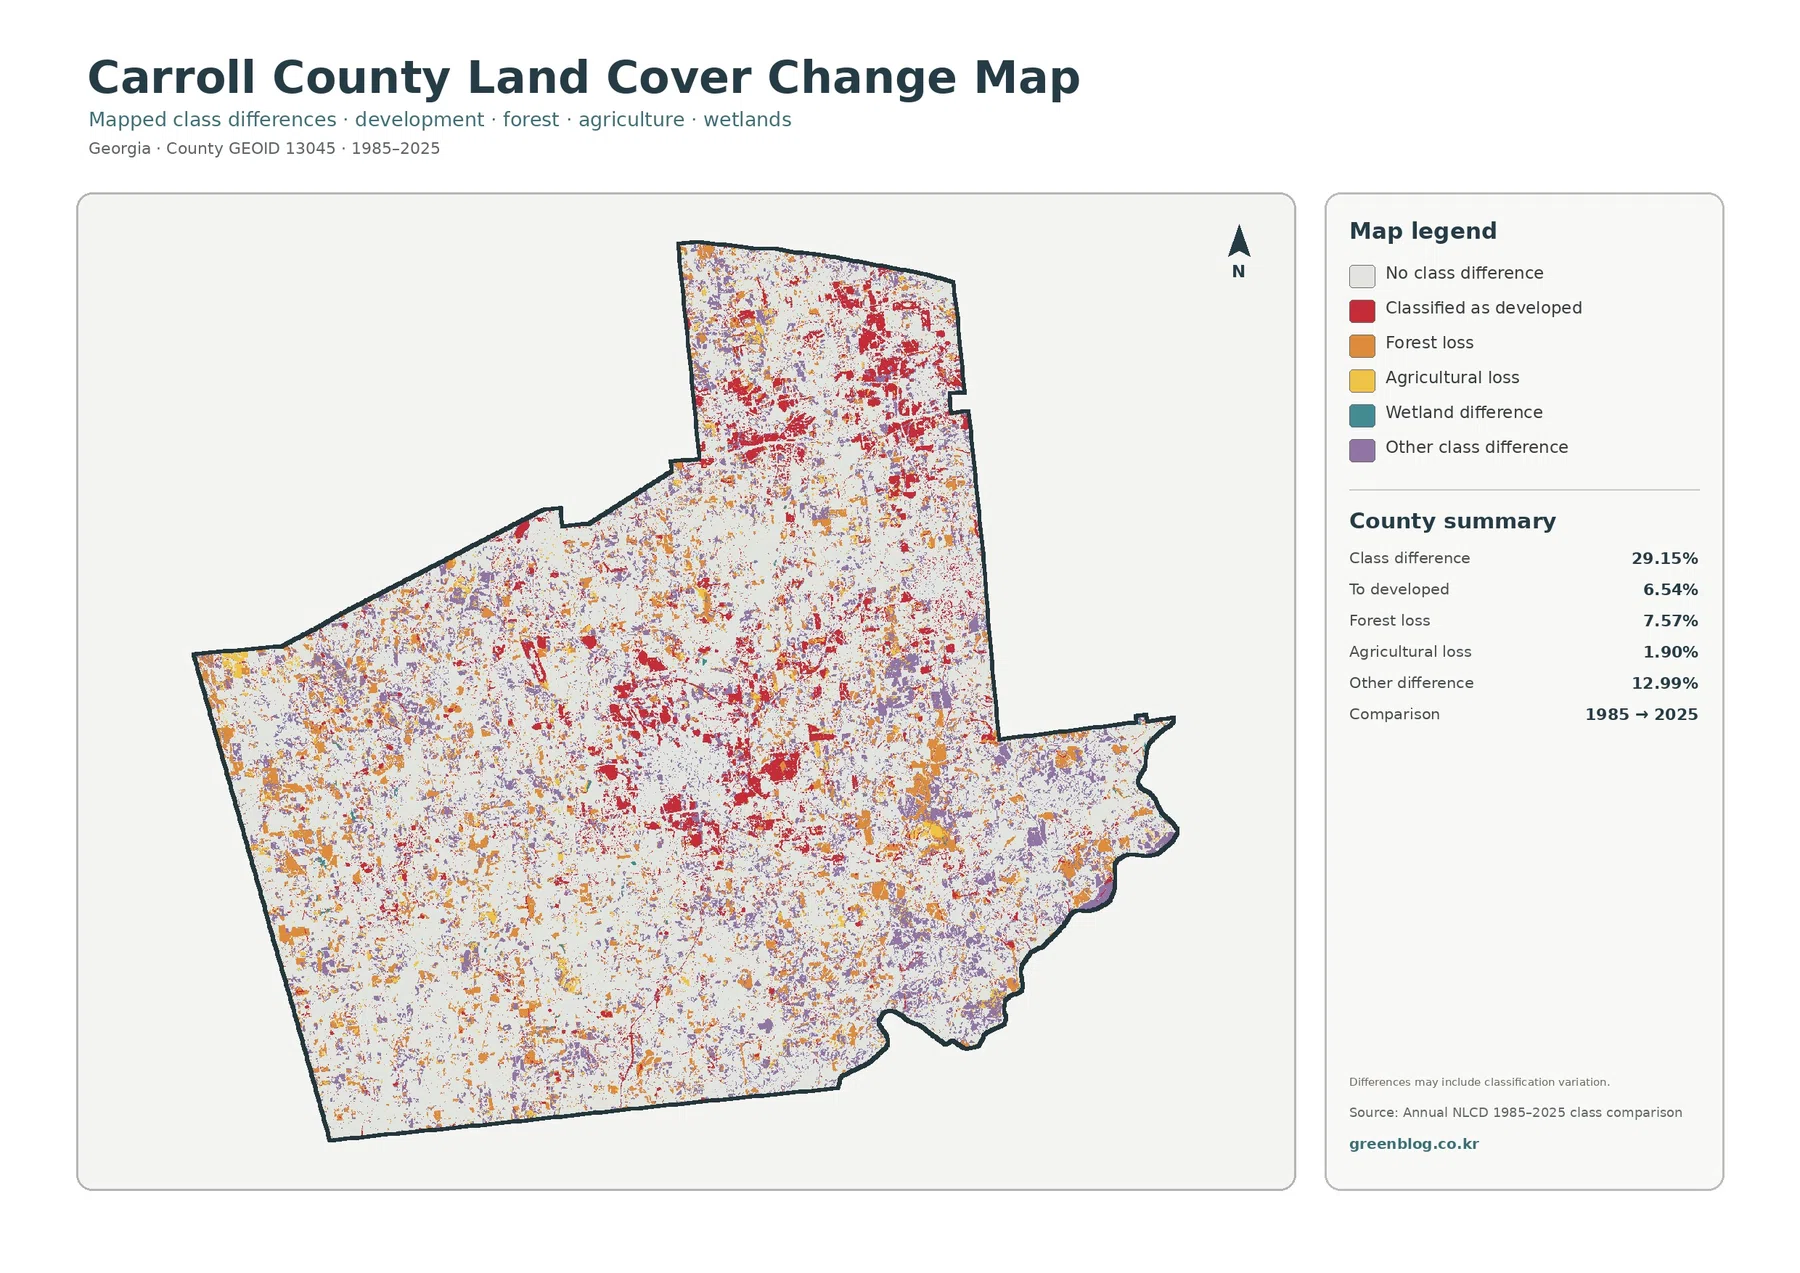
Red change-to-developed areas are especially visible around the northern and central developed concentrations, while forest-loss and other-difference colors are scattered more broadly. That distribution can guide a closer investigation of where the endpoints differ, but it cannot identify the cause from color alone. A forest cell that changes class may reflect clearing, agriculture, development, a transitional surface, or a classification difference. Confirming the reason requires dated aerial imagery, permits, local planning records, or other time-series evidence.
How the four maps can be used together
For a quick county overview, start with the general land-cover map because it places forest, agriculture, development, water, wetlands, shrubland, and grassland in one frame. Move to the forest-and-farmland version when the main question is how rural cover is distributed around the built-up areas. Use the impervious map when pavement, rooftops, or the concentration of hard surfaces matters. The change map is best saved for a separate question: where did the mapped class differ between 1985 and 2025?
Download the four original JPG maps and check resolution before large printing
The ZIP contains the original JPG versions of all four Carroll County maps: general land cover, forest and farmland, impervious/developed land, and 1985–2025 land-cover change. The asset manifest records each JPG at 2480×1754 pixels and does not mark the files as meeting the project’s A3 high-resolution reference. They are practical for on-screen viewing, documents, slides, and moderate-size printing, but anyone planning a large A3 print should first check whether the legend text and small map details remain sharp enough at the intended output size.
Why a 30-meter land-cover raster should not be treated as a parcel map
Annual NLCD is a Landsat-based 30-meter raster product. Raster mapping divides the ground into grid cells and assigns a representative class to each cell. A real 30-meter area can contain a forest edge, a driveway, a lawn, a crop field, and a small structure at the same time. The displayed boundary is therefore a generalized classification boundary rather than a surveyed line, and narrow features may be absorbed into the surrounding class.
Land cover is also different from zoning, ownership, legal land use, and development rights. A cell mapped as agriculture does not prove that the parcel is zoned exclusively for farming, and a developed cell does not define a city boundary or confirm that future construction is allowed. Parcel decisions should be checked against Carroll County records, current zoning, official flood or drainage information, recent aerial imagery, and field conditions as appropriate.
Frequently Asked Questions
Why does developed land cover 17.68% when the mean impervious value is only 4.01%?
The developed class includes more than pavement and rooftops. Developed areas can contain lawns, trees, soil, and other permeable surfaces, so a place can be classified as developed without being mostly impervious. The impervious map measures the hard-surface fraction more directly, which is why its countywide mean is much lower than the developed-cover percentage.
Does the 29.15% class difference mean that nearly a third of Carroll County was completely transformed?
No. It means that 29.15% of the mapped area received a different class in the 1985 and 2025 endpoint comparison. Some locations may represent real development, forest clearing, or agricultural transitions, while others can reflect mixed pixels or classification variation. A site-specific change claim needs additional time-series imagery or local records.
Map File Information
Download the four original JPG maps for Carroll County in one ZIP file. The archive includes general land cover, forest and farmland, impervious/developed land, and 1985–2025 land-cover change.
- Included Versions: Land cover / Forest & farmland / Impervious & developed land / Land-cover change
- Included Files: 4 JPG maps
Related Maps
- Appling County Georgia Land Cover Map
- Atkinson County Georgia Land Cover Map
- Bacon County Georgia Land Cover Map
Sources and References
- MRLC Annual NLCD Data – official Annual NLCD data access and product information
- USGS Annual NLCD Land Cover Classification – official description of land-cover classes and the 30-meter raster framework
- Georgia DCA – Carroll County Comprehensive Plan – county location, incorporated areas, and planning context
- UGA Extension – Carroll County Agriculture & Natural Resources – local agriculture, forestry, livestock, water, and natural-resource programs
Green Map creates custom-edited map images using open geographic data sources such as geoBoundaries, Natural Earth, OpenStreetMap, and government open data.
These maps are edited visual materials, not raw data files, and are provided for education, documents, presentations, and graphic reference.