The Barrow County Georgia Land Cover Map depicts a county where forest, developed land, and agriculture all occupy major shares. Forest leads the 2025 summary at 34.48%, but developed land is close behind at 32.67%, and agriculture still covers 26.62%. Wetlands make up 3.08%, grassland 1.43%, water 0.71%, and shrubland 0.43%. Large developed concentrations occur near the middle, west, northwest, and southeast, while wooded and agricultural areas remain interwoven around them.
Four map views are provided for different questions: the 2025 cover pattern, forest and farmland, impervious surface, and the 1985–2025 class comparison. The WebP previews support quick reading on the page, and the four original JPG files are packaged together in one download below. They are especially useful for distinguishing the broad developed class from actual hard-surface intensity and for comparing growth-related differences with the county’s remaining forest and farmland.
Table of Contents
Development is nearly as extensive as forest in the 2025 county summary
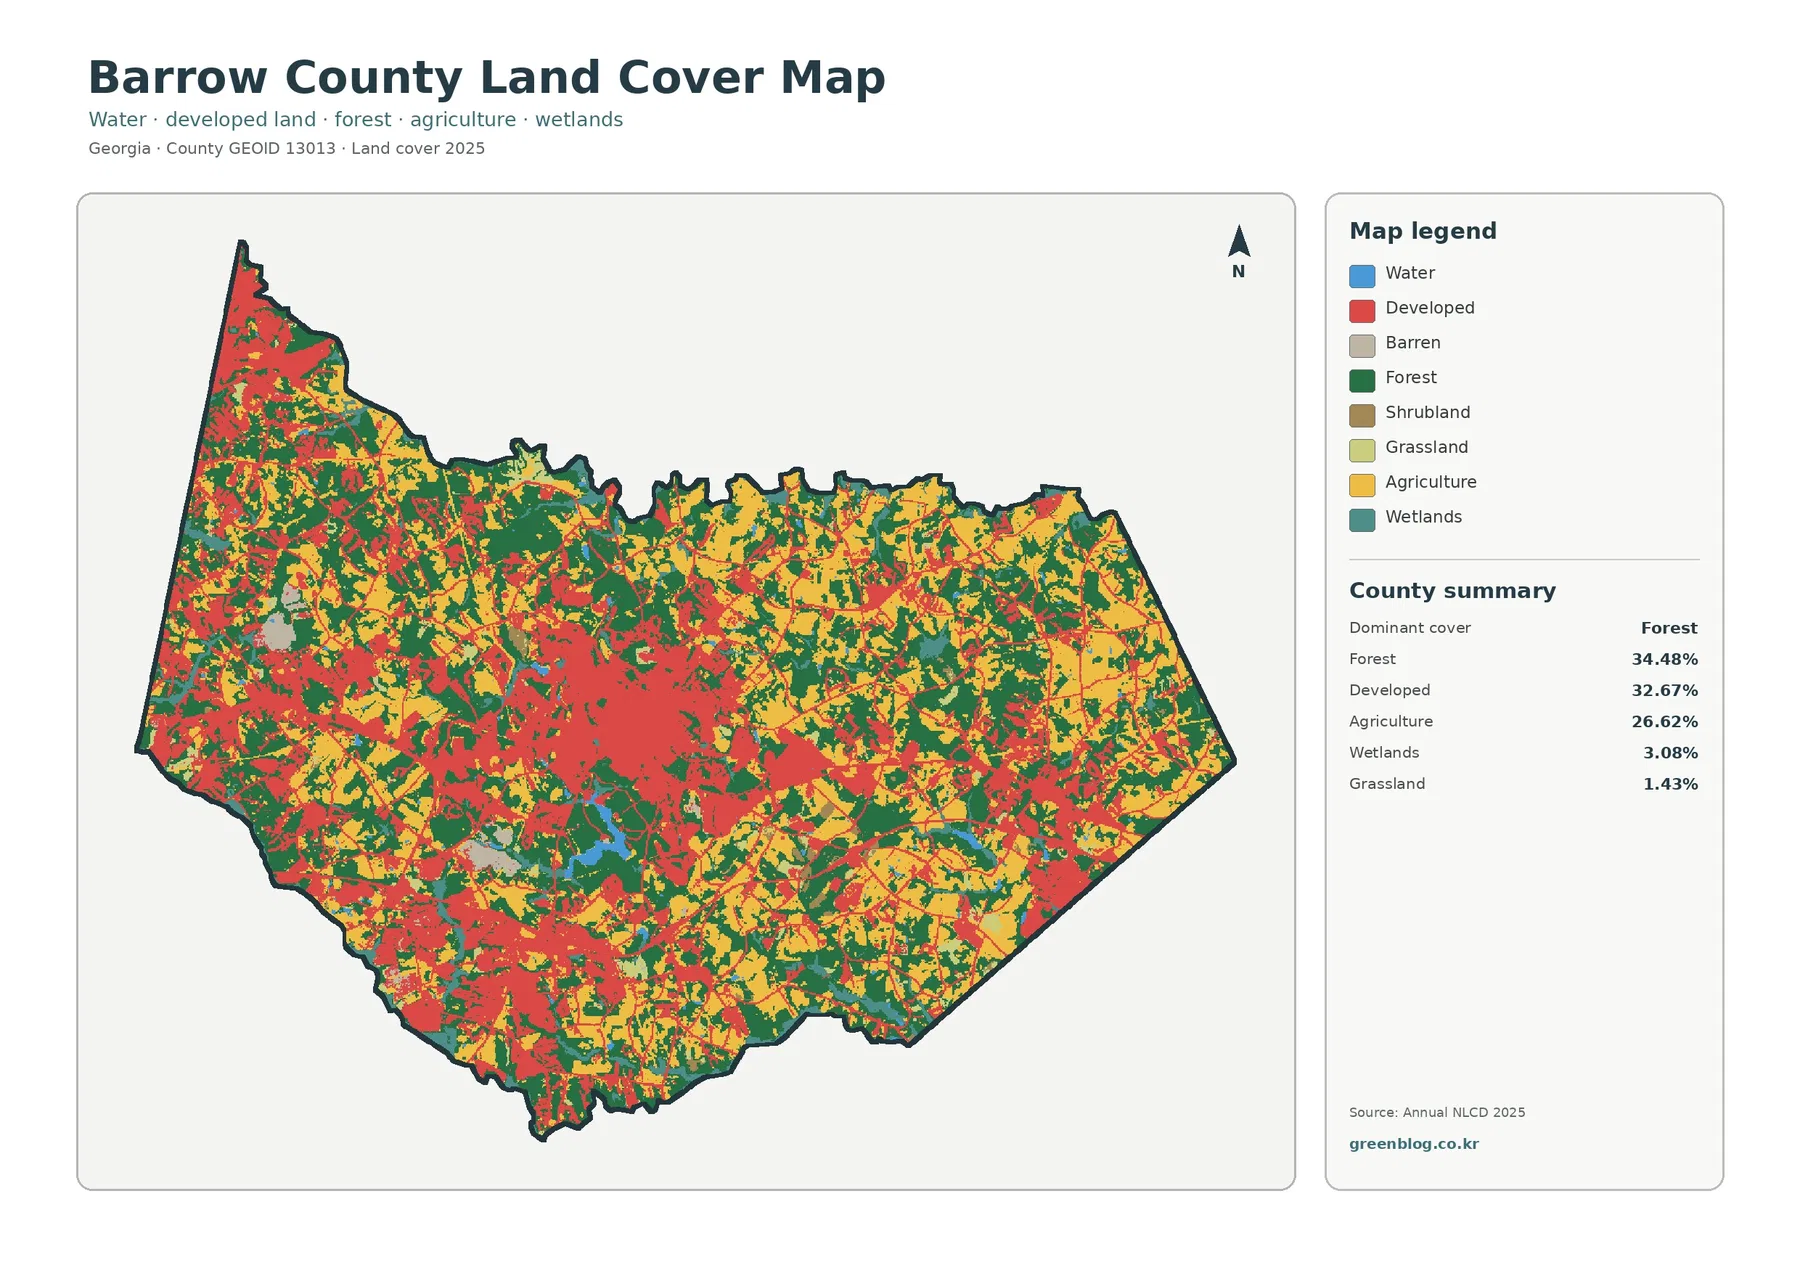
Dark-green forest is widespread around the northern, eastern, and southern edges and remains in substantial blocks through the west. It rarely forms an uninterrupted countywide tract. Red developed cells and yellow agricultural areas repeatedly cut through the wooded cover, giving Barrow County a much more fragmented appearance than a heavily forested rural county.
Developed land reaches 32.67%, only 1.81 percentage points below forest. The largest red concentration sits through the central portion of the county, with another substantial presence toward the west and northwest. Separate clusters and connecting traces extend toward the south and southeast. The pattern is broad enough that development cannot be described as a single compact town surrounded by countryside.
Official county information places Winder in the center of Barrow County, Auburn and Carl on the western side, Bethlehem to the south, Statham to the east, and Braselton on the northwest side. Georgia’s Department of Community Affairs also maintains planning resources for Barrow County and several of these municipalities. That geography gives useful context for the multiple developed concentrations, although raster land cover does not reproduce municipal boundaries.
Winder is the central urban reference, but developed cover extends well beyond it
Long-range planning documents describe the Winder area as central Barrow County and historically the heart of the county. The current land-cover image is consistent with a large central concentration of developed surface, yet red cover continues beyond that core along several directions. Smaller settlements, residential areas, commercial sites, and connecting infrastructure can all contribute to a developed classification without forming one continuous city.
This distinction matters because the developed class is not a municipal map. A low-density neighborhood may contain houses, lawns, mature trees, and undeveloped space within the same general area. Likewise, a commercial or industrial site can create a very intense patch of development beside farm or forest. The land-cover view is best used to compare surfaces, while legal boundaries and zoning belong to county and city planning records.
Farmland still occupies more than one quarter of a rapidly developed county
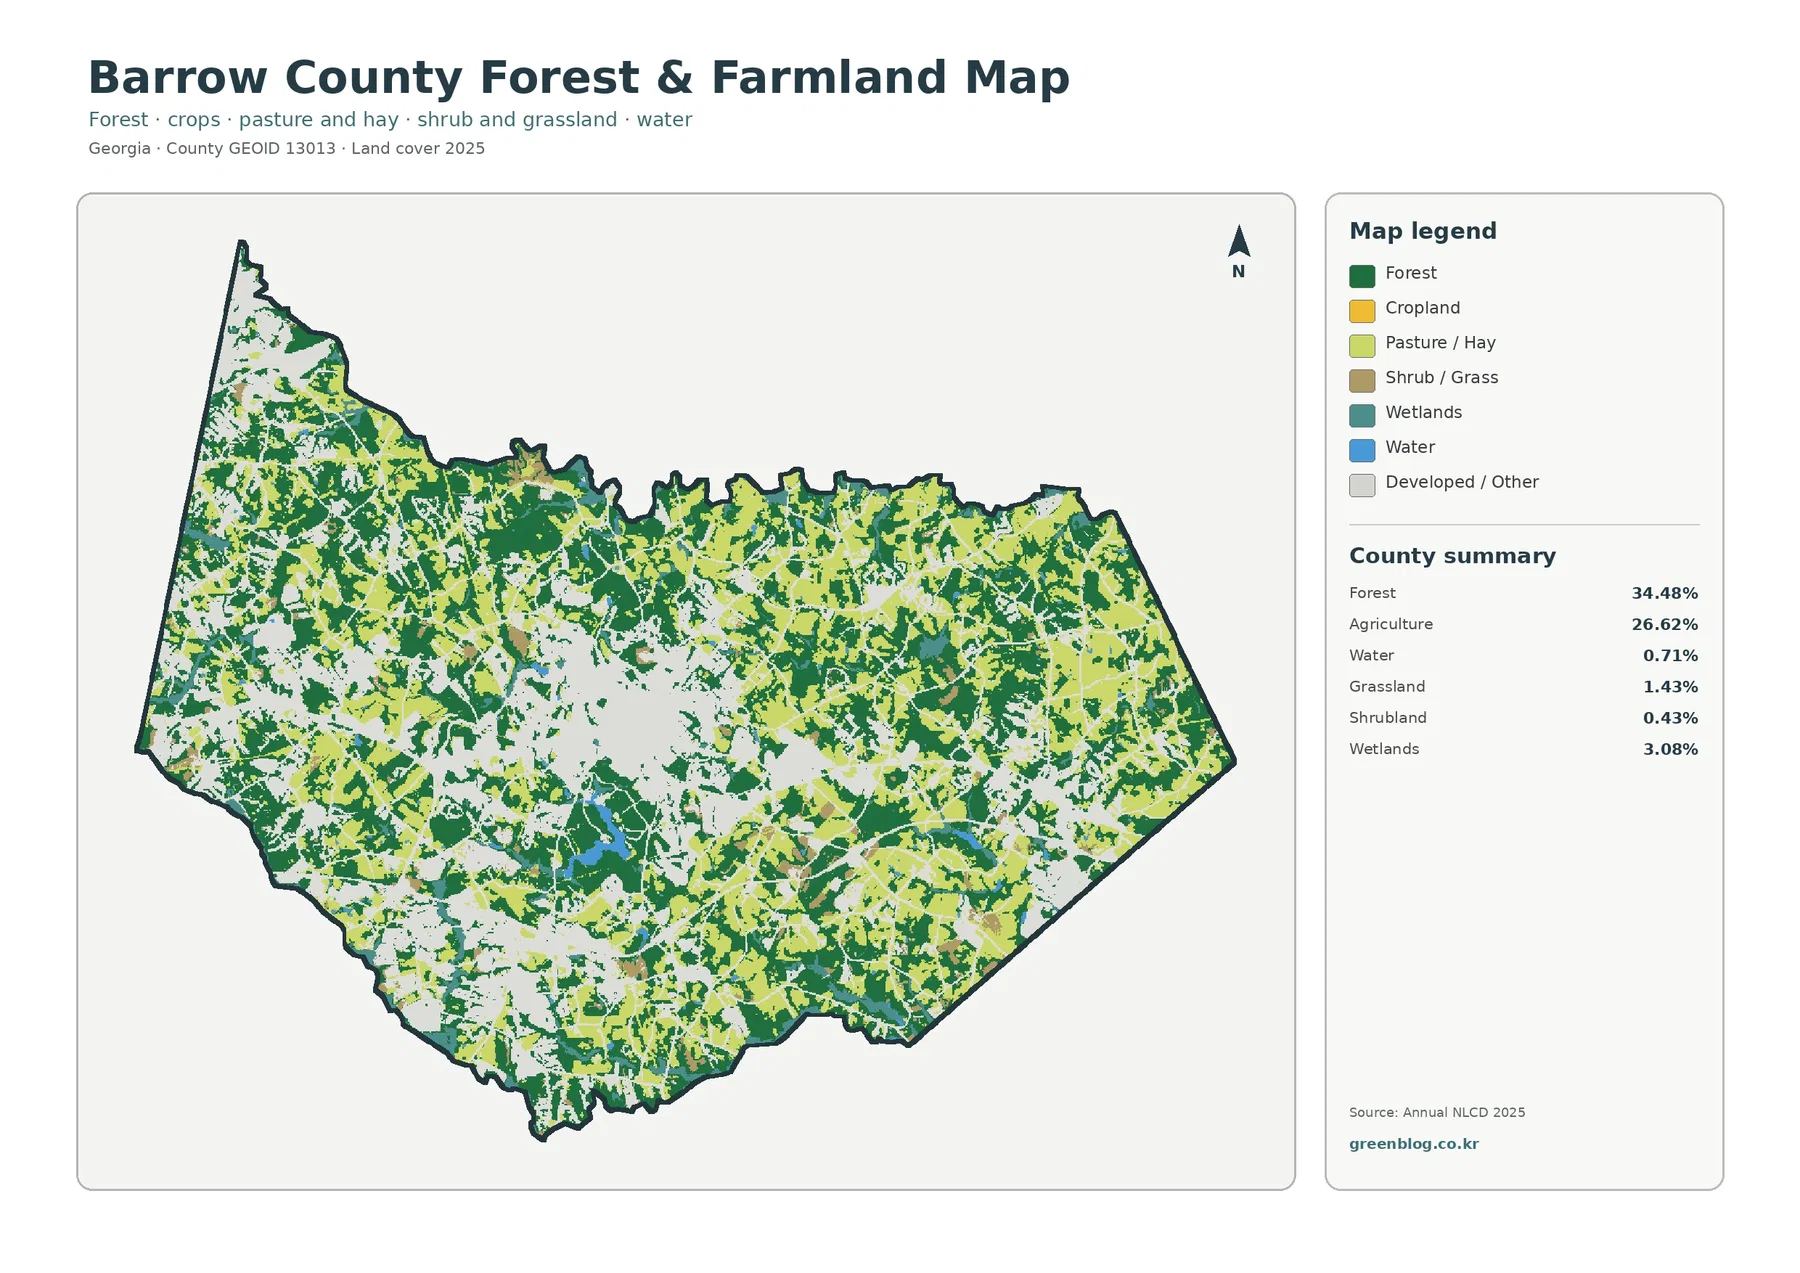
Agriculture accounts for 26.62%, making it a major part of the county even with the large developed footprint. Yellow cropland is visible through the north and east and remains important in the southeast and other outer areas. Smaller farm blocks also appear close to the central developed zone. Working land therefore survives not only at the far edge of Barrow County but in a patchwork with forest and settlement.
The UGA Extension Barrow County 2025 impact report lists a farm-gate value of about $28.2 million and identifies broilers, beef cattle, and horses as leading commodities. The office also reports soil, water, and forage testing and education on pasture and landscape management. Those county-specific facts provide useful agricultural context, but the land-cover image cannot identify a poultry operation, cattle pasture, or individual farm from color alone.
Forest and farmland meet along highly irregular boundaries. Large green blocks are divided by fields, while agricultural areas contain tree lines and small wooded pieces. Development adds another layer of fragmentation near Winder and other settlements. The map is therefore better for discussing how rural and developed surfaces are interspersed than for drawing precise field or ownership boundaries.
An 8.01% impervious mean reveals where the built landscape is actually hardest
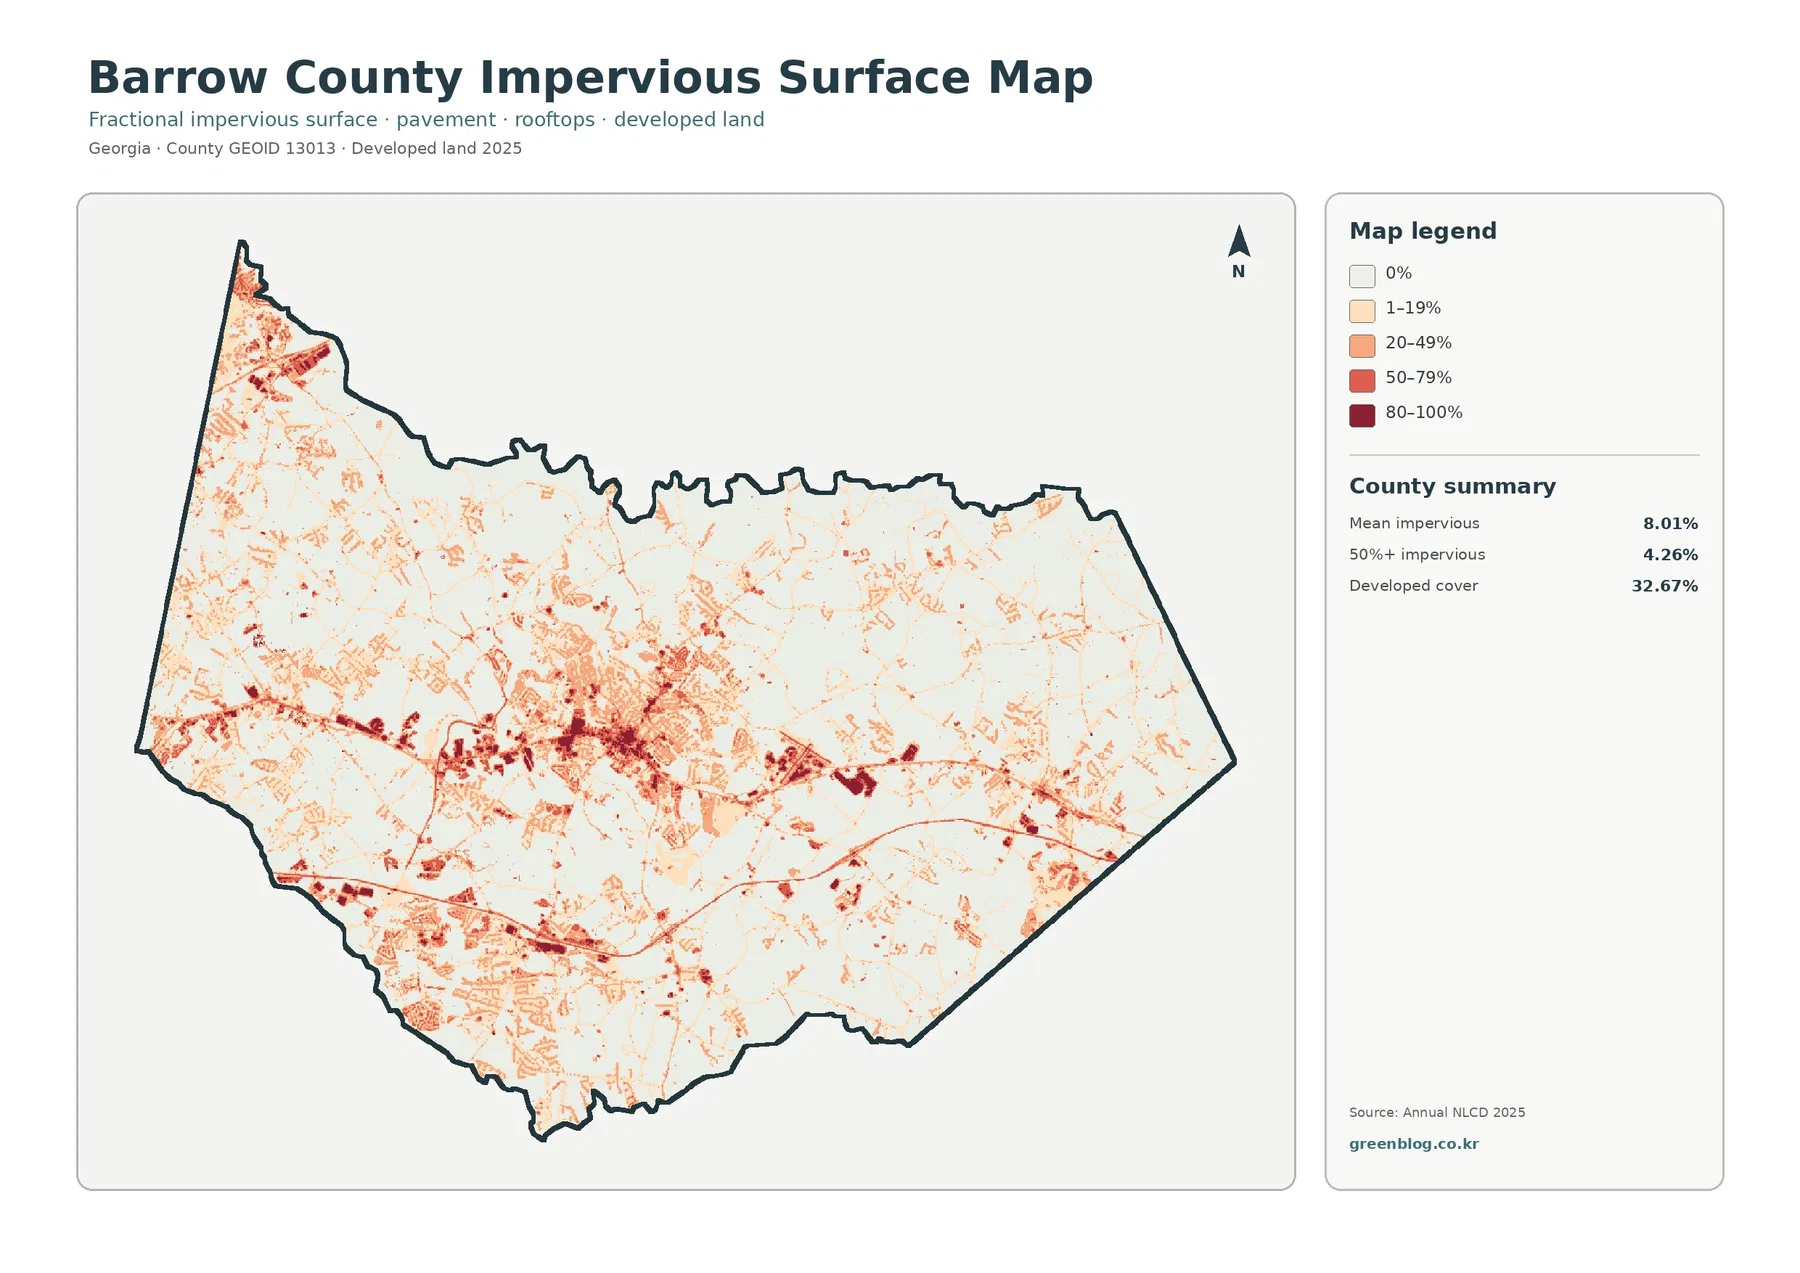
Impervious surface means rooftops, pavement, parking areas, and similar hard materials that do not readily absorb rainfall. Barrow County has a mean impervious value of 8.01%, while 4.26% of the county is mapped at 50% or greater impervious cover. These values are much lower than the 32.67% developed-land share because developed areas can contain lawns, trees, soil, and other permeable surfaces.
The darkest values are concentrated through the central urban area, with additional high-intensity patches in the west, northwest, south, and southeast. A long, strong concentration near the northwestern side is particularly visible. By contrast, many forest and agricultural areas remain pale. The result makes it possible to separate broad suburban or developed land from the smaller places where buildings and pavement dominate the surface.
Narrow red lines may coincide with roads, but the layer does not name routes or provide traffic volume, lane count, or road ownership. Impervious cover also should not be treated as a flood-risk score. Runoff depends on rainfall, slope, soils, drainage infrastructure, streams, and other local conditions in addition to the percentage of hard surface.
The two-date comparison is notable for a 19.85% developed-category difference
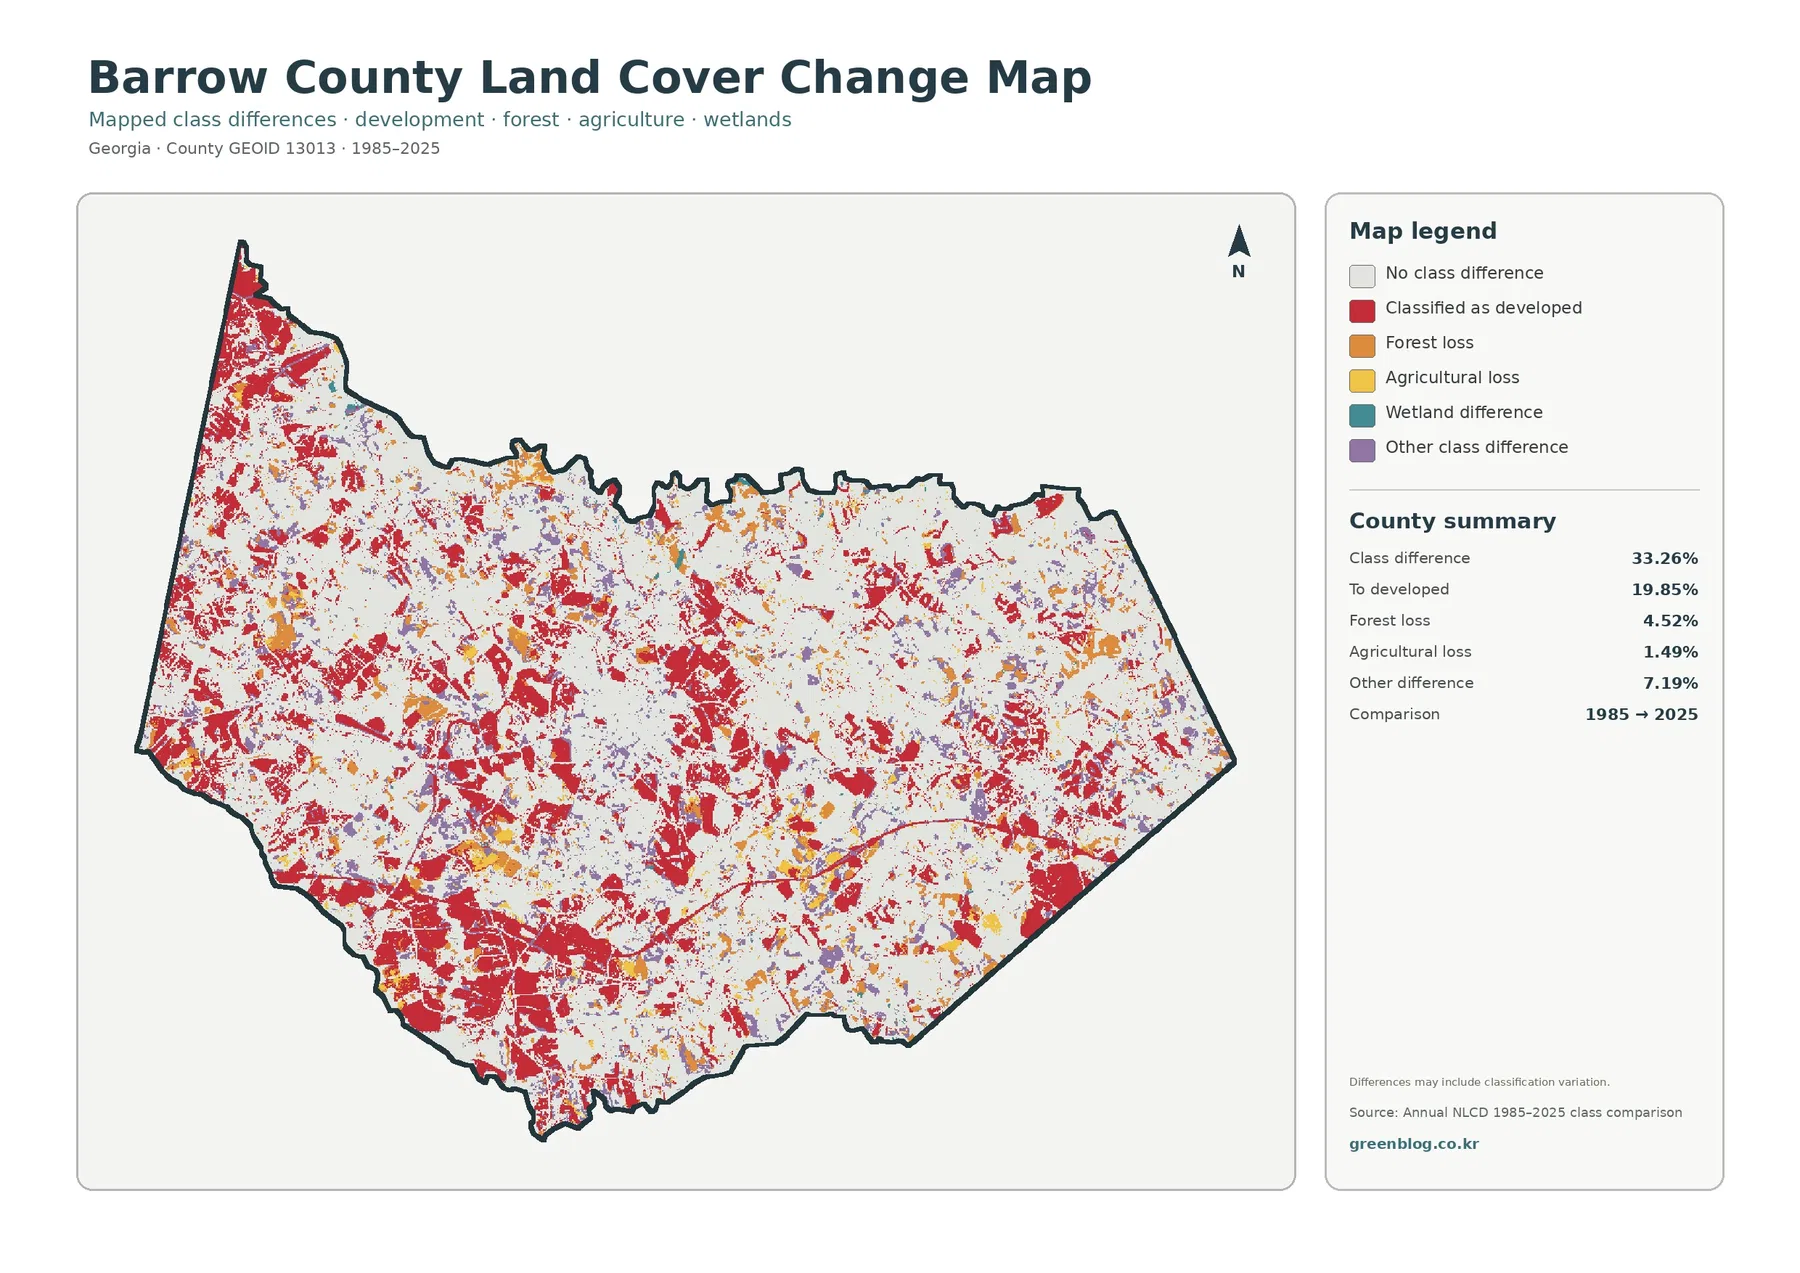
The total class difference between 1985 and 2025 is 33.26%. The largest supplied component is the 19.85% classified as developed. Red difference cells appear across the center, west, northwest, south, and southeast, broadly overlapping the parts of the county where present-day development is now most visible.
That 19.85% figure should not be labeled a simple development growth rate. The change layer compares the class assigned to each raster cell at two endpoints. Physical land conversion can be part of the result, but seasonal imagery, mixed cells, and classification methods may also produce differences. The current 32.67% developed share and the two-date developed category therefore cannot be added or subtracted to reconstruct a past county percentage.
Forest loss is 4.52%, agricultural loss 1.49%, and other class difference 7.19%. Wetland difference appears in the legend but no separate verified county percentage is supplied for it. Orange, yellow, teal, and purple cells are distributed among the much more extensive red developed differences, so any site-specific explanation needs intermediate imagery or local land-use records rather than color proximity alone.
Three development numbers describe different aspects of the same county
The 32.67% developed share describes land classified as developed in 2025. The 8.01% mean impervious value describes the average amount of hard surface, and the 19.85% developed-category difference belongs to the 1985–2025 comparison. They are related, but each answers a separate question about current extent, current intensity, or endpoint difference.
This is especially useful around the Winder-area concentration. The general map gives the impression of a large red developed footprint, while the impervious view narrows the darkest areas to places with more pavement and rooftops. The change map adds a third perspective by showing where endpoint classifications differ from 1985. Reading the three together avoids calling every developed cell dense urban land or every change cell newly built land.
For presentations, begin with the forest-development-farmland balance
The clearest opening for a county profile is the near three-way balance among forest, development, and agriculture. Forest at 34.48%, developed land at 32.67%, and agriculture at 26.62% explain far more about Barrow County than the smaller classes do. The overview map places that balance in one frame before a presentation moves to more specialized questions.
A rural-land discussion benefits from the forest-and-farmland view because developed areas recede visually. An urbanization discussion should move instead to impervious cover, where the difference between broad development and hard-surface concentration becomes obvious. The 1985–2025 comparison belongs later, after the reader understands that its colors are endpoint differences rather than the current landscape.
Land-cover cells should not be substituted for zoning or parcel records
Annual NLCD divides the landscape into raster cells and assigns a representative cover class to each one. A real location can contain a house, driveway, lawn, trees, soil, and a small stream within a short distance, while the map simplifies that mixture into a small number of classes. In a county as interwoven as Barrow, small boundaries between red, green, and yellow should be treated as generalized.
A land-cover class should never be treated as proof of ownership, zoning status, or development permission. An agricultural cell is not an agricultural zoning district, a forest cell is not automatically protected land, and a developed cell does not prove that a parcel has a specific permitted use. Barrow County Planning & Community Development and the official comprehensive plans are the appropriate references for legal land-use questions.
Each downloadable JPG is supplied at 2480×1754 pixels. Enlarging them can make smaller patterns easier to inspect, but it cannot add detail beyond the source data. The asset record does not mark the maps as meeting the package’s A3 high-resolution reference. They remain useful for screens, presentations, ordinary printing, and county comparisons, while very large output should be checked at the intended print size.
Frequently Asked Questions
What are the largest 2025 land-cover classes in Barrow County?
Forest is largest at 34.48%, followed closely by developed land at 32.67% and agriculture at 26.62%. Together those three classes account for most of the county. Their distribution is highly mixed, with developed concentrations surrounded by forest and farmland rather than separated into three simple zones.
Why is developed land 32.67% while mean impervious cover is 8.01%?
Developed land can include lawns, trees, soil, and other permeable surfaces around homes and businesses. Impervious cover measures the harder fraction such as roofs, pavement, and parking areas. The county area mapped at 50% or greater impervious cover is 4.26%, much smaller than the full developed class.
Does the 33.26% class difference equal the area that physically changed?
No. It is the share of cells whose 1985 and 2025 classifications do not match. Supplied components include 19.85% classified as developed, 4.52% forest loss, 1.49% agricultural loss, and 7.19% other difference. Because classification effects may be part of the result, explaining any particular site requires more evidence.
Sources and Reference Data
- MRLC Annual NLCD Data – source data for the 2025 cover and the two-date class comparison.
- USGS Annual NLCD Land Cover Classification – definitions for forest, developed, agricultural, wetland, and other cover classes.
- U.S. Census Bureau TIGER/Line Shapefiles – official county-boundary reference for Barrow County.
- UGA Extension Barrow County – Our Impact – current county-specific agriculture and natural-resources context.
- Georgia DCA – Barrow County Comprehensive Plan – official planning resources for the county and local municipalities.
- Barrow County Planning & Community Development – county zoning, planning, and development information.
Map File Information
The ZIP contains four original JPG maps covering Barrow County's current land cover, rural vegetation, hard surfaces, and 1985–2025 class differences.
- Included Files: Use only the versions confirmed in the article and supplied images
- File Type: Use the confirmed download contents
- Intended Use: Printing, education, presentations, and map-based projects
Related Maps
- Appling County Georgia Land Cover Map
- Atkinson County Georgia Land Cover Map
- Bacon County Georgia Land Cover Map
Green Map creates custom-edited map images using open geographic data sources such as geoBoundaries, Natural Earth, OpenStreetMap, and government open data.
These maps are edited visual materials, not raw data files, and are provided for education, documents, presentations, and graphic reference.