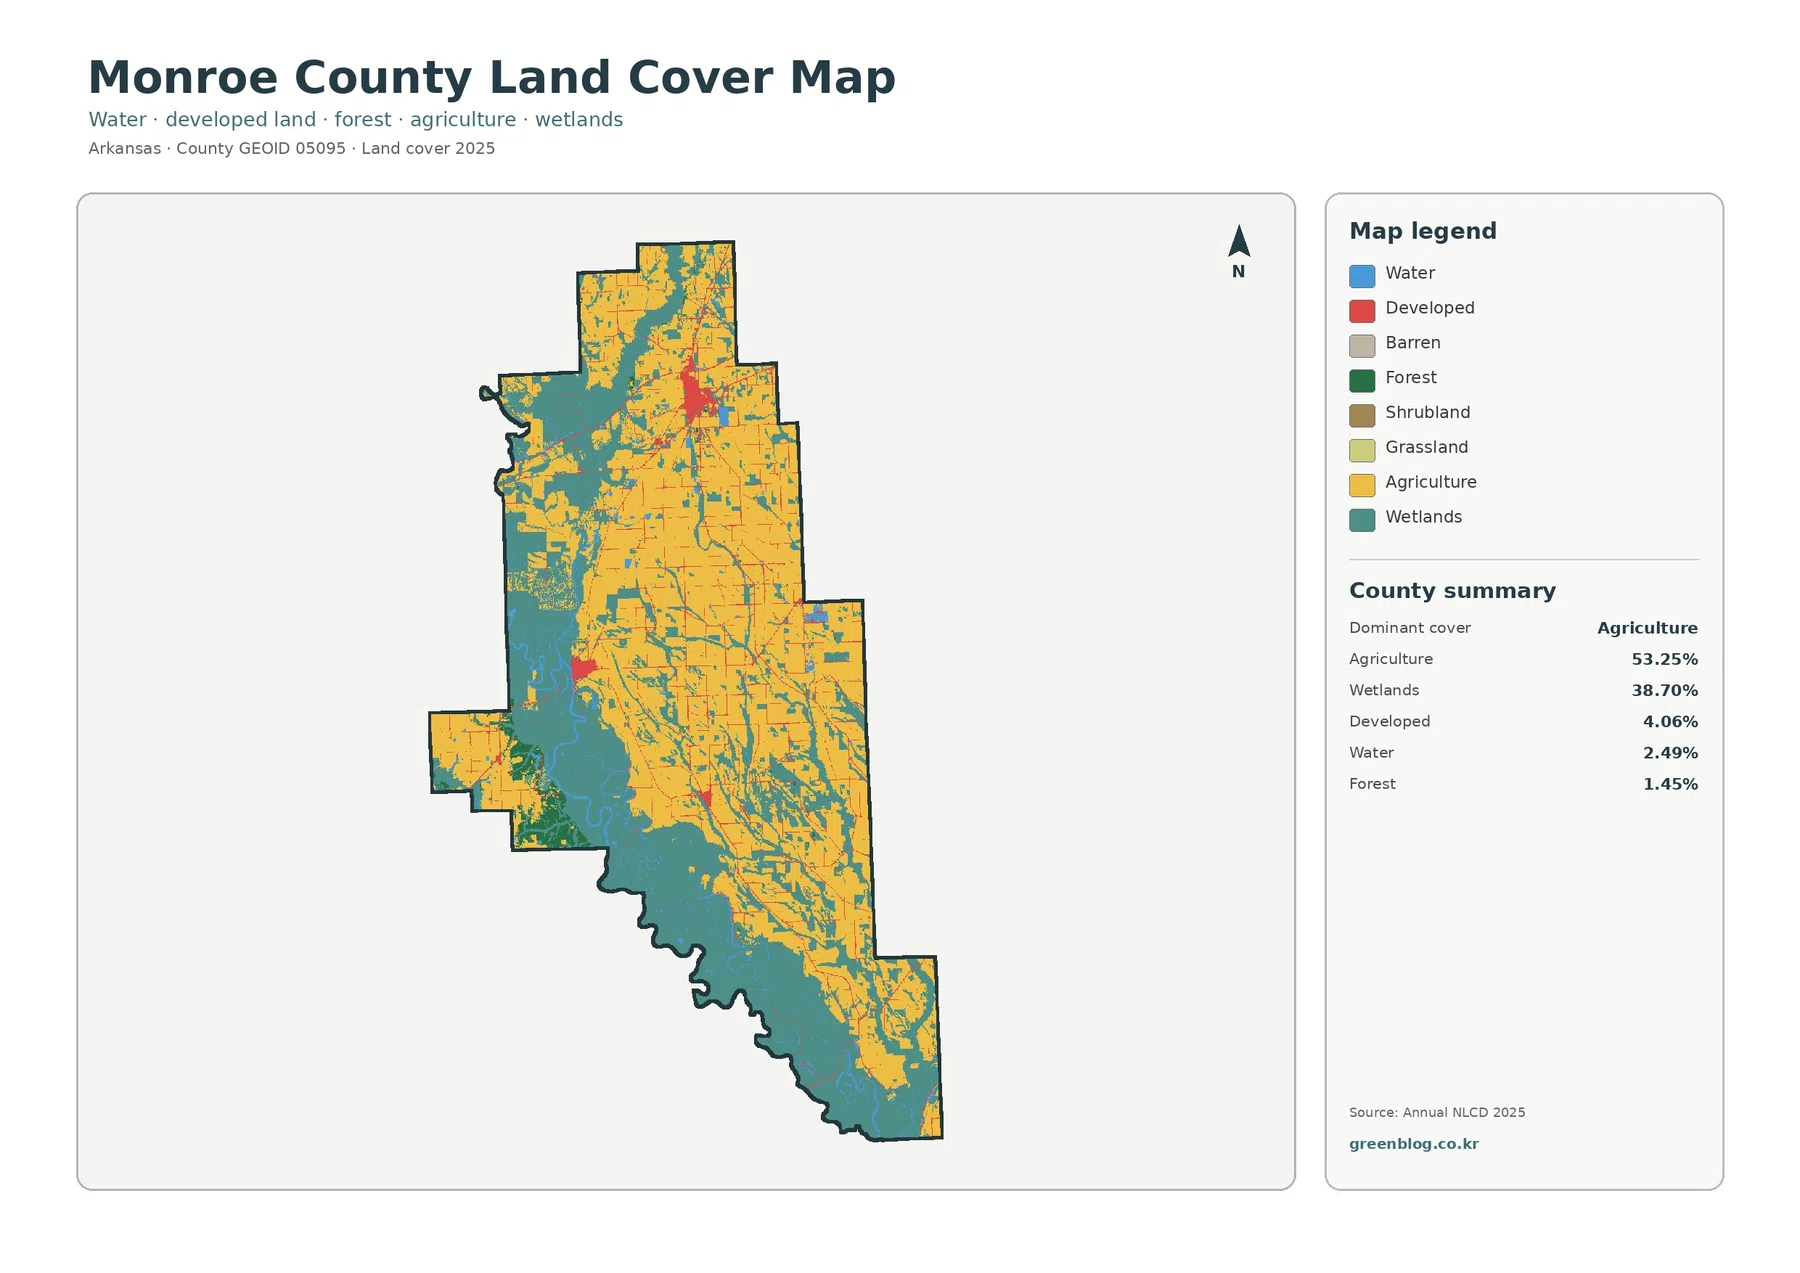
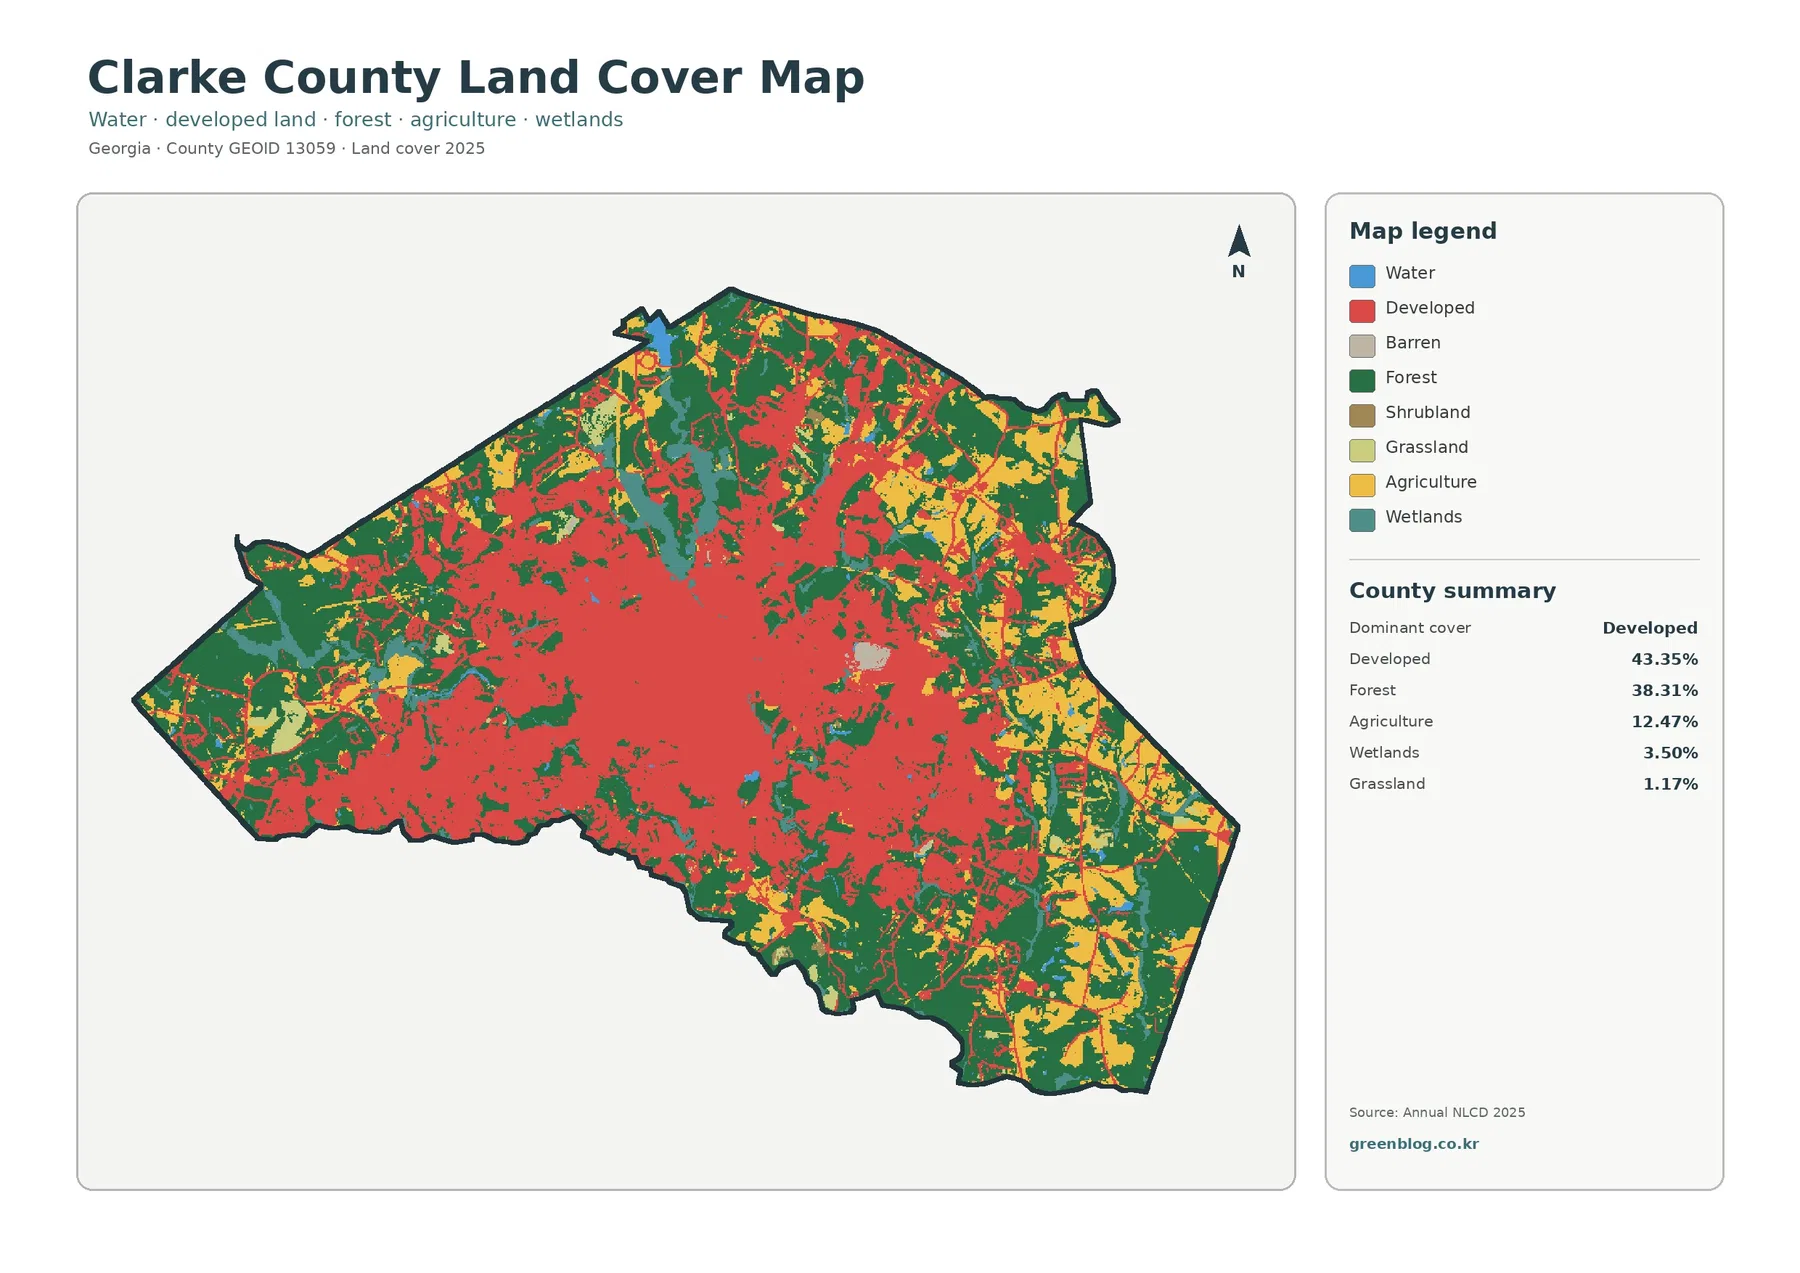
The Bartow County Georgia Land Cover Map is dominated by forest, but the county also contains two conspicuous developed concentrations and a large reservoir along the southeastern side. Forest represents 51.64% of the supplied 2025 summary, agriculture 20.82%, and developed land 18.89%. Grassland accounts for 3.25%, water 2.23%, shrubland 2.02%, and wetlands 0.45%. The eastern half reads as especially wooded, while the central Cartersville area and a northwestern cluster stand out in red.
The page pairs four views of Bartow County: current land cover, forest and farmland, impervious surface, and a 1985–2025 endpoint comparison. WebP previews are embedded for quick inspection, and the four original JPG maps are available together in one ZIP below. The set works well for separating the county’s broad forest cover from its built corridors, farmland, Allatoona Lake, and longer-term classification differences.
Table of Contents
More than half of Bartow County is forested in the 2025 summary
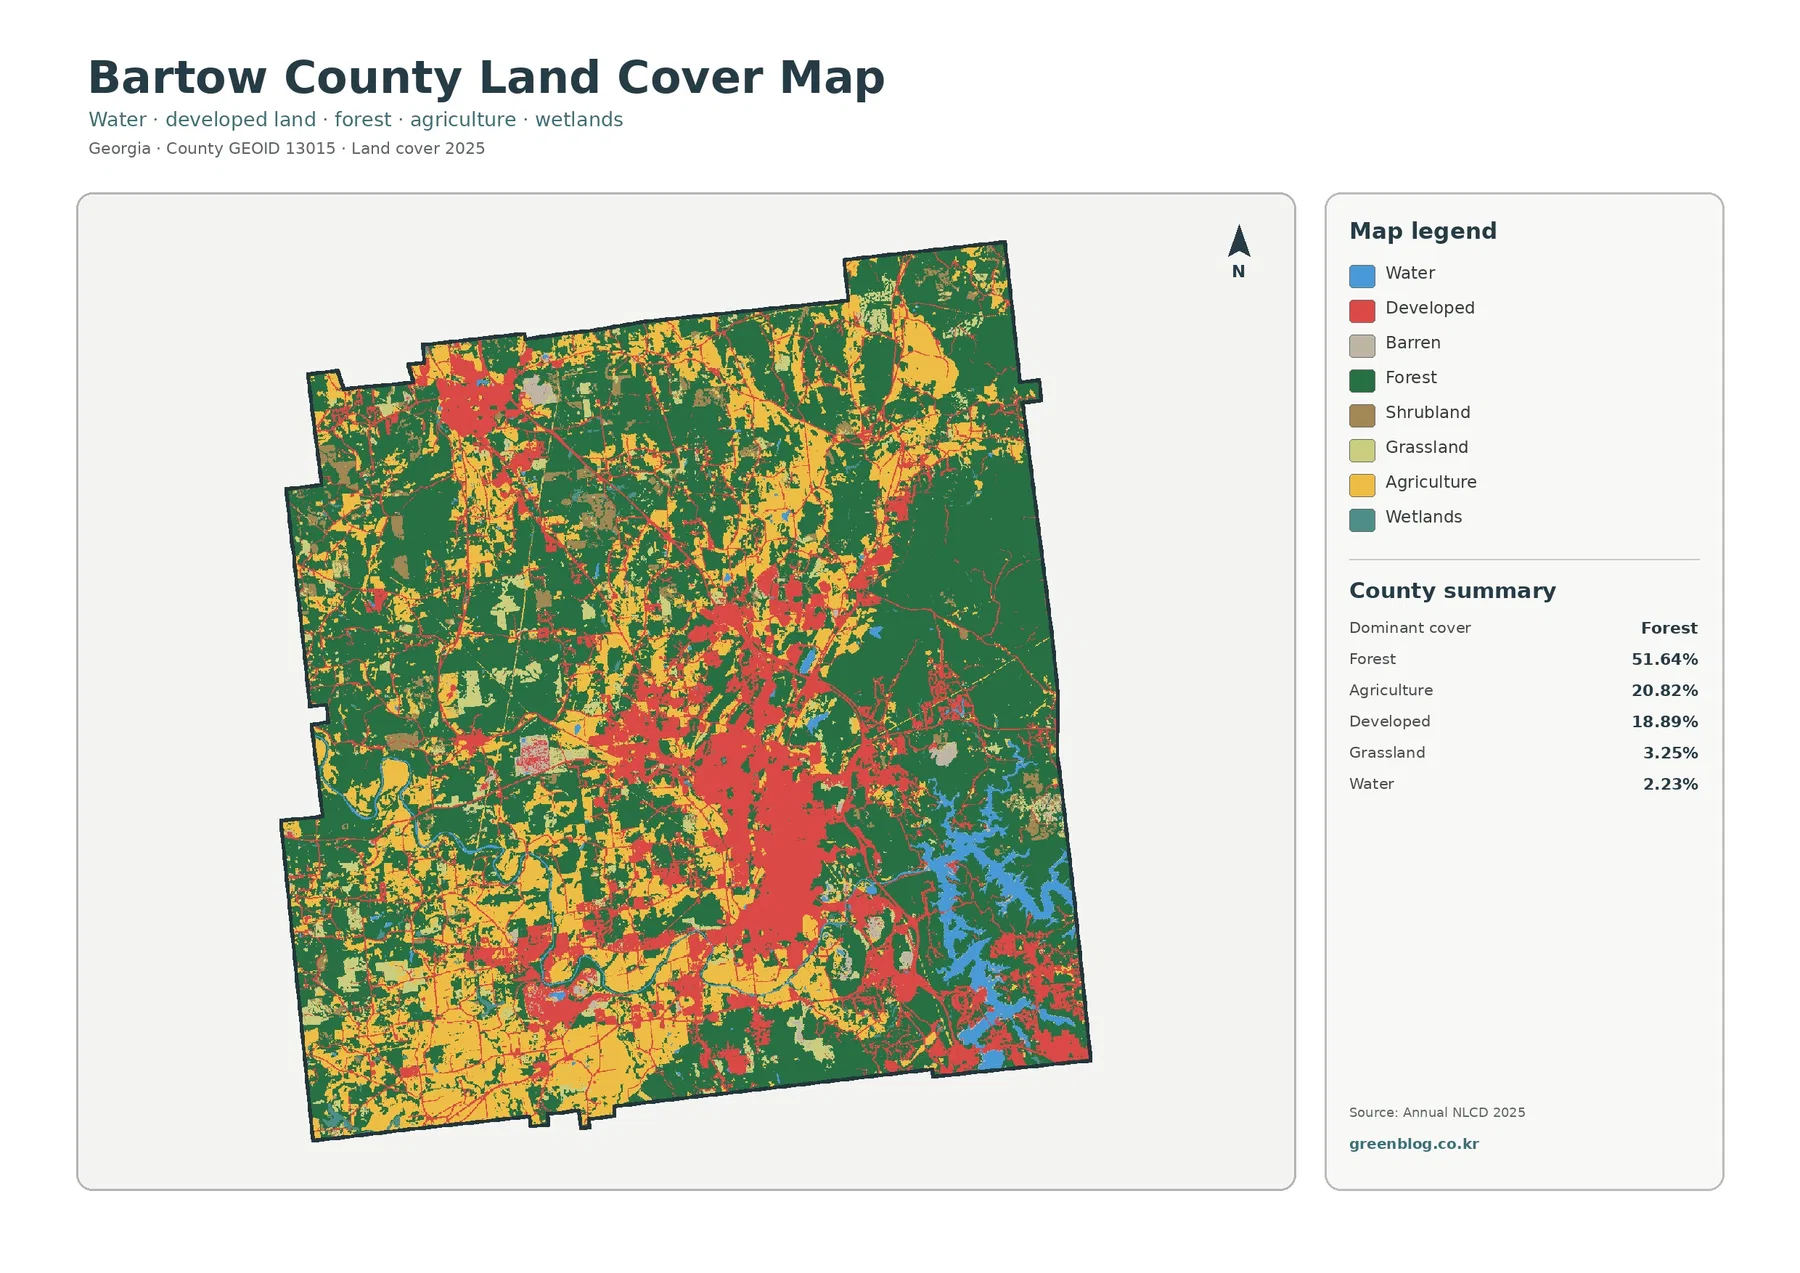
Dark-green forest forms broad areas across the east and remains extensive through the north and west. It also surrounds much of the central developed area, so the transition from city to wooded land is irregular rather than a clean edge. In the southwest, agricultural colors become much more frequent, yet woodland continues between farm blocks.
Agriculture is the second-largest class at 20.82%. Yellow cover is especially noticeable in the southwest and west, with additional farm areas across the north and center. Smaller agricultural blocks appear inside the more heavily forested eastern side as well. The pattern is dispersed enough that Bartow County cannot be divided into one simple farm half and one forest half.
Developed land covers 18.89%. The largest red concentration stretches through the central portion of the county, while another substantial cluster appears in the northwest. Smaller developed patches and thin traces are scattered elsewhere. Forest still leads by a wide margin, but development is large enough to shape the county’s visual pattern rather than appearing as a minor isolated class.
Cartersville is the main central reference, with other town areas visible farther away
Cartersville’s official planning page identifies the city as the Bartow County seat and places it about 45 miles northwest of Atlanta on Interstate 75. That makes the central developed concentration easier to understand as the county’s principal urban reference. The raster map does not draw the city boundary, however, so the full red area should not be labeled as Cartersville city limits.
The northwest contains another clearly separated developed concentration. Bartow County’s joint comprehensive plan covers Adairsville, Cartersville, Emerson, Euharlee, Kingston, Taylorsville, White, and the county government, confirming that several municipalities contribute to the county’s settlement pattern. Identifying the exact town represented by any individual red patch still requires a municipal or transportation map.
Narrow developed traces extend away from the central cluster and link smaller patches. Some are likely associated with transportation and settlement corridors, but land cover alone does not name roads or establish why development occurred in a particular direction. The strongest claim supported by this map is that developed surfaces and connecting hard-surface features are concentrated along several recurring paths.
Allatoona Lake explains the large blue shape on the southeastern side
The U.S. Army Corps of Engineers places Allatoona Lake on the Etowah River in Bartow County, about four miles east of Cartersville. That location matches the large, branching water shape in the southeastern part of the county map. The reservoir is therefore a useful geographic anchor when explaining why open water is visually prominent even though water represents only 2.23% of the county summary.
Wetlands are much smaller at 0.45%. Teal areas occur around some water edges and in a few inland locations, but they do not approach the extent of forest, agriculture, or developed land. Open water and wetlands should remain separate categories: a blue cell is mapped as water, while a wetland cell represents wet ground or wetland vegetation rather than simply a lake surface.
Allatoona Dam also provides useful local context. The Corps describes it as a multipurpose project on the Etowah River used for flood control, hydropower, water supply, and recreation. None of those operational details are encoded in the land-cover layer itself, so reservoir level, shoreline management, and dam operations belong to water-resource sources rather than to this map.
Fading developed areas makes the east-west forest and farmland contrast easier to follow
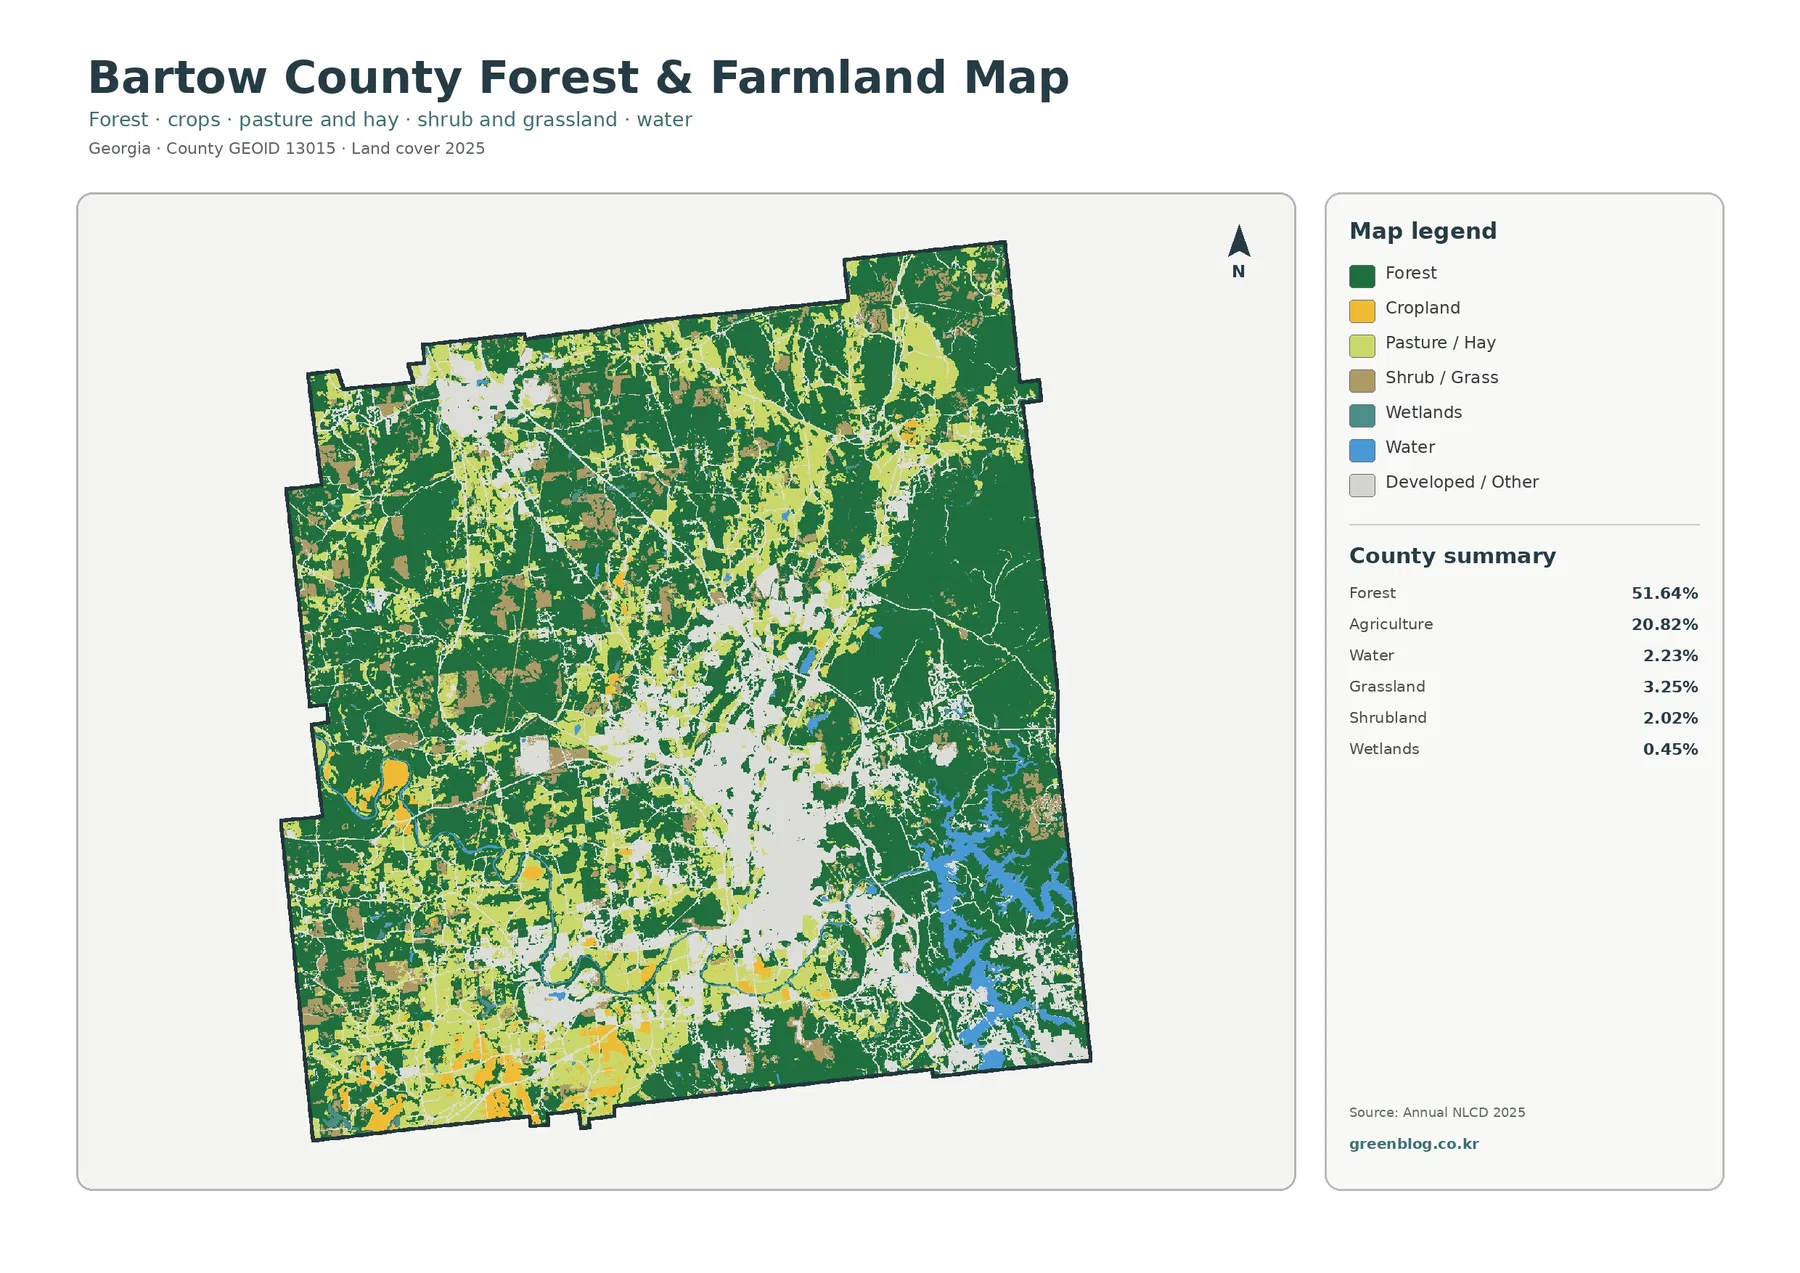
Once most development is faded to gray, the eastern forest becomes the dominant visual feature. Large dark-green areas occupy much of the east and north, whereas cropland and pasture or hay are more common in the southwest and west. The center remains mixed, with agricultural cover, forest, and faded developed areas interlocking at short distances.
The package provides a verified agriculture total of 20.82%, not separate percentages for cropland and pasture or hay. The legend lets a reader compare where those subtypes occur, but it does not support inventing exact subtype shares from colored pixels. Position and relative extent are the safer ways to use this view.
UGA Extension Bartow County maintains a broad Agriculture and Natural Resources program covering livestock, forages and pastures, field crops, fruits, forestry and wildlife, beekeeping, farm resources, and other topics. That local program reflects a county with a diverse rural land base. The map still cannot identify a particular crop, pasture owner, forestry operation, or management practice at the cell level.
Grassland contributes 3.25% and shrubland 2.02%. These classes appear between farms, forest, and developed areas and help explain why not every open surface belongs to agriculture. A raster cell receives one representative class even when the ground contains a mixture of grasses, shrubs, trees, driveways, or small structures.
Impervious cover narrows the broad developed class to its hardest surfaces
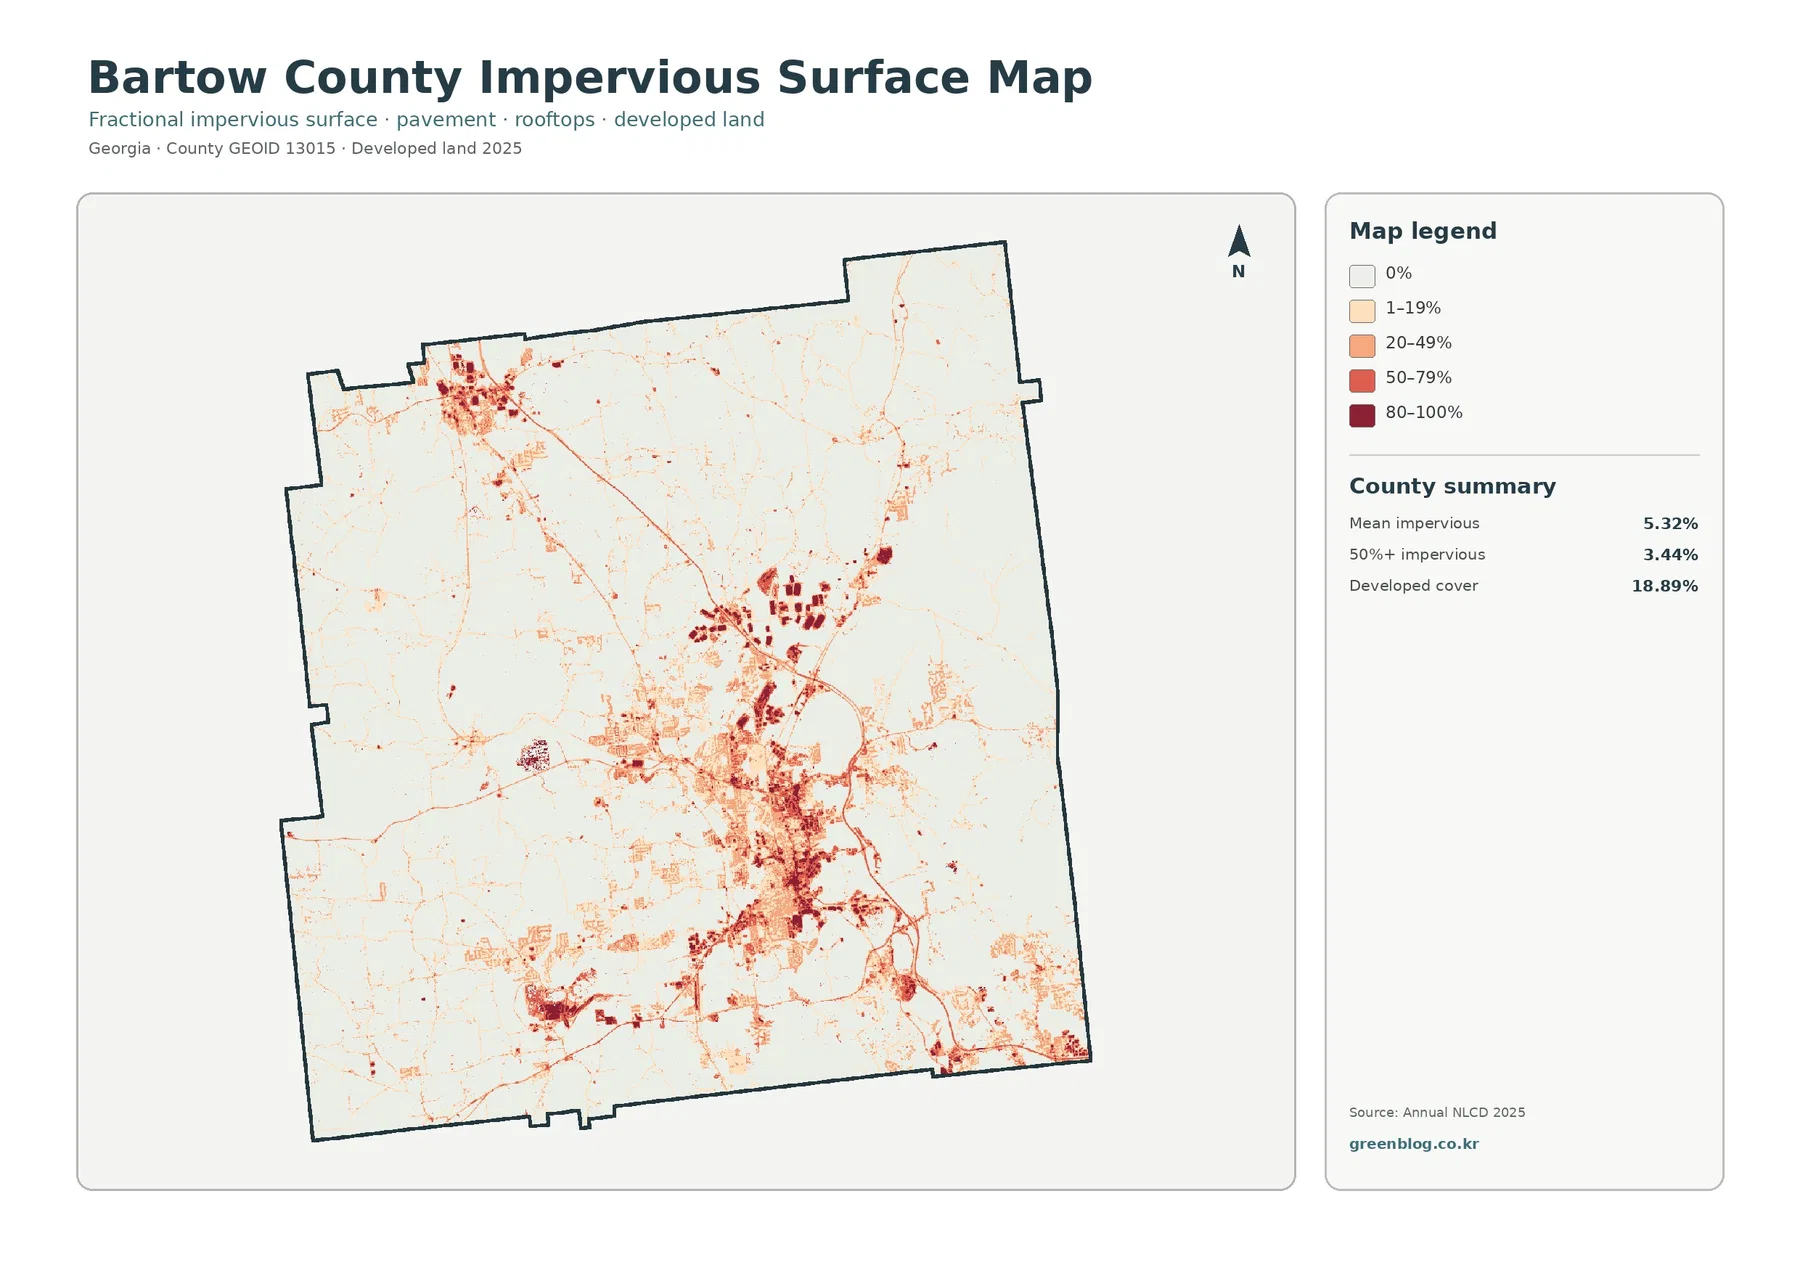
Impervious surface refers to rooftops, paved roads, parking areas, and similar materials that do not readily absorb rainfall. Bartow County’s mean impervious cover is 5.32%, and 3.44% of the county is mapped at 50% or greater impervious surface. Those values are far below the 18.89% developed-land share because many developed cells also contain lawns, trees, bare soil, and other permeable ground.
The darkest values are concentrated in the central urban area and in the separate northwestern cluster. Several thin high-value traces extend outward, while most of the eastern forest remains near the lightest end of the legend. The southwest farm landscape is also mostly light. This view makes the difference between a broad developed classification and a truly hard-surfaced built core much easier to see.
Cartersville’s location on Interstate 75 provides useful transportation context for the central urban area, but the impervious map does not label I-75 or any other route. A narrow dark line should not be assigned a road name without a transportation layer. Likewise, proximity between a road-like trace and development does not by itself prove that the road caused the surrounding land conversion.
The 1985–2025 comparison contains a large 37.23% endpoint class difference
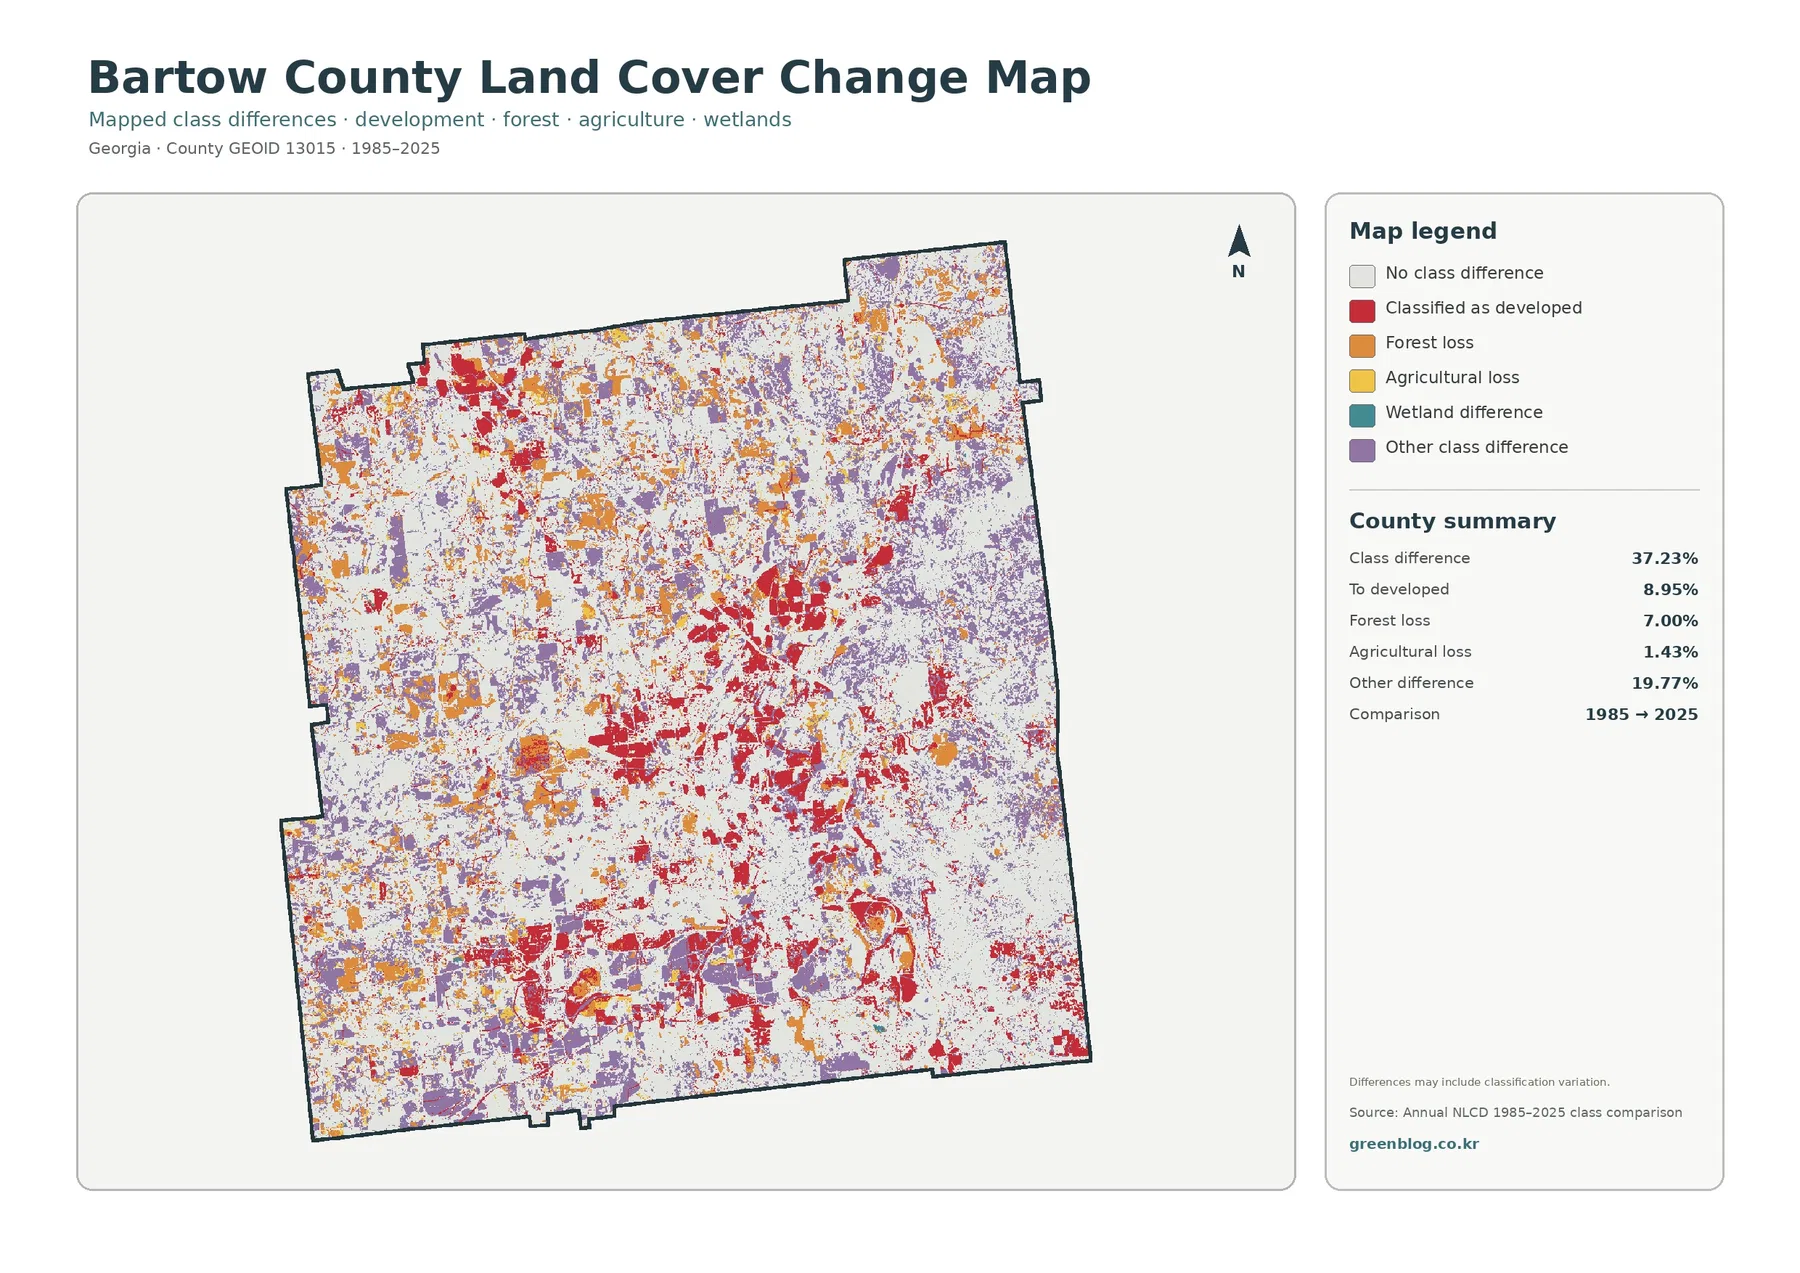
The total class difference between 1985 and 2025 is 37.23%. This should not be rewritten as a statement that 37.23% of Bartow County was physically transformed. The measure records cells whose assigned land-cover class differs between the two endpoints. Real change may contribute, but imagery conditions, seasonal effects, mixed cells, and classification methods can also affect the result.
Cells classified as developed account for 8.95% of the comparison. Red difference areas are prominent around the current central and northwestern developed concentrations and occur in smaller patches elsewhere. The current developed share of 18.89% and the 8.95% comparison category are not interchangeable and should not be combined to estimate a past developed percentage.
Forest loss is 7.00%, agricultural loss 1.43%, and other class difference 19.77%. The purple other-difference category is the largest listed component and is spread widely across the county. Wetland difference appears in the legend without a separate verified percentage, so its locations may be discussed but an exact rate should not be calculated from the image.
Colors that appear next to one another do not establish a cause. A forest-loss cell near a developed-difference cell may reflect land conversion, but forestry activity, vegetation recovery, agriculture, moisture conditions, or classification variation can also matter. Intermediate imagery and local land-use records are necessary for a site-specific explanation.
Current development, hard surface, and endpoint difference are three separate measures
The 18.89% developed share describes 2025 land cover. The 5.32% mean impervious value describes the average amount of hard surface, while the 8.95% developed category belongs to the 1985–2025 comparison. Each number is useful, but they answer questions about current extent, current surface intensity, and two-date classification difference respectively.
Forest statistics require the same care. Bartow County is 51.64% forest in 2025, while 7.00% of the endpoint comparison is labeled forest loss. Subtracting one from the other would not reconstruct 1985 forest cover because the comparison map is not a complete gain-and-loss accounting table for every class and every year.
A useful presentation can start with forest, Cartersville, and Allatoona Lake
The 2025 overview is the clearest first map for a county profile. It shows the broad eastern forest, central development, southwest farm areas, and southeastern reservoir in one frame. A rural-land discussion can then move to the forest-and-farmland view, while a development discussion benefits more from the impervious map.
Allatoona Lake provides a strong geographic reference for environmental or watershed presentations because its shape is easy to locate on the county map. The change map is best introduced after the current pattern is clear, with an explicit reminder that its colors indicate endpoint differences rather than the present-day surface. Comparisons with another Georgia county should use the same observation year and classification system.
Raster land cover is not a municipal boundary, zoning map, or parcel survey
Annual NLCD divides the landscape into grid cells and assigns one representative land-cover class to each. A real location can contain trees, pavement, a house, lawn, water, and bare ground within a small area, while the raster simplifies that mixture. Shorelines around Allatoona Lake and the fragmented edges around Cartersville are examples where local detail can be more complex than the colored boundary suggests.
A developed cell does not define a city limit or establish development permission, an agricultural cell is not a zoning district, and a forest cell does not identify public ownership. Planning, property, and regulatory questions require Bartow County or municipal planning and parcel records rather than this land-cover layer.
The original JPG files measure 2480×1754 pixels each. Enlarging them can improve visibility of small map patterns but cannot create detail beyond the underlying source. According to the package manifest, these JPGs are not flagged as satisfying its A3 high-resolution reference. They are suitable for screens, presentations, ordinary printouts, and county comparisons; very large printing should be checked at the intended output size.
Frequently Asked Questions
What is the largest 2025 land-cover class in Bartow County?
Forest is the largest class at 51.64%, followed by agriculture at 20.82% and developed land at 18.89%. The eastern side is especially forested, while developed cover is concentrated around the central Cartersville area and a separate northwestern cluster.
Where does Allatoona Lake appear in the county pattern?
The large branching water body in the southeastern portion of the map provides the clearest water feature. The U.S. Army Corps of Engineers places Allatoona Lake on the Etowah River in Bartow County about four miles east of Cartersville. The land-cover layer shows its position and surrounding cover, not reservoir depth or operating level.
Does the 37.23% class difference mean that much of Bartow County physically changed?
No. It is the share of cells assigned different classes at the 1985 and 2025 endpoints. Supplied components include 8.95% classified as developed, 7.00% forest loss, 1.43% agricultural loss, and 19.77% other difference. Classification effects may be included, so individual sites require additional evidence.
Sources and Reference Data
- MRLC Annual NLCD Data – annual source data for the 2025 cover map and 1985–2025 endpoint comparison.
- USGS Annual NLCD Land Cover Classification – definitions for forest, developed, agricultural, water, and other mapped classes.
- U.S. Census Bureau TIGER/Line Shapefiles – official county-boundary reference for Bartow County.
- UGA Extension Bartow County – Agriculture & Natural Resources – county-specific agriculture, forestry, pasture, livestock, and farm-resource context.
- Bartow County Joint Comprehensive Plan – official joint planning context for Bartow County and its municipalities.
- U.S. Army Corps of Engineers – Allatoona Lake – official location and management context for the reservoir on the Etowah River.
Map File Information
The ZIP contains four original JPG maps covering Bartow County's 2025 land cover, forest and farmland, impervious surface, and 1985–2025 class differences.
- Included Files: Use only the versions confirmed in the article and supplied images
- File Type: Use the confirmed download contents
- Intended Use: Printing, education, presentations, and map-based projects
Related Maps
- Appling County Georgia Land Cover Map
- Atkinson County Georgia Land Cover Map
- Bacon County Georgia Land Cover Map
Green Map creates custom-edited map images using open geographic data sources such as geoBoundaries, Natural Earth, OpenStreetMap, and government open data.
These maps are edited visual materials, not raw data files, and are provided for education, documents, presentations, and graphic reference.