Fountain County is dominated by agriculture on the supplied 2025 classification, but its surface is not one uninterrupted field pattern. Agriculture covers 72.91%, forest 16.95%, and developed land 7.60%, with wooded bands and several compact town centers breaking up the farm landscape. This Fountain County Indiana Land Cover Map set makes those contrasts easier to compare.
The page includes current land cover, a forest-and-farmland view, impervious surface, and a 1985–2025 class-difference map. Each WebP preview appears with the discussion, and the four original 2480 × 1754-pixel JPG maps are available together in one ZIP for county profiles, lessons, presentations, and local reference work.
Table of Contents
A farm-dominated county with a much more wooded southwest
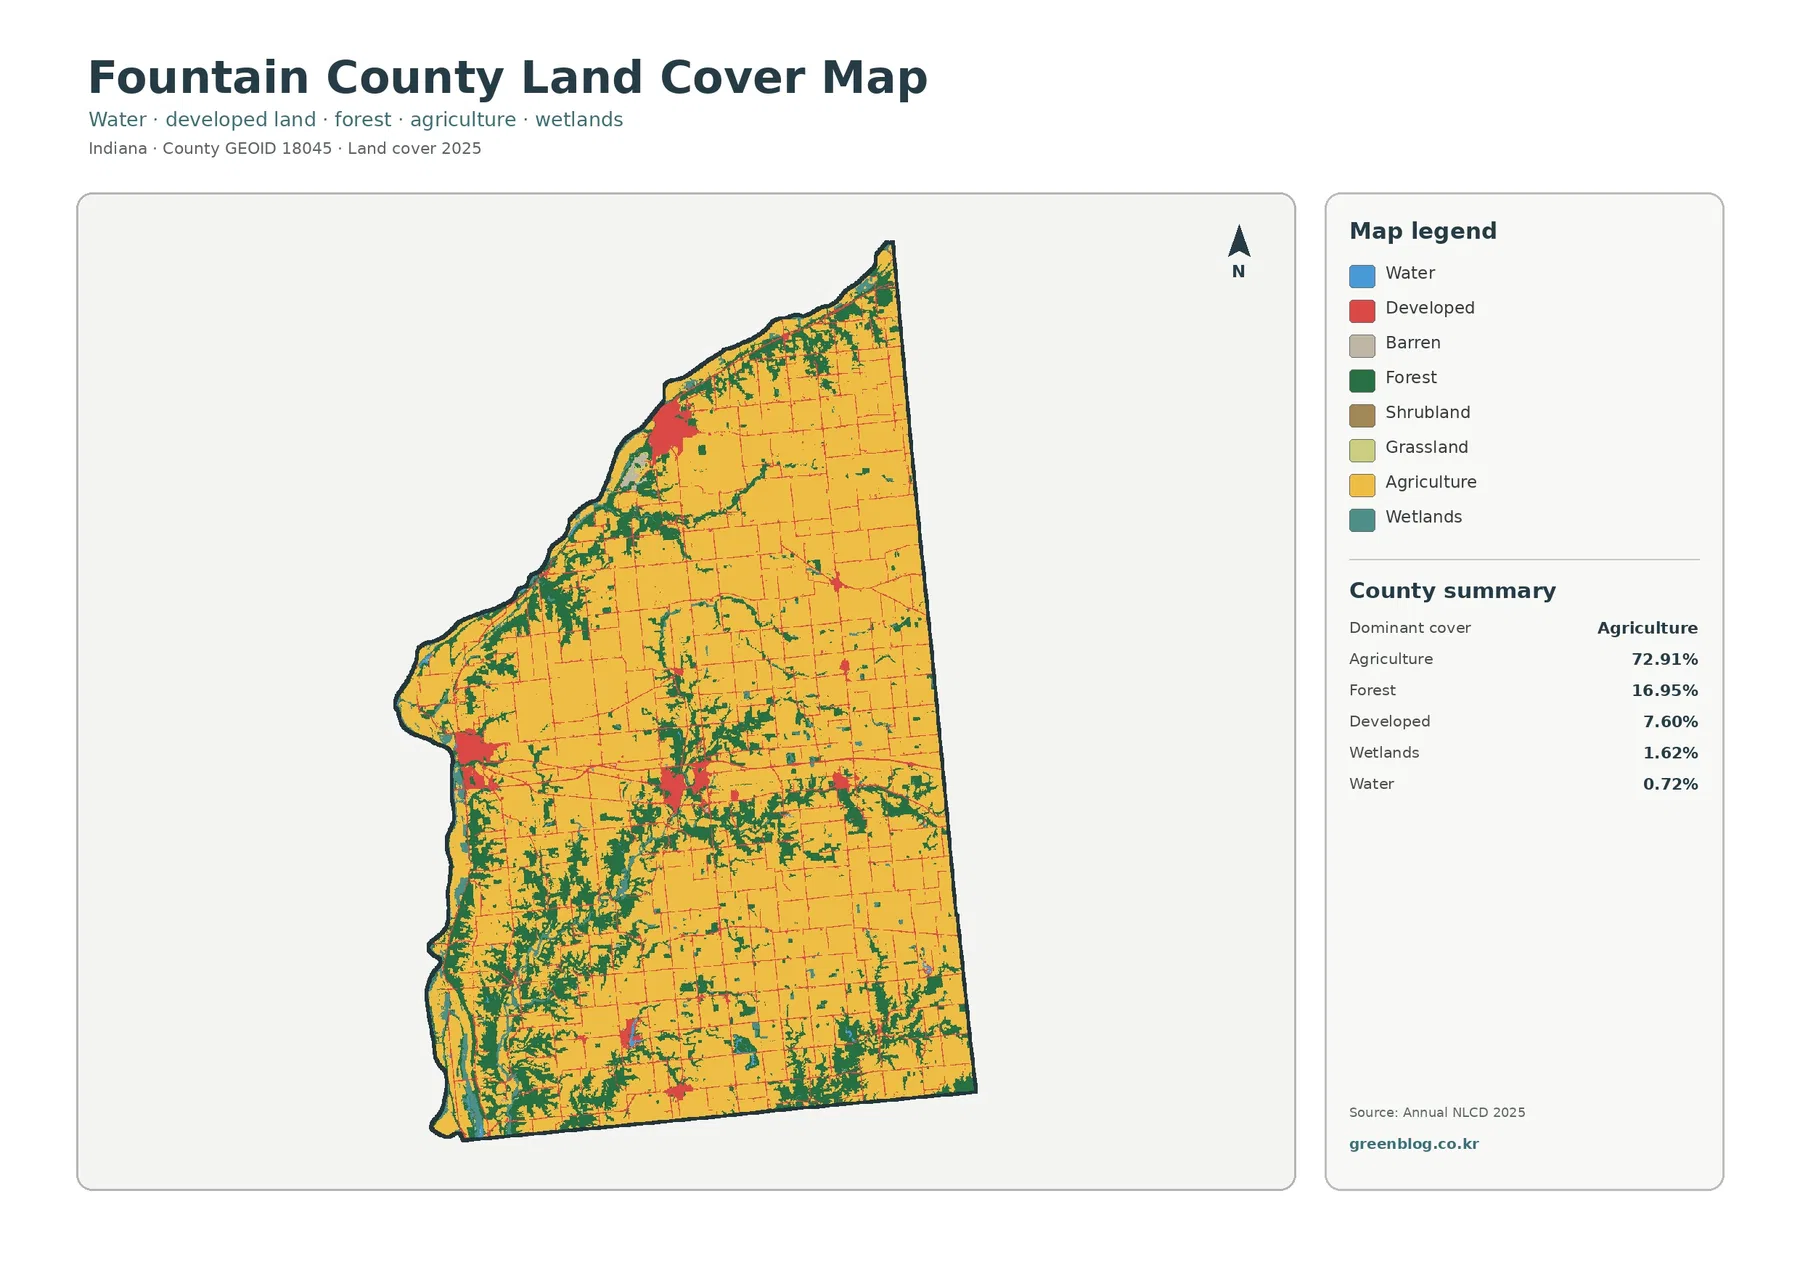
Agriculture is the unmistakable background of the county. Large yellow blocks fill much of the northeast, east, and central interior, and farming remains common through the southern half. The 72.91% countywide share explains why field color occupies so much of the page, yet the pattern changes noticeably near the winding western edge and across the southwest. There, forest occupies larger blocks and divides farmland into smaller pieces.
Forest is the second-largest class at 16.95%. It does not form a single isolated reserve; instead, it is especially strong along parts of the western side and across the southern and southwestern interior, then continues northward as narrower strips and scattered patches. This distribution gives the south a more mixed appearance than the broad farm blocks in the northeast. A reader comparing only the county percentages would miss that internal difference.
Developed land accounts for 7.60%, but several clusters stand out clearly against the rural background. The largest concentration near the northwest corresponds to Attica, while a separate western cluster aligns with Covington. Smaller developed areas appear farther east and through the middle of the county. These colors identify developed surface classes, not incorporated boundaries, so they should not be used as a substitute for a municipal map.
Wetlands cover 1.62% and open water 0.72%. Blue water is limited, while teal wetland cells appear more often as narrow pieces and small patches associated with low-lying drainage areas and the county’s river landscape. Water and wetlands should not be merged into one category: open-water classification emphasizes exposed water, while wetland classes can include vegetated ground affected by water.
Attica and Covington stand out along the Wabash side of the county
Official local planning material places Fountain County in west-central Indiana and identifies Covington as the county seat. Covington’s city site describes the community as lying in the western part of the county along the Wabash River. That background helps orient the western developed cluster on the land-cover image. The map itself does not explain why settlement grew there, however; it simply shows the present classified surface around the city and surrounding rural land.
The northwest cluster aligns with Attica, another community associated with the Wabash River. Indiana’s state tourism material describes Attica as a northern Fountain County river town. On the 2025 map, the developed concentration is compact compared with the surrounding farm and forest classes, and the boundary between built land and agricultural cover is easy to see. Fine red traces outside the main cluster should not automatically be treated as city streets or city limits because route names and municipal boundaries are absent from the preview.
Farther into the county, development becomes more dispersed. Veedersburg’s official town site places it at the crossroads of I-74 and US 41, and smaller built concentrations on the map are consistent with multiple town and transportation nodes across the rural interior. That spatial association is useful for orientation, but the land-cover image does not label highways. A transportation map is required before a thin developed line can be named as a particular route.
Removing the urban colors exposes the forest-field boundary
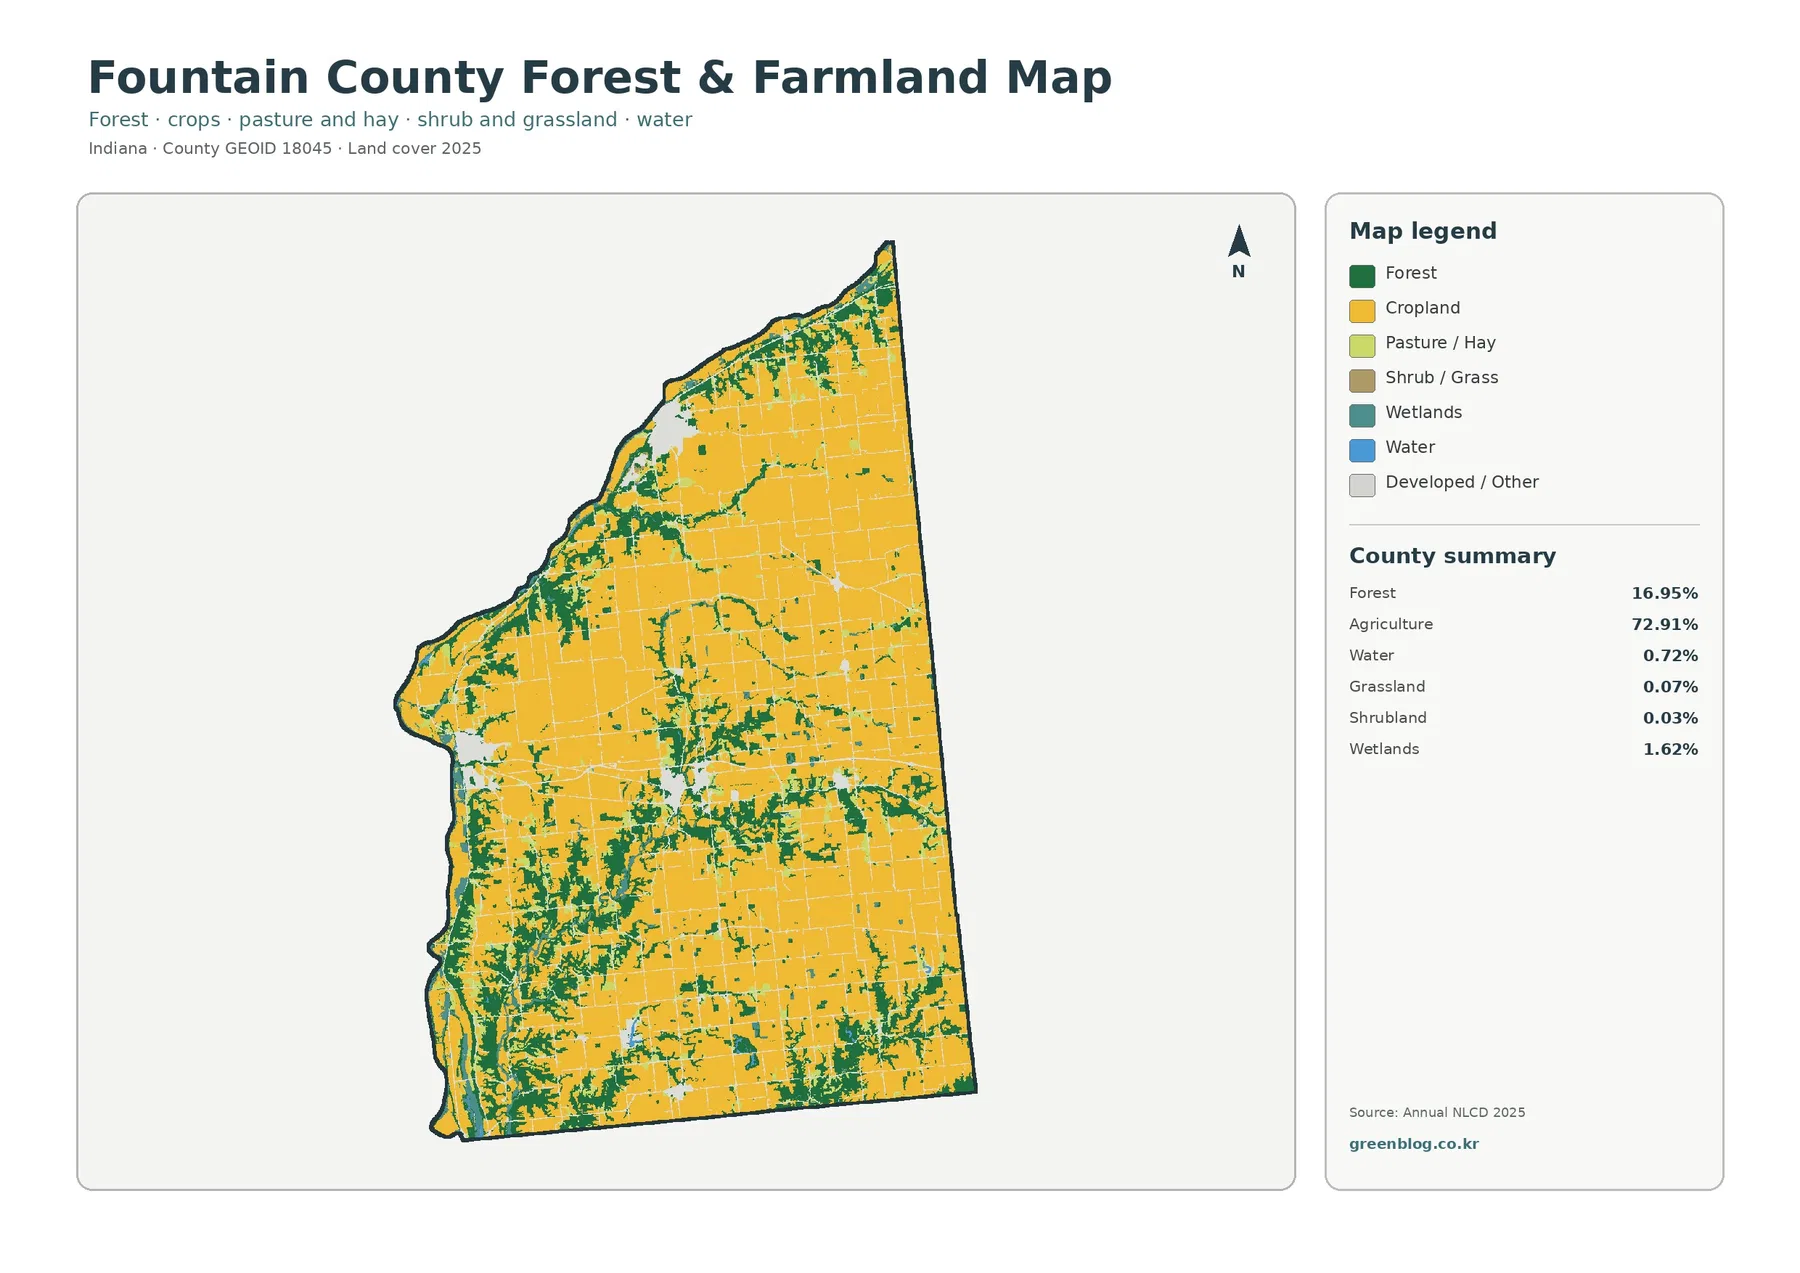
The forest-and-farmland image is especially useful in Fountain County because the two dominant natural-working surfaces meet in very different ways from north to south. In the northeast, cropland remains broad and continuous, with forest confined to narrow strips and small patches. Moving toward the southwest, dark green becomes more frequent and interrupts the farm blocks. The contrast is clearer here because developed and miscellaneous surfaces are visually reduced.
The 16.95% forest share therefore has more geographic meaning when viewed alongside the 72.91% agricultural share. A countywide statistic cannot show whether forest is evenly distributed, concentrated in one corner, or arranged along narrow landforms. Fountain County’s map shows a strong southern and western component plus smaller wooded pieces across the interior. That makes this version useful for explaining where farm country transitions into more wooded terrain without implying a legal forest boundary.
Grassland is listed at only 0.07% and shrubland at 0.03%, so neither appears as a major standalone landscape. Small fragments may occur between fields, forest, development, and wet areas. Those tiny cells should not be interpreted as precise property management units. Land cover is a classification of the surface seen by the dataset, not a parcel map, ownership layer, zoning map, or proof of how a field is being managed on the ground.
Purdue Extension’s Fountain County Agriculture and Natural Resources program provides county-specific information on crops, farm management, livestock, natural resources, and land conservation. That source is useful for understanding the local agricultural setting, but it serves a different purpose from the 72.91% land-cover statistic. The percentage comes from the supplied 2025 classification, while Extension material addresses real-world production and resource questions.
A 1.63% impervious mean separates pavement from the broader developed class
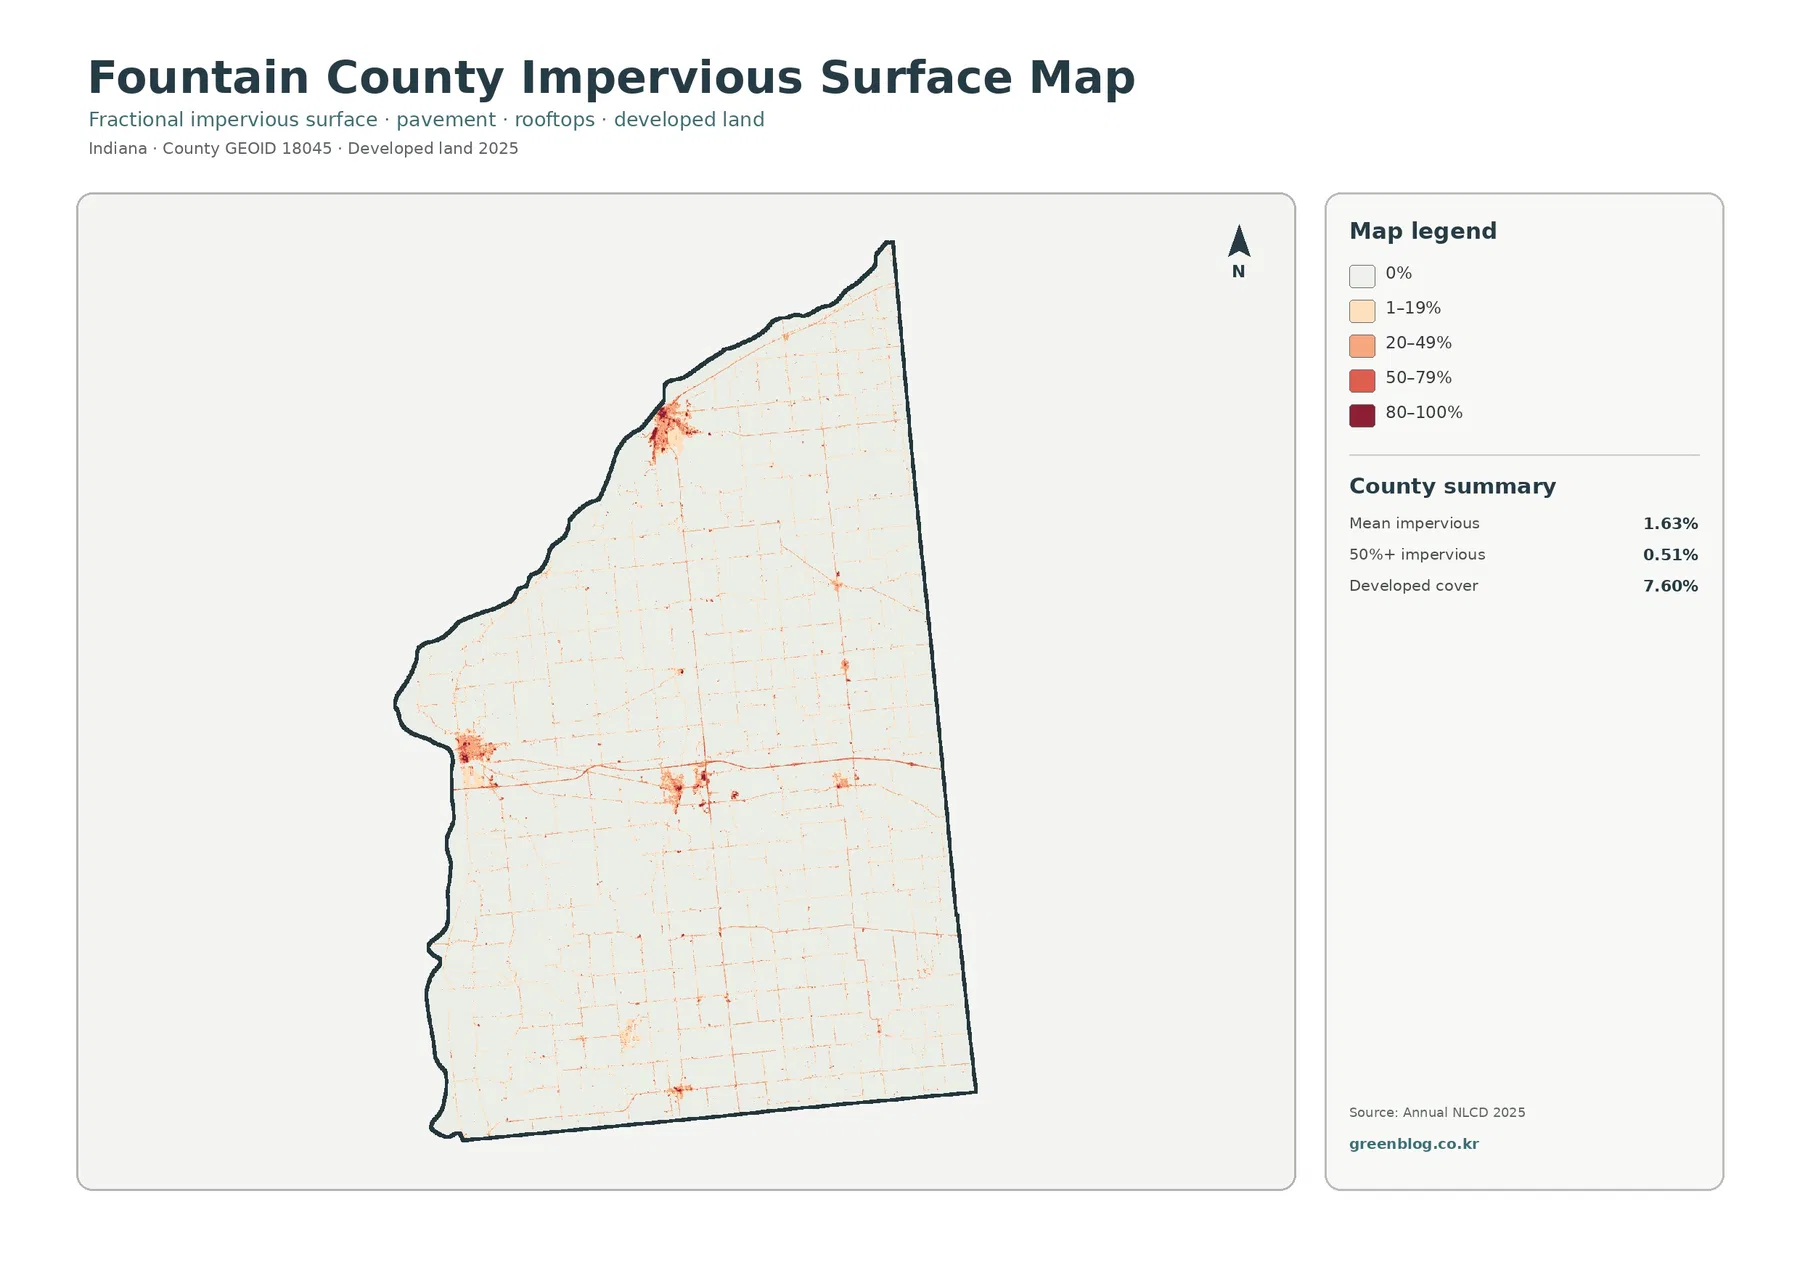
Mean impervious cover is 1.63%, and only 0.51% of the county is mapped at 50% impervious or greater. Both values are far below the 7.60% developed share. Developed land can contain lawns, trees, bare soil, and other permeable surfaces around buildings and roads, whereas the impervious product focuses on surfaces that resist water infiltration, such as rooftops and pavement.
The darkest values are concentrated around the northwest town cluster, with another noticeable concentration in western Fountain County and smaller marks across the center and east. Thin lines connect some of these places through the rural landscape. They resemble transportation patterns, but the map provides no road names or traffic information. The safest use is to describe where hard surfaces are concentrated and then consult an official road layer for route identification.
The countywide mean also hides strong local contrasts. A compact town can contain blocks with high impervious percentages while thousands of surrounding agricultural acres remain close to zero. For that reason, location and continuity matter more than the mean alone when comparing settlement intensity. An impervious map can support an initial runoff discussion, but rainfall, soils, slope, drainage systems, streams, and floodplain data are needed before drawing conclusions about flooding.
The 6.64% endpoint difference is mostly not mapped as new development
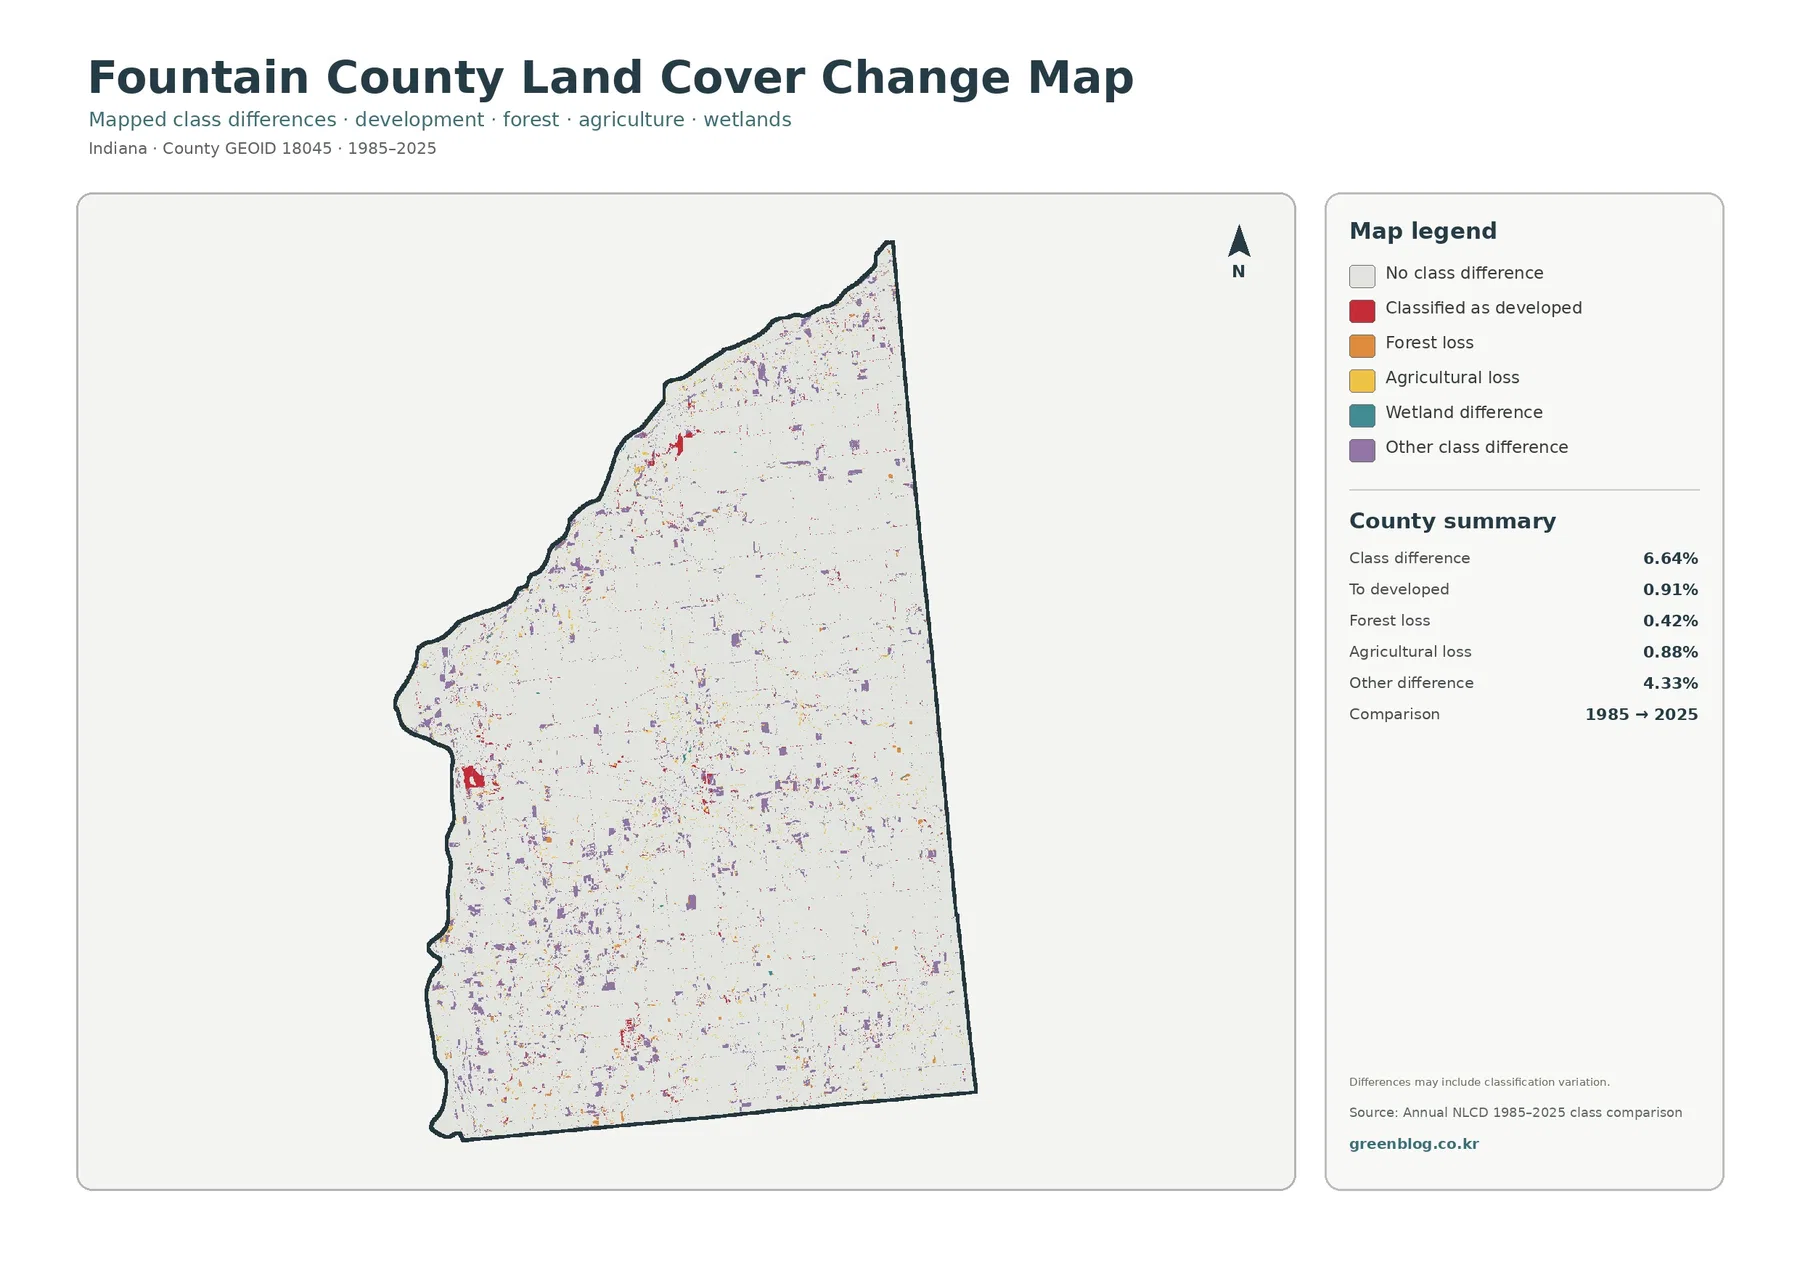
The 1985–2025 comparison reports 6.64% total class difference. The listed components include 0.91% classified as developed, 0.42% forest loss, 0.88% agricultural loss, and 4.33% other difference. The largest listed component is therefore “other difference,” not development. Treating the entire 6.64% as urban growth would misread the legend and substantially overstate what the map says.
Red developed-conversion cells are most noticeable around some existing settlement clusters, including the northwest and western parts of the county, but they do not cover large continuous areas. Forest-loss and agricultural-loss colors are more scattered. Purple other-difference cells appear from north to south in numerous small pieces. This distributed pattern is one reason the countywide change total cannot be explained by one town or one surface class.
“Loss” in this map means that a cell classified as forest or agriculture at the 1985 endpoint received another class in 2025. It does not identify logging, abandonment, construction, flooding, harvest, or classification error as the cause. Determining timing and cause requires intermediate imagery, local records, permits, and sometimes field observation. The class-difference product is a screening view, not a complete land-use history.
The legend also includes wetland difference, but the summary does not provide a separate official percentage for that category. It would be inappropriate to subtract the other numbers from 6.64% and present the remainder as a verified wetland-change statistic. The map can show where teal difference cells appear, but an unsupported residual should not be converted into a new published percentage.
Use the four views in sequence rather than treating them as interchangeable maps
The 2025 overview is the best starting point for a general Fountain County profile because it places agriculture, forest, development, wetlands, and water on one page. It quickly establishes the farm-dominated countywide pattern while retaining the western town clusters and the more wooded south. Once that overall arrangement is clear, the forest-and-farmland image can be used to examine the transition from broad field blocks to more fragmented southern cover.
For settlement questions, the impervious map adds information that the developed class alone cannot supply. Two places may both appear as developed land yet differ greatly in the proportion of rooftops and pavement. Comparing the 7.60% developed share with the 1.63% mean impervious value is a useful way to explain that distinction. The class-difference map belongs after the current maps so its red, orange, yellow, teal, and purple colors are not mistaken for present-day land-cover classes.
Pairs of maps can also support focused presentations. The current overview and impervious map work well for a discussion of Attica or Covington because they separate developed extent from hard-surface intensity. The forest-and-farmland image paired with the change map can support a lesson about the southwest, where woodland is more prominent and endpoint differences are scattered through a mixed landscape. In either case, color coincidence should be described as an association unless another source establishes the cause.
What the downloadable JPGs can and cannot answer
Each original JPG measures 2480 × 1754 pixels. The files are appropriate for county profiles, classroom materials, presentation slides, reference graphics, and moderate-size printed handouts where the goal is to compare broad land-cover patterns. The package does not state that the files meet an A3 high-resolution reference, so a test print is advisable before using them for a large poster.
These maps are not parcel surveys. Agricultural color does not define farm ownership, forest color is not a legal conservation boundary, and wetland color is not automatically a regulatory wetland determination. Likewise, developed land does not indicate where construction is legally permitted. Property, zoning, permitting, flood, and jurisdictional wetland questions require the latest records from Fountain County, local municipalities, and the appropriate state or federal agencies.
The current maps also represent the supplied 2025 observation year. Construction, harvest, tree removal, vegetation recovery, road work, and temporary water conditions after that date may not appear. The 1985–2025 comparison uses two endpoints, so land that changed in an intermediate year and later returned to its original class may not be obvious in the endpoint image. That limitation matters whenever the map is used to discuss a specific project or date.
Frequently Asked Questions
If agriculture is 72.91%, why does the southwest look so wooded?
The 72.91% figure is a countywide total. Large farm blocks dominate the northeast, east, and much of the interior, while the 16.95% forest share is more concentrated along the western side and across the southwest and south. Reading both the statistic and the map distribution is necessary to understand that internal contrast.
Why is developed cover 7.60% when mean impervious cover is only 1.63%?
Developed land can include lawns, trees, soil, and other permeable surfaces around buildings and roads. Impervious cover isolates rooftops, pavement, parking areas, and similar hard surfaces. Compact places such as Attica and Covington may contain locally high impervious values, but extensive rural land with values near zero lowers the countywide mean.
Does the 6.64% 1985–2025 class difference represent new development?
No. Only 0.91% is listed as classified to developed. The 6.64% total also contains forest loss, agricultural loss, wetland difference, and other class difference, with the 4.33% other-difference category forming the largest listed component. The total should not be described as an urban-growth percentage.
Sources and Reference Data
- MRLC Annual NLCD Data – official access point for current land-cover and annual comparison products
- USGS Annual NLCD Land Cover Classification – definitions and interpretation guidance for agriculture, forest, development, wetlands, water, and related classes
- U.S. Census Bureau TIGER/Line Shapefiles – official geographic boundary reference for Fountain County
- Fountain County Comprehensive Plan – official county planning background, boundaries, and Covington context
- Purdue Extension – Fountain County Agriculture & Natural Resources – county-specific agriculture, crops, natural resources, and land-conservation information
- City of Covington – About Covington – official local information describing Covington’s location along the Wabash River
- Town of Veedersburg – official town information on Veedersburg and its I-74/US 41 location in Fountain County
Map File Information
The ZIP contains four original JPG maps for comparing Fountain County agriculture, forest, Attica and Covington development, impervious surface, and 1985–2025 class differences.
- Included Files: General land cover, forest and farmland, impervious/developed surface, and land-cover change maps
- File Type: Four original JPG map files bundled in one ZIP archive
- Intended Use: Printing, education, presentations, and map-based projects
Related Maps
- Adams County Indiana Land Cover Map
- Allen County Indiana Land Cover Map
- Bartholomew County Indiana Land Cover Map
Green Map creates custom-edited map images using open geographic data sources such as geoBoundaries, Natural Earth, OpenStreetMap, and government open data. These maps are edited visual materials, not raw data files, and are provided for education, documents, presentations, and graphic reference.