Seminole County’s 2025 land-cover pattern is defined by a strong split between built-up western and southern areas and wet, water-rich eastern areas. Developed land accounts for 46.01% of the county, wetlands for 35.57%, water for 9.62%, agriculture for 5.12%, and forest for 3.50%. Those percentages matter, but the map is more useful when they are read together with where each class is concentrated.
This Seminole County Florida Land Cover Map page includes four complementary views: current land cover, forest and farmland, impervious surface and developed land, and a 1985–2025 class-difference map. The WebP images are intended for on-page comparison, while the four original JPG maps are packaged together in one ZIP download for lessons, presentations, county comparisons, and broad planning or environmental reference.
Table of Contents
A county divided between a developed west and a wet eastern half
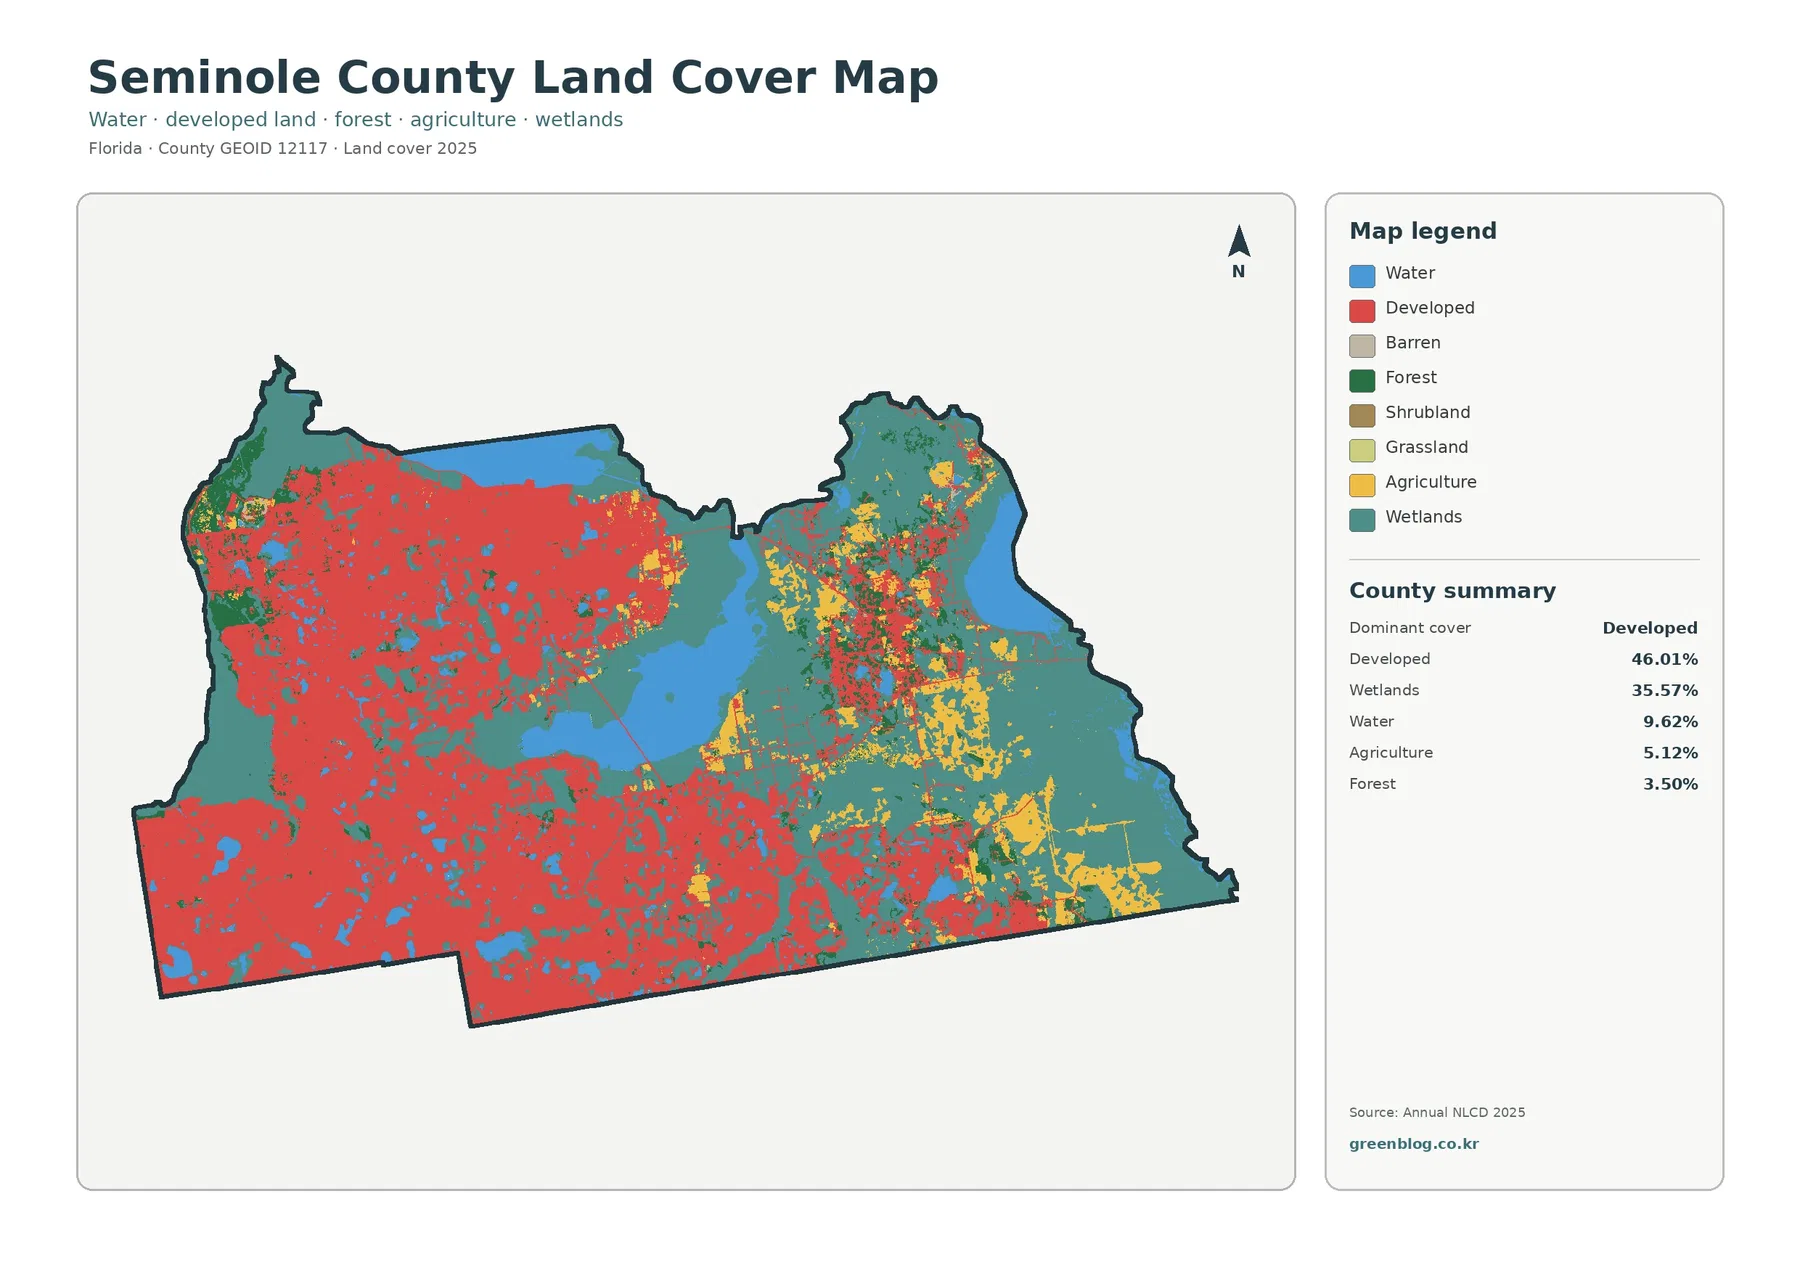
The red developed class dominates the western half of the map and remains extensive along the southern edge. It forms broad connected areas rather than a few isolated spots, especially across the northwest and southwest. Seminole County’s own regional materials describe a heavily urbanized western portion of the county, and the land-cover image presents the same broad contrast. The red class is still a surface classification, however, not a city boundary, zoning district, or statement about ownership.
East of the central lakes, teal wetlands become the most persistent color. Wetlands make up 35.57% of the county and cover large portions of the east and northeast, with additional wet areas around the central water bodies. Yellow agricultural cover is mixed into that eastern landscape, while smaller developed areas follow settled corridors. This is why the county cannot be described accurately with a single label such as “urban” or “wetland.” Both patterns are major parts of the same county.
Open water represents 9.62%. The large central water body corresponds to the Lake Jesup area identified in Seminole County watershed materials, while additional lakes and river-connected waters occur elsewhere. Open water and wetland should not be combined into one category. Water marks open surface water; wetland classification can include vegetated or seasonally saturated land that may not appear blue on a map.
Impervious cover reveals where development is most intense
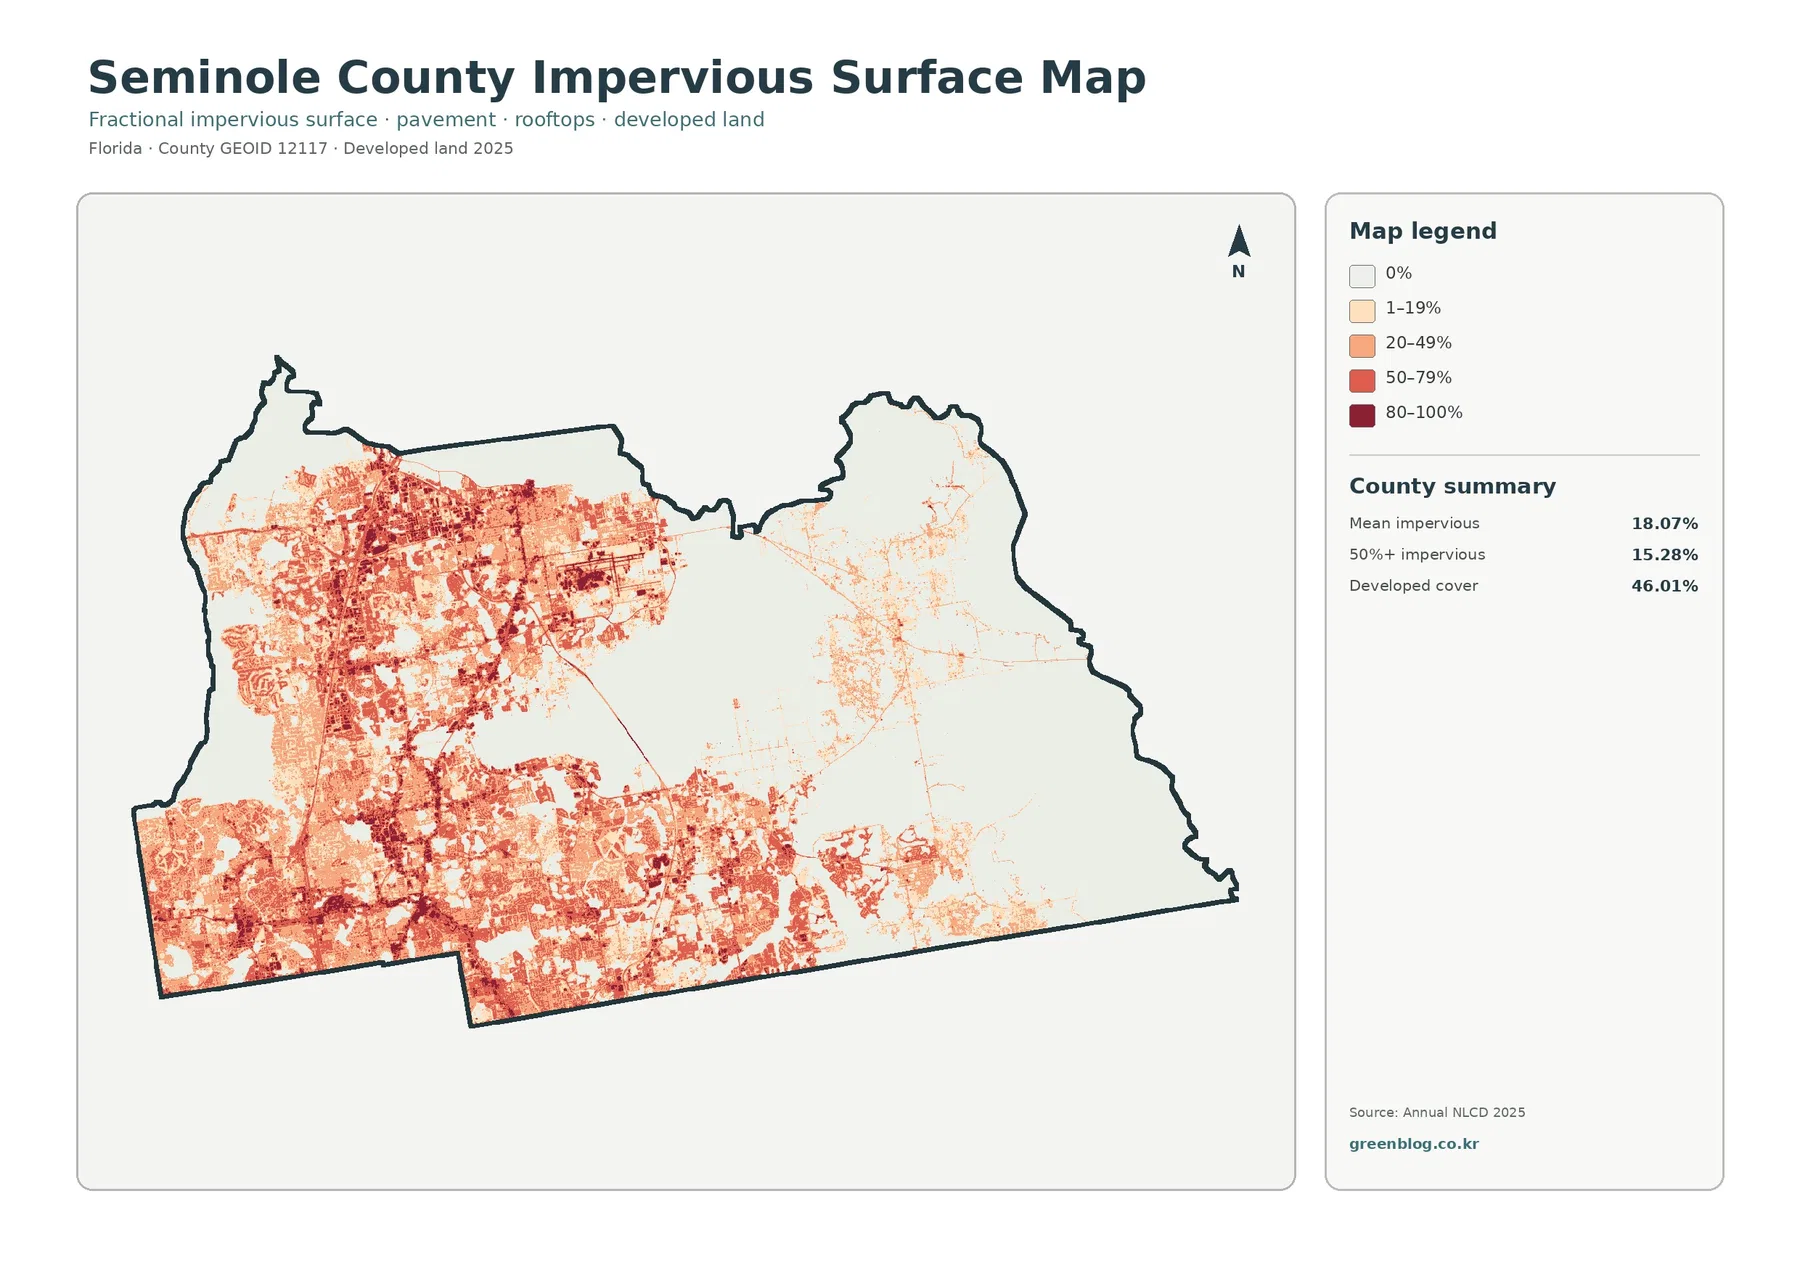
Developed cover and impervious cover measure different things. A developed land-cover cell may contain houses, lawns, trees, landscaped areas, streets, and open ground. Impervious surface isolates the portion occupied by hard materials such as rooftops, pavement, and parking lots. Seminole County’s mean impervious value is 18.07%, substantially below the 46.01% developed-cover share because not every developed acre is completely sealed.
The darkest impervious classes cluster in the west and south. Large concentrations are visible in the part of the county that includes the established western municipalities and the developed area north of Orange County. Farther east, most of the map is pale, with narrow lines and small clusters around roads and settled places. The contrast is important: Seminole County has a large developed share, but the most intensely hard-surfaced land is concentrated rather than evenly distributed.
Areas at 50% or greater impervious cover account for 15.28% of the county. That figure is useful for comparing development intensity, but it does not identify traffic volume, road ownership, drainage performance, or flood risk. Thin high-impervious lines can resemble major roads, yet this is not a transportation map. Likewise, low impervious cover does not automatically mean low flood risk because rainfall, soils, topography, drainage systems, lakes, and wetlands all matter.
Lake Jesup and the county’s watersheds help explain the wet center and east
The large central lake is one of the most useful orientation points in the map set. Seminole County’s Lake Jesup Basin Study describes a roughly 63-square-mile drainage basin in eastern Seminole County that includes Lake Jesup, Lake Minnie, Lake Mary, Sweetwater Creek, and other water features. The basin ultimately drains toward the St. Johns River. This official watershed context helps a reader understand why water and wetland cover are so prominent across the center and east.
The forest-and-farmland view makes the eastern landscape easier to compare
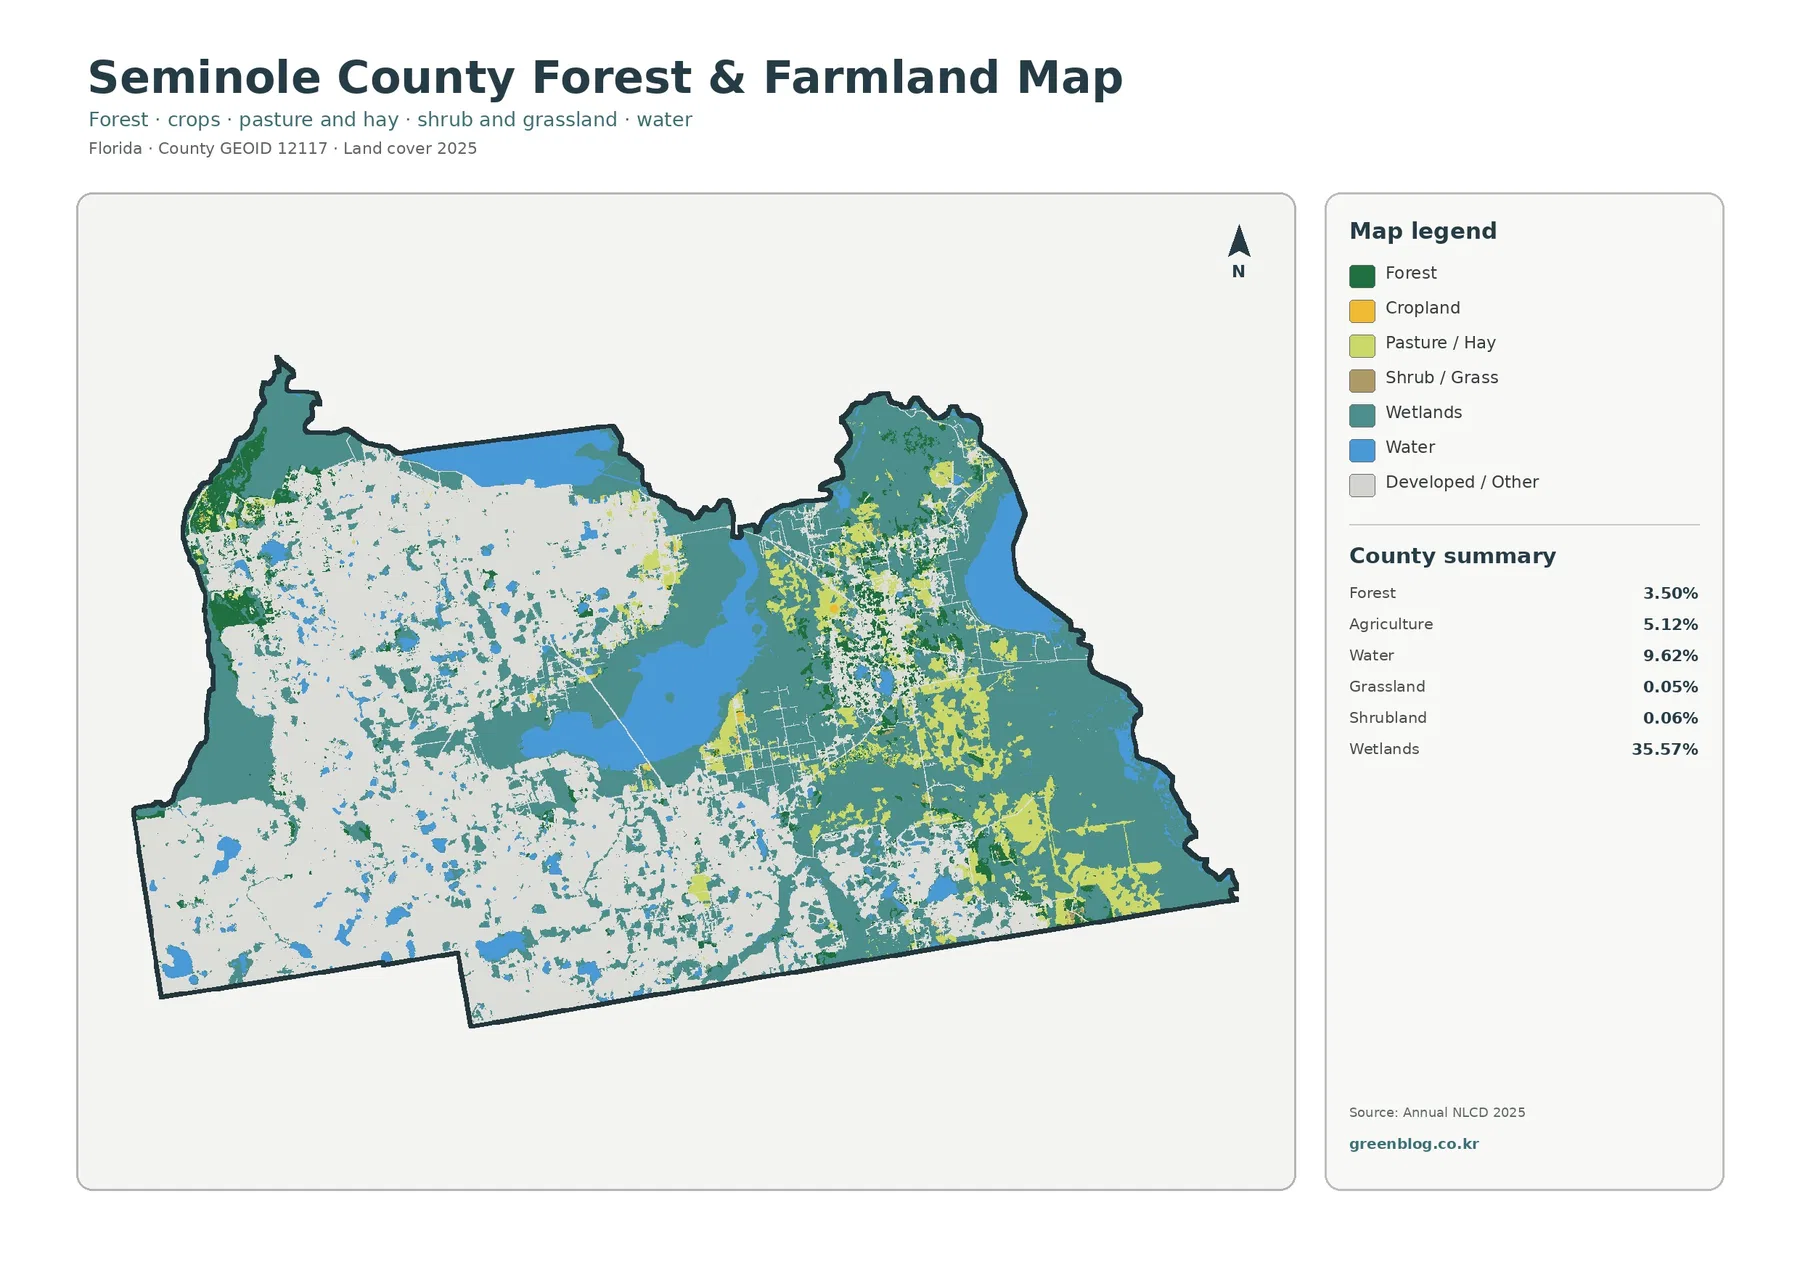
The forest-and-farmland view removes much of the visual competition created by the developed class. Wetlands still dominate large portions of the east, but agricultural areas become easier to identify. They appear in several sizeable blocks east and southeast of the central water, as well as in smaller patches farther north. The county summary combines agriculture into one 5.12% value even though the map legend distinguishes cropland from pasture or hay.
Because the supplied statistics do not provide separate cropland and pasture percentages, exact shares should not be estimated from the image. The colors are useful for location and comparison, not for creating a new table of unverified numbers. The same caution applies to the shape of fields. Rectangular or elongated colored areas are raster classifications, not surveyed farm parcels.
The 1985–2025 comparison is dominated by cells classified as developed
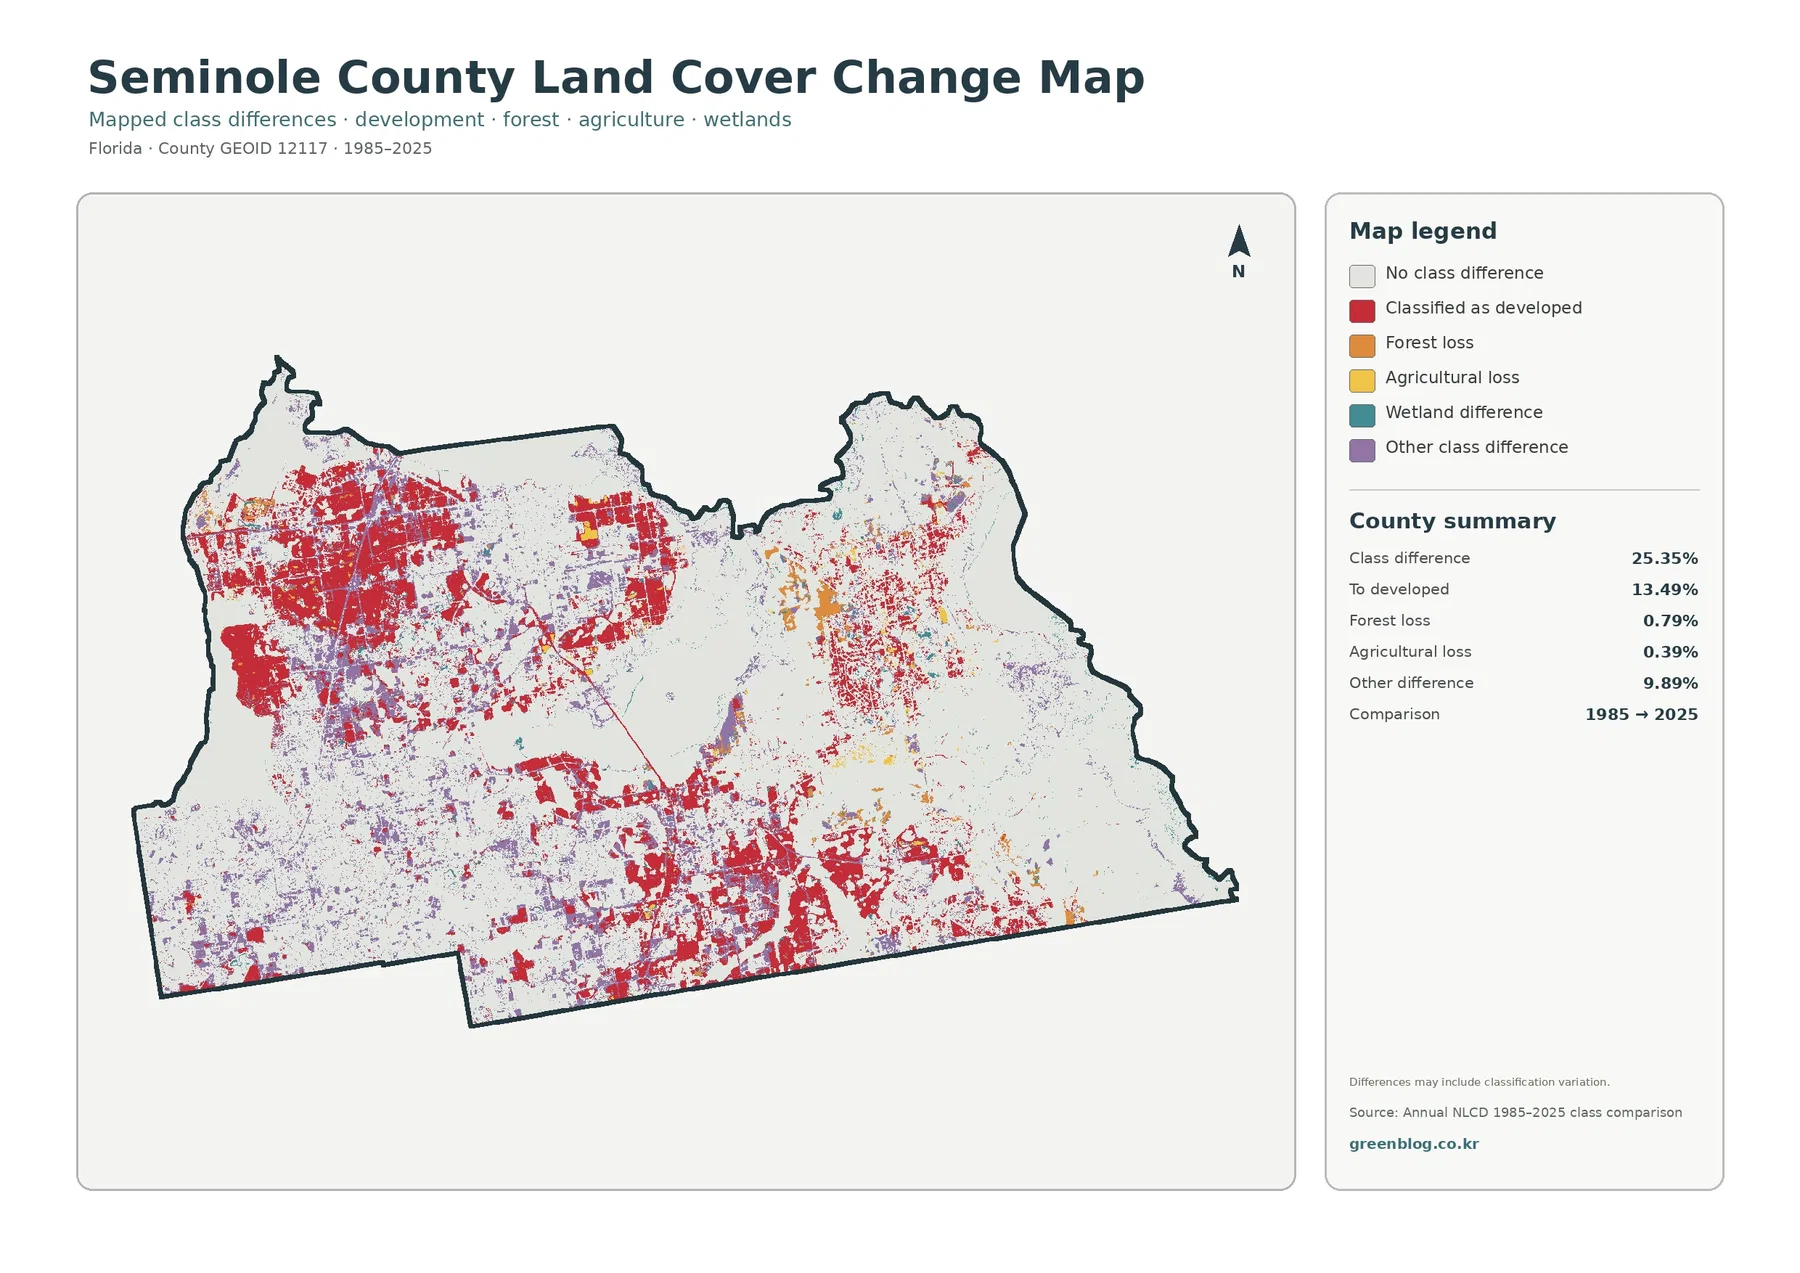
The comparison reports a total class difference of 25.35%. The largest listed component is “to developed” at 13.49%, and red cells are widespread through the west and south. This 13.49% value is not another way of stating the current 46.01% developed share. The 46.01% figure describes the 2025 land-cover composition; 13.49% identifies cells highlighted as a developed-category difference between the two comparison years.
Forest loss is listed at 0.79%, agricultural loss at 0.39%, and other class difference at 9.89%. Wetland difference appears in the legend, but the supplied summary does not assign it a separate percentage. The image can therefore show where wetland-category differences occur, but it does not support an exact wetland-difference rate calculated by eye.
Most importantly, a 25.35% class difference should not be rewritten as “25.35% of Seminole County was physically transformed.” The map itself warns that classification variation may be included. Real land-cover change can contribute to the result, but imagery, seasonal conditions, mixed pixels, and classification methods can also affect whether a cell falls into the same class in both years.
Practical uses for county profiles, lessons, and presentations
For a general Seminole County profile, begin with the 2025 land-cover map. It communicates the 46.01% developed share, the 35.57% wetland share, the large central water body, and the west-to-east contrast in a single frame. It is the strongest first image when an audience needs the countywide pattern before moving into one topic.
Scale, raster cells, and image size set limits on what the maps can prove
Annual NLCD is raster data, meaning the landscape is divided into grid cells and each cell receives a representative class. A real cell may contain trees, grass, pavement, water, and buildings at the same time. The map simplifies that mixture, so boundaries between development, wetlands, fields, and lakes are generalized rather than surveyed.
The original JPG files in this package are 2480×1754 pixels. Enlarging them can make colors easier to see, but it does not add new source detail. The asset manifest does not mark the files as meeting the package’s A3 high-resolution reference, so users planning large-format prints should check output quality at the intended print size.
Choosing the right JPG from the download
The Seminole County Florida Land Cover Map download contains the four original JPG views used in this article. Choose the current land-cover map for an overall county profile, the forest-and-farmland map for vegetation and working-land comparison, the impervious map for development intensity, or the 1985–2025 map for a two-date classification comparison.
Frequently Asked Questions
What is the largest land-cover class in Seminole County?
Developed land is the largest class in the supplied 2025 summary at 46.01%. Wetlands follow at 35.57%, then water at 9.62%, agriculture at 5.12%, and forest at 3.50%. The map adds an important detail to those numbers: development is concentrated mainly in the west and south, while wetlands are much more extensive in the center and east.
Why is developed cover 46.01% while mean impervious cover is 18.07%?
Developed land can include lawns, trees, landscaped open space, and other permeable surfaces along with buildings and pavement. Impervious cover isolates hard surfaces such as roofs, roads, and parking areas. Because the two measures describe different parts of the landscape, the countywide impervious average can be much lower than the developed-land share.
Does the 25.35% class difference mean a quarter of the county was completely changed?
No. It is the share of cells classified differently in the 1985 and 2025 comparison. The map lists 13.49% as “to developed,” 0.79% forest loss, 0.39% agricultural loss, and 9.89% other difference, and it warns that classification variation may be included. Determining the cause of a change requires additional evidence.
Sources and Reference Data
- MRLC Annual NLCD Data — source data for the 2025 land-cover and 1985–2025 comparison views
- USGS Annual NLCD Land Cover Classification — definitions for developed, forest, agricultural, wetland, and other classes
- U.S. Census Bureau TIGER/Line Shapefiles — county-boundary reference
- Seminole County Lake Jesup Basin Study — official information on the Lake Jesup drainage basin and major water features
- Seminole County Wekiva Basin Study — official watershed context for western Seminole County
- Seminole County Comprehensive Plan — official planning reference for future land use, conservation, drainage, and related county policies
Map File Information
The ZIP contains the four original JPG maps used to compare Seminole County land cover in this article.
- Included Files: Use only the versions confirmed in the article and supplied images
- File Type: Use the confirmed download contents
- Intended Use: Printing, education, presentations, and map-based projects
Related Maps
- Alachua County Florida Land Cover Map
- Baker County Florida Land Cover Map
- Bay County Florida Land Cover Map
Green Map creates custom-edited map images using open geographic data sources such as geoBoundaries, Natural Earth, OpenStreetMap, and government open data.
These maps are edited visual materials, not raw data files, and are provided for education, documents, presentations, and graphic reference.