Sarasota County’s 2025 land-cover pattern is split sharply between a developed western side and a wetter, more agricultural interior. The supplied county summary places developed land first at 39.41%, followed by wetlands at 33.44%, agriculture at 12.47%, forest at 6.50%, and water at 5.99%. Those percentages matter, but the map makes an equally important point: the largest classes occupy different parts of the county rather than being evenly mixed everywhere.
This page includes four related views—2025 land cover, forest and farmland, impervious surface with developed land, and a 1985–2025 class-difference map. The WebP images are intended for on-page comparison, and the four original JPG maps are packaged together in one download below. They are useful for county profiles, classroom exercises, presentations, and broad environmental comparisons.
Table of Contents
A county divided between a developed west and a wet interior
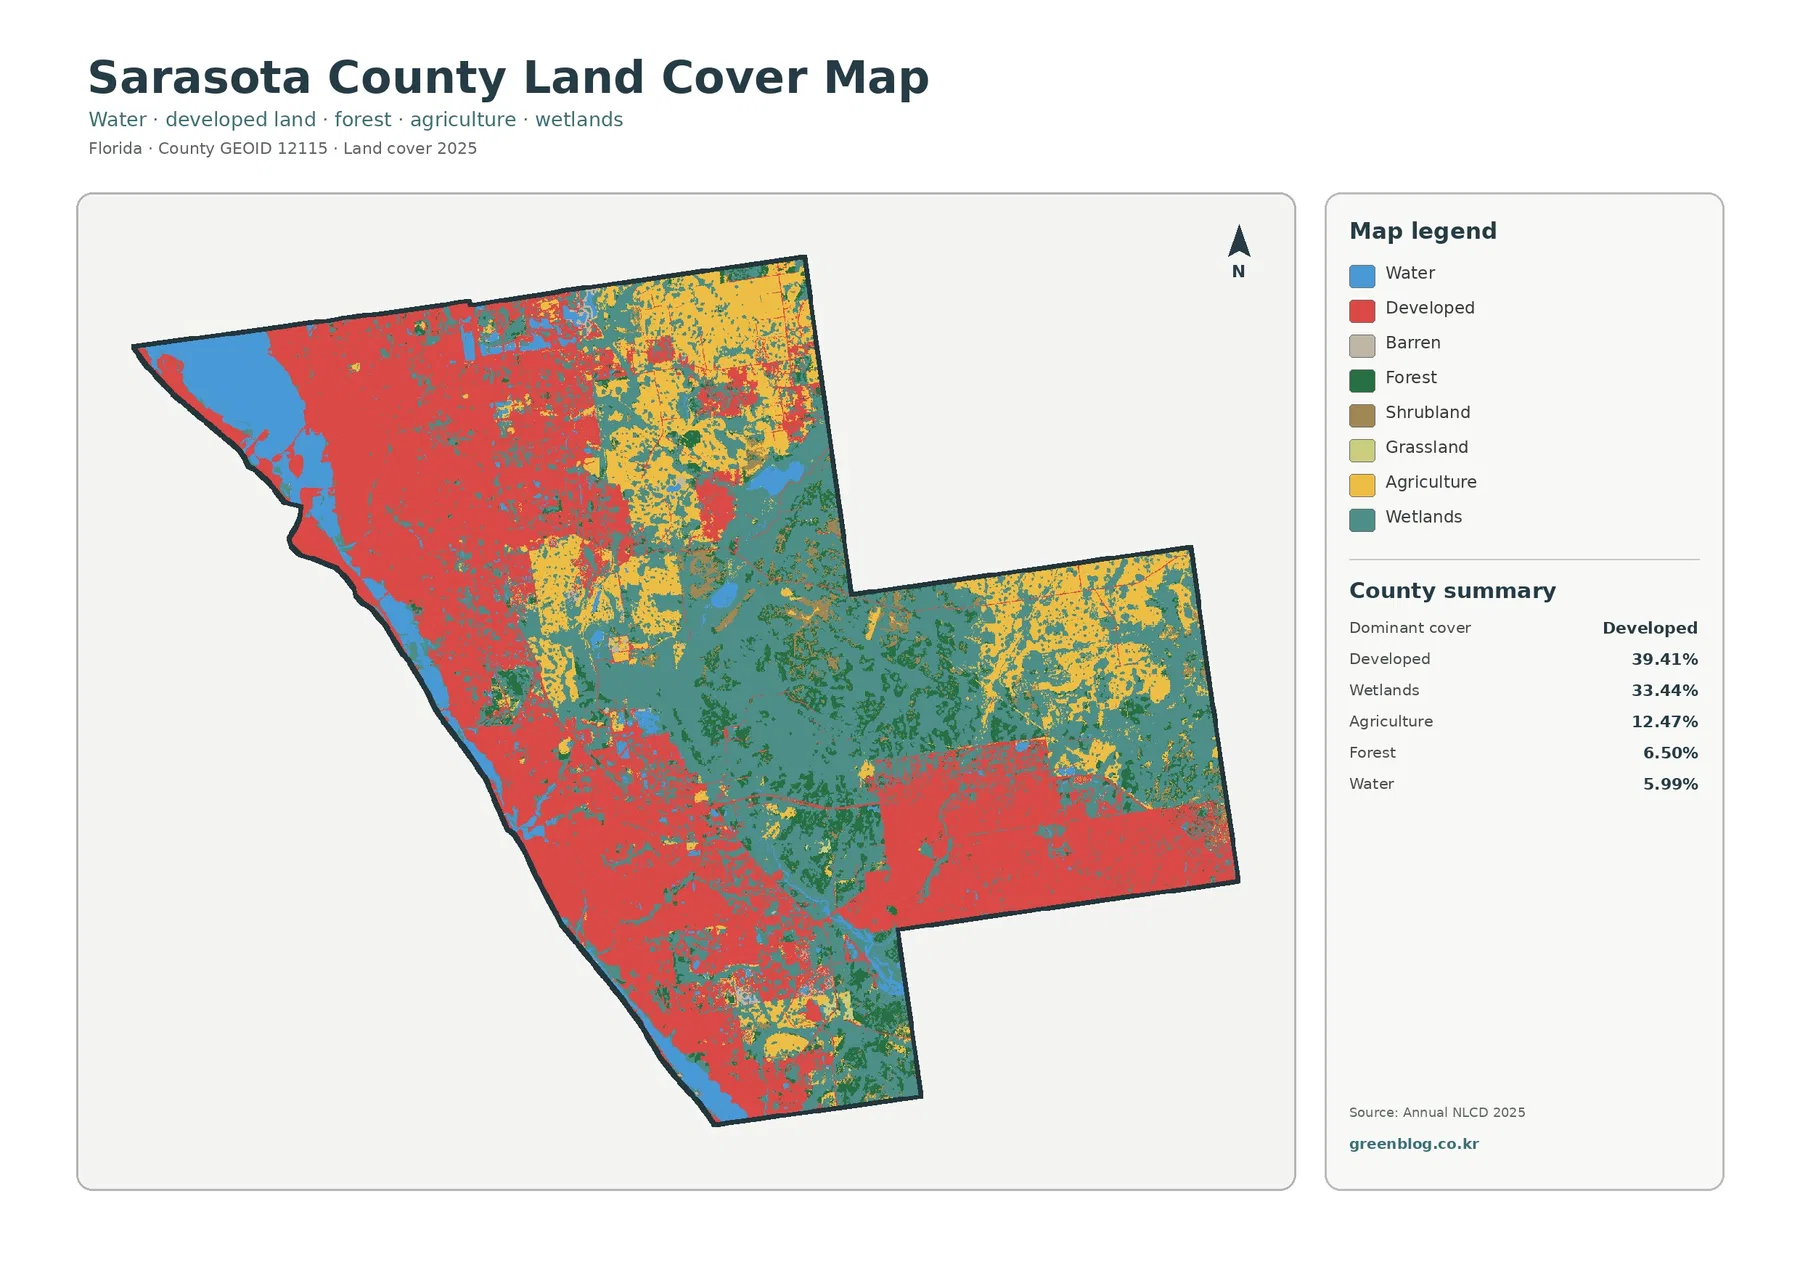
Red developed cover dominates much of the western half, extending from the northwest toward the southwest and appearing again across the southern part of the county. The central interior changes abruptly: teal wetland cover becomes much more common, while yellow agricultural areas stand out farther east and northeast. This contrast is clearer than a simple ranked list of percentages because the main classes are geographically separated.
Developed land and wetlands together account for most of the supplied 2025 summary, at 39.41% and 33.44% respectively. Their similar scale does not mean they have similar shapes. Development is concentrated, especially in the west, whereas wetlands form broad interior areas and many connected patches. A reader comparing counties should therefore consider both the percentage and the arrangement of each class.
Agriculture is the third-largest reported class at 12.47%. It is especially noticeable in the northeast and in the eastern extension of the county, with additional areas closer to the center. Forest covers 6.50% and appears as smaller green areas among wetland and agricultural cover. Water accounts for 5.99%, including the large blue area along the western edge and several inland water bodies.
Land cover is not the same as zoning, ownership, or a legal land-use designation. Annual NLCD classifies what is covering the ground at the mapped scale. A developed cell may contain pavement, roofs, lawns, trees, and open soil, while a wetland class does not automatically define a regulatory wetland boundary. Parcel decisions require parcel, survey, permitting, and planning records rather than this countywide map.
The vegetation view brings agricultural blocks into focus
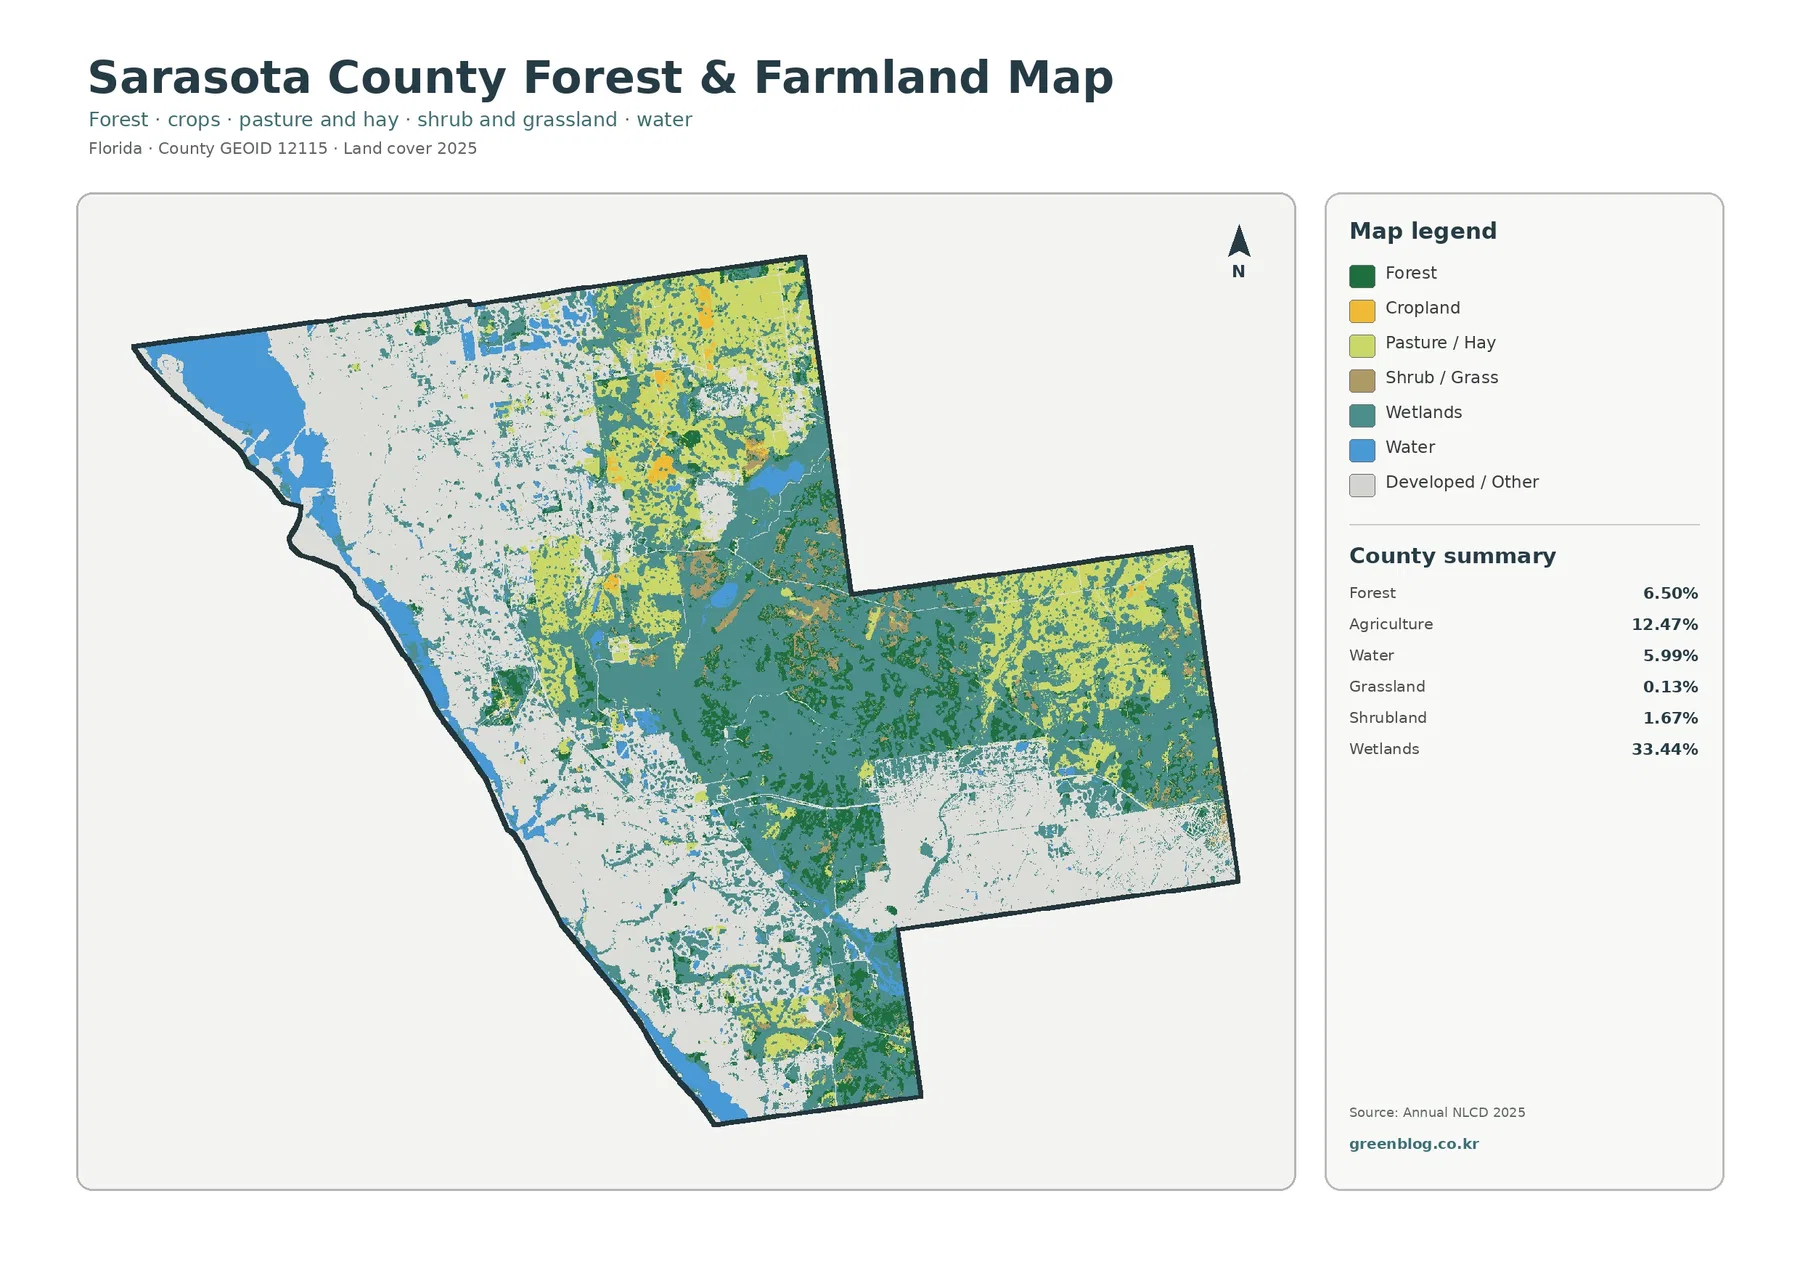
Removing most of the developed colors from the foreground changes what stands out. Agricultural cover becomes easier to trace across the northeast and eastern side, while the central wetland area remains visually dominant. Forest is present in many smaller pieces rather than one countywide block, often near wetland margins and among agricultural areas.
The supplied summary combines agriculture into a 12.47% total. The map legend separates cropland from pasture or hay, but no verified countywide percentage is supplied for those two categories individually. The correct use is to compare their locations visually, not to estimate a new statistical split from the colored pixels.
Grassland is reported at only 0.13% and shrubland at 1.67%. They can still matter locally where they occur between larger classes, but neither should be described as a major countywide cover type. Small pieces near class boundaries also deserve caution because the source is a raster classification: each cell receives a representative category even when the real ground contains a mixture of vegetation, soil, water, and built surfaces.
Sarasota County’s official Natural Resources page discusses coasts, estuaries, forests, swamps, lakes, hammocks, and wetlands as parts of the local environment. That county-specific context is useful when explaining why wet and vegetated classes matter here. It should not be used to label every green or teal cell as protected land, however; conservation boundaries and land-cover categories answer different questions.
Impervious cover reveals development intensity rather than development area
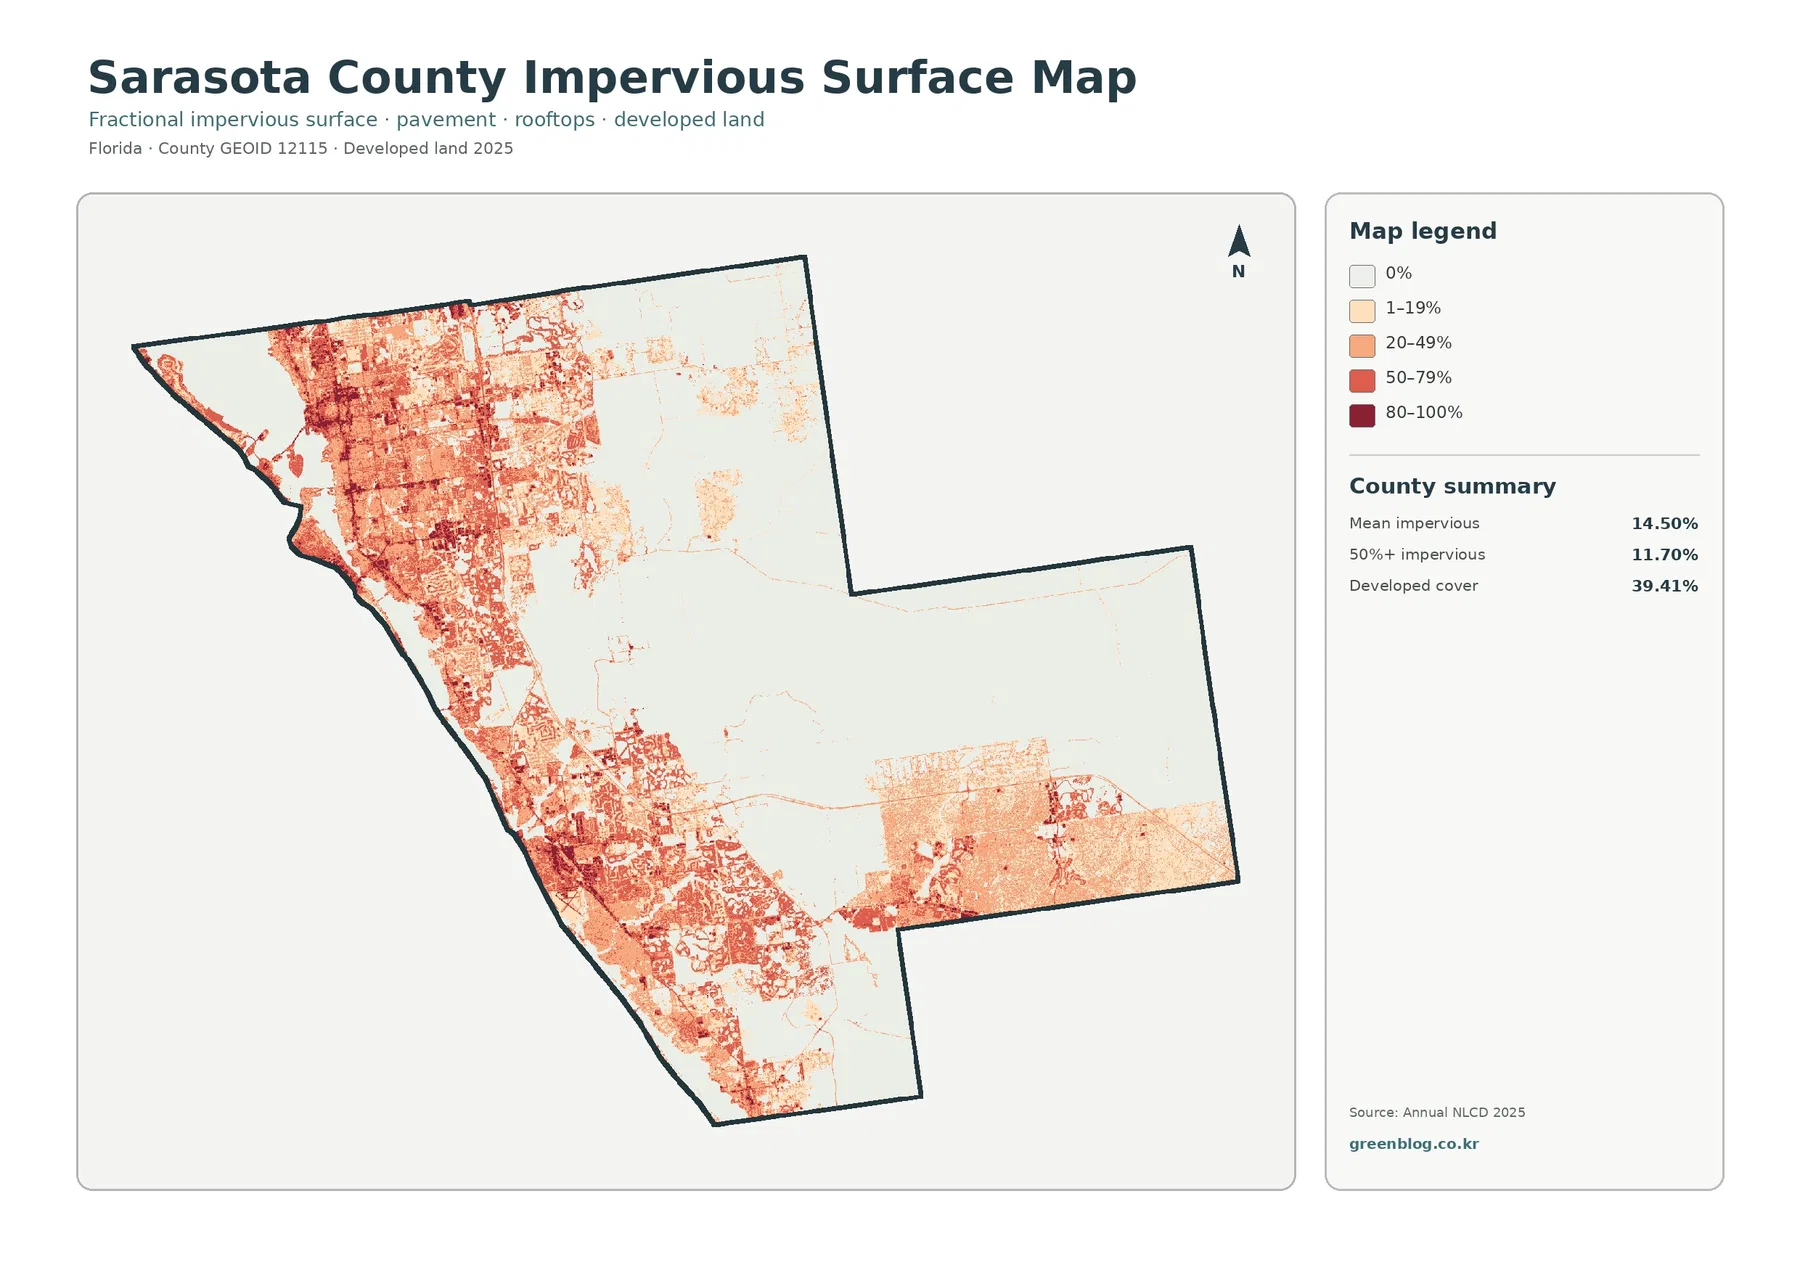
Mean impervious cover is 14.50% across the county, and 11.70% of the area is mapped at 50% or greater impervious surface. The darker values cluster heavily in the west and southwest, broadly overlapping the developed side of the general land-cover map. Much of the central and eastern interior remains near the light end of the scale.
The 14.50% mean should not be compared with the 39.41% developed share as though one of the figures is wrong. They measure different things. A developed land-cover cell can contain grass, trees, yards, bare soil, or other permeable ground in addition to roads and structures. Impervious data isolate the portion occupied by surfaces such as roofs, pavement, and parking areas.
Some thin high-value lines resemble transportation routes, but this is not a road map. It does not identify route names, traffic volume, lane count, or pavement condition. Likewise, low impervious cover does not prove low flood risk. Rainfall, drainage, soil, elevation, and connections to wetlands or waterways must be examined with separate sources.
For presentations, pairing the general land-cover image with the impervious map is more informative than using either one alone. The first shows how much of the county is classified as developed; the second shows where hard surfaces are most concentrated. That distinction helps explain why a developed area can still contain a large amount of vegetation and other permeable ground.
The 1985–2025 comparison is a map of class differences, not a damage total
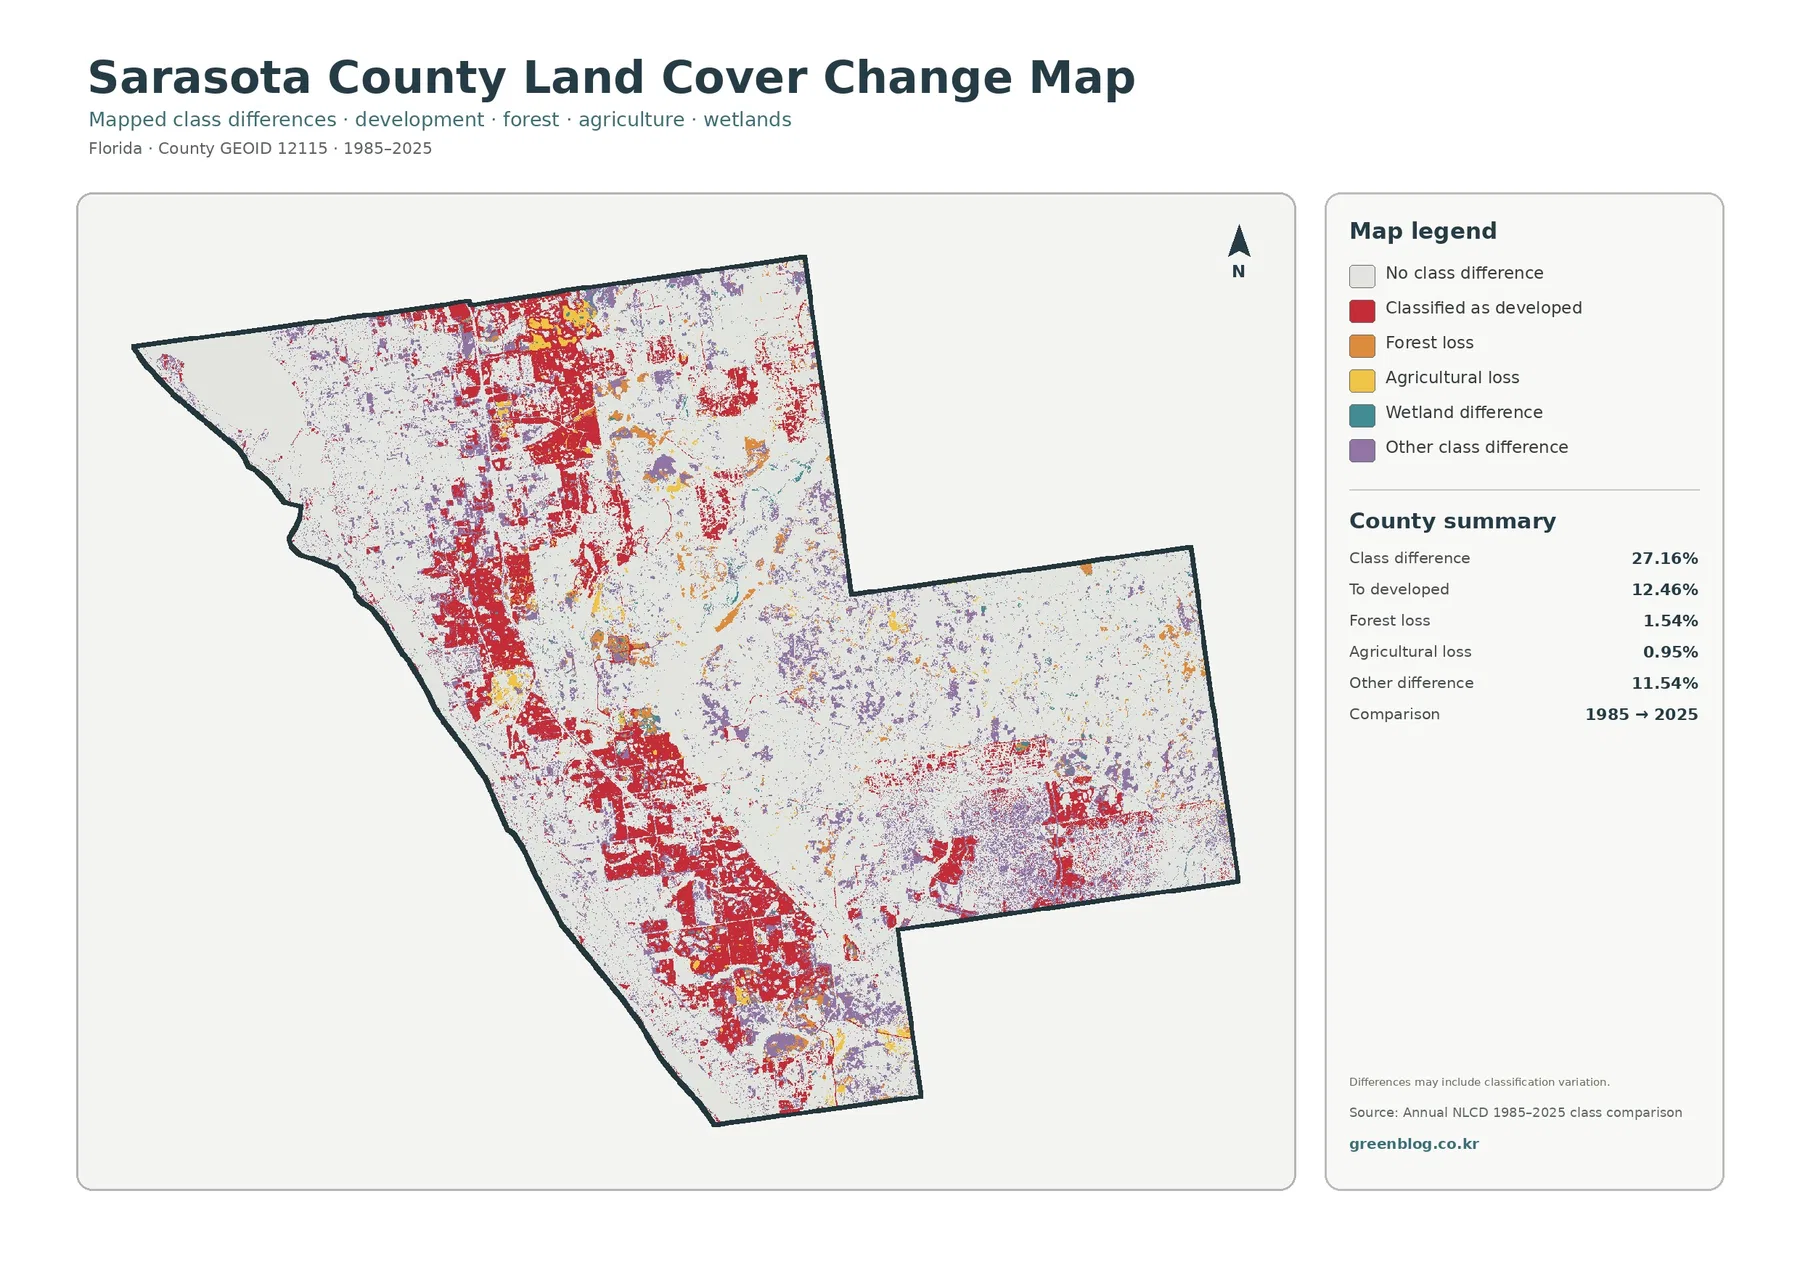
The supplied comparison reports a total class difference of 27.16%. That number should not be rewritten as “27.16% of Sarasota County was physically transformed.” The map explicitly notes that classification variation may be included. Differences can reflect real change, but imagery, seasonal conditions, class rules, and mixed pixels can also affect how a cell is labeled at two dates.
Cells highlighted as changing to developed cover account for 12.46%, the largest named change category in the summary. Red areas are extensive in the western and southwestern parts of the county and also appear in the northwest interior. This figure is not interchangeable with the current 39.41% developed share: one describes the 2025 condition, while the other describes a category in the two-date comparison.
Forest loss is reported at 1.54% and agricultural loss at 0.95%. Other class differences make up 11.54%. Wetland difference is shown in the legend, but the package does not provide a separate verified percentage for it. It is reasonable to discuss where the teal marks occur; it is not reasonable to invent a percentage by estimating the colored area on the preview.
The comparison works best as a screening layer. A dense cluster of change symbols can identify a place worth examining with intermediate imagery, local planning records, or other historical data. The map alone cannot say whether a specific change was caused by construction, land management, storms, drainage, agricultural decisions, or another process.
Three comparisons make the four-map set easier to use
First, compare developed land with impervious surface. The county is 39.41% developed in the 2025 summary, but its mean impervious value is 14.50%. That gap is a practical reminder that “developed” is a broad land-cover class, not a synonym for fully paved ground.
Second, compare wetlands with open water. Wetlands cover 33.44%, while water is 5.99%. A wetland can be vegetated and seasonally saturated without appearing as an open blue water body. Treating the two classes separately gives a much better picture of the county’s wet environment.
Third, compare the current map with the change map. The 2025 image answers “what class is mapped here now?” The 1985–2025 image answers “where do the two classifications differ?” Keeping those questions separate prevents a change symbol from being mistaken for a present-day land-cover class.
Good uses range from classroom work to county-scale comparison
For a county profile or opening presentation slide, start with the 2025 overview. It places the major classes in one frame and makes the west-to-interior contrast obvious. If the discussion turns to farming or vegetation, follow with the forest-and-farmland view. If the question is development intensity, use the impervious map rather than relying on the developed class alone.
A classroom activity can ask students to explain why developed land and wetlands have fairly similar percentages but occupy different parts of the map. Another exercise can compare the 12.47% agricultural share with its eastern concentration, then ask how the same area looks when developed cover is visually reduced in the vegetation map. These tasks connect numbers to location instead of turning the legend into a list to memorize.
For environmental discussion, the 14.50% mean impervious value and 11.70% area above 50% impervious cover are useful descriptive measures. They should not be presented as direct measures of water quality, flood hazard, habitat quality, or regulatory status. Those topics require additional datasets and, in many cases, site-specific analysis.
Cross-county comparisons should use the same year and classification system. Comparing Sarasota County’s 2025 Annual NLCD percentages with a different county from another year may mix real landscape differences with dataset changes. A fair comparison uses common observation dates and looks at spatial arrangement as well as percentages.
Scale and observation date set clear limits
Annual NLCD is a raster product, meaning the landscape is represented by a grid of cells. A real cell can contain trees, pavement, water, grass, and bare ground at the same time, but the map simplifies that mixture into a class or, for impervious data, a percentage. Boundaries between wetlands, developed land, fields, and forest should therefore be read as generalized rather than surveyed lines.
Enlarging the JPG makes the image easier to view but does not create finer source detail. Narrow channels, small buildings, thin vegetation strips, and parcel boundaries can be generalized or absent. These maps are suitable for county-scale explanation and comparison, not for property surveys, legal wetland determinations, zoning decisions, or building-permit conclusions.
The main map represents the supplied 2025 classification. Changes after that observation year may not appear. The change map is also a two-date comparison rather than a year-by-year history. A location could change several times between 1985 and 2025 and still end with a class similar to its starting condition.
Sarasota County’s Comprehensive Planning material is a useful companion when a reader needs official future land-use or planning information. It should remain separate from the land-cover maps here. Planning designations describe policy and allowable use, while the Annual NLCD layers describe mapped surface cover.
What is included in the map download
The ZIP contains the four original JPG files used for this article: the 2025 land-cover map, forest-and-farmland map, impervious-surface and developed-land map, and the 1985–2025 class-difference map. Each source JPG is 2480 × 1754 pixels. The package manifest does not mark these files as meeting the A3 high-resolution reference, so they are described by their actual dimensions rather than promoted as A3 300-dpi originals.
Choose one map as the main figure and add a second only when it answers a different question. The general map is best for overall composition, the vegetation view for forest and agricultural placement, the impervious image for hard-surface intensity, and the change map for two-date screening.
Frequently Asked Questions
What is the largest land-cover class in Sarasota County?
Developed land is the largest class in the supplied 2025 summary at 39.41%, followed by wetlands at 33.44%. Agriculture accounts for 12.47%, forest 6.50%, and water 5.99%. The map also shows that development is concentrated mainly in the west while wetlands occupy much of the interior.
Why is developed cover 39.41% when mean impervious cover is 14.50%?
Developed land can include lawns, trees, soil, and other permeable surfaces along with roofs and pavement. Impervious cover measures the hard-surface fraction more directly. Because the two metrics describe different aspects of the ground, the countywide impervious average can be far lower than the developed-land share.
Does the 27.16% class difference mean that 27.16% of the county was physically changed?
No. It is the share of cells classified differently in the 1985 and 2025 comparison, and the map warns that classification variation may be included. The supplied change summary reports 12.46% to developed, 1.54% forest loss, 0.95% agricultural loss, and 11.54% other difference. Determining the cause of a specific change requires additional evidence.
Sources and Reference Data
- MRLC Annual NLCD Data — source data for the supplied 2025 land-cover and 1985–2025 comparison views.
- USGS Annual NLCD Land Cover Classification — definitions for developed, forest, agricultural, wetland, water, and related classes.
- U.S. Census Bureau TIGER/Line Shapefiles — official geographic reference for county boundaries.
- Sarasota County Natural Resources — county information on local coasts, estuaries, forests, swamps, lakes, hammocks, and wetlands.
- Sarasota County Comprehensive Planning — official planning information useful for distinguishing policy land-use designations from mapped surface cover.
Map File Information
The ZIP contains the four original JPG land-cover maps used in this Sarasota County article.
- Included Files: Use only the versions confirmed in the article and supplied images
- File Type: Use the confirmed download contents
- Intended Use: Printing, education, presentations, and map-based projects
Related Maps
- Alachua County Florida Land Cover Map
- Baker County Florida Land Cover Map
- Bay County Florida Land Cover Map
Green Map creates custom-edited map images using open geographic data sources such as geoBoundaries, Natural Earth, OpenStreetMap, and government open data.
These maps are edited visual materials, not raw data files, and are provided for education, documents, presentations, and graphic reference.