Liberty County is a wetland-dominated inland Panhandle county with very little hard-surface development. Wetlands account for 55.27% of the 2025 land-cover summary, while forest contributes another 28.10%. Developed land is only 4.20%, and agriculture is 1.84%. The clearest countywide pattern is therefore not an urban center or farm belt, but a broad natural landscape where wetlands and forest occupy most of the mapped area.
The page includes four views: 2025 land cover, forest and farmland, impervious surface, and a 1985–2025 class comparison. The WebP images are intended for on-page viewing, and the four original JPG maps are bundled in one ZIP download below. Together they are useful for comparing natural cover, small settlement areas, roads, and places where the two endpoint years received different land-cover classes.
Table of Contents
Wetlands cover more than half of the county
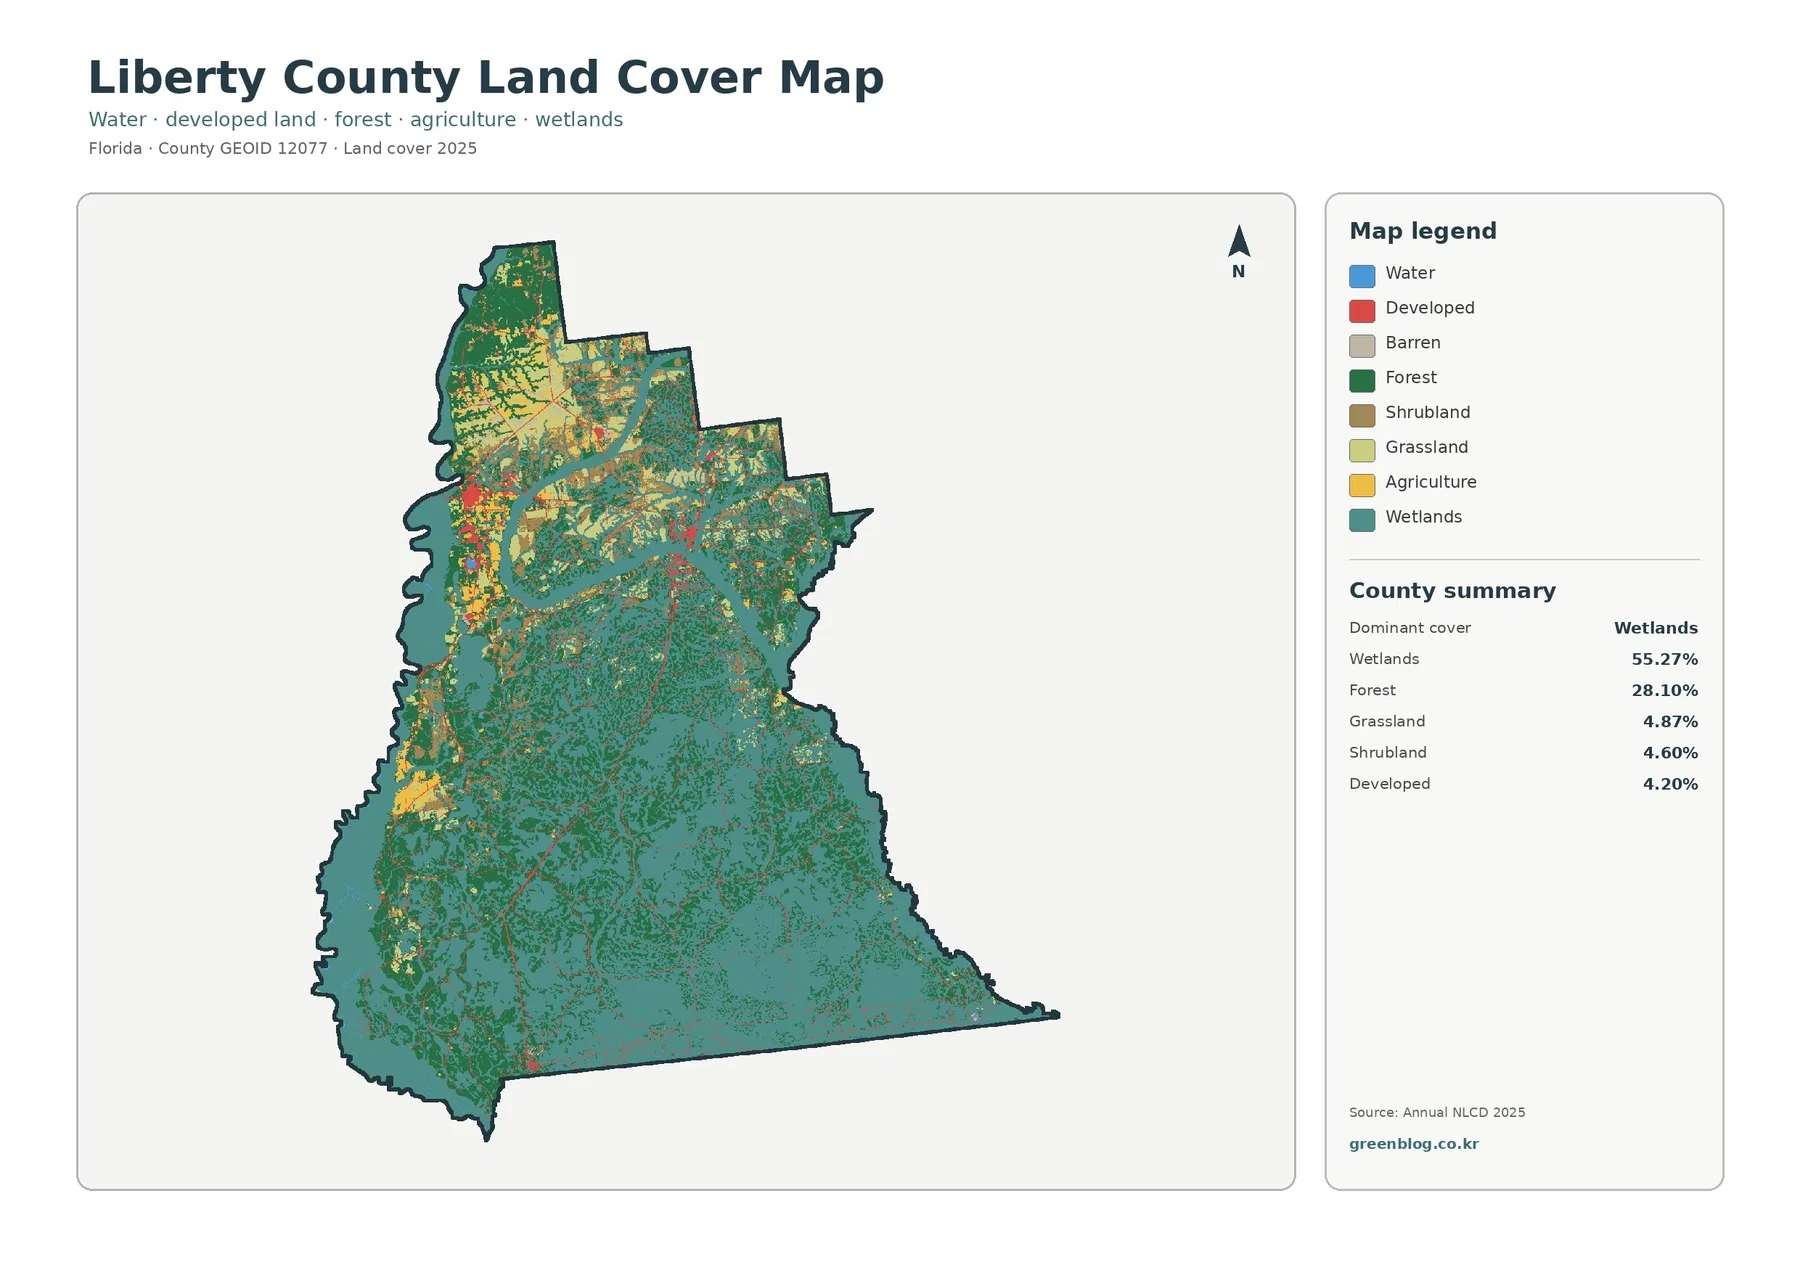
Teal wetland cover dominates the center and south and remains common in the east and west. The 55.27% county summary is immediately visible in the large continuous and semi-continuous wetland areas. Northern Liberty County is more varied, with forest, shrubland, grassland, small agricultural patches, and developed locations breaking up the wetland pattern.
Forest is the second-largest category at 28.10%. Dark green appears across the county but is especially noticeable in the north and central portions, with additional wooded areas embedded in the southern wetland landscape. Forest and wetlands repeatedly touch, which makes the county look more like a mixed natural system than two separate zones.
Grassland accounts for 4.87%, shrubland for 4.60%, and developed land for 4.20%. Agriculture is only 1.84%, while water is 0.74%. The smaller classes are most noticeable in the northern half, where the map contains more color variation. Developed areas appear as compact patches and narrow road-related traces instead of a broad urban footprint.
Liberty County’s official website emphasizes the Ochlockonee River, Apalachicola River, Telogia Creek, Lake Mystic, and Camel Pond, along with large natural areas such as the Apalachicola National Forest and Tate’s Hell State Forest. Those named features provide useful context for a map where wetlands and forest dominate. The land-cover colors, however, are not legal park, forest, or wetland boundaries.
Very low impervious cover separates settlement footprints from the county’s broader landscape
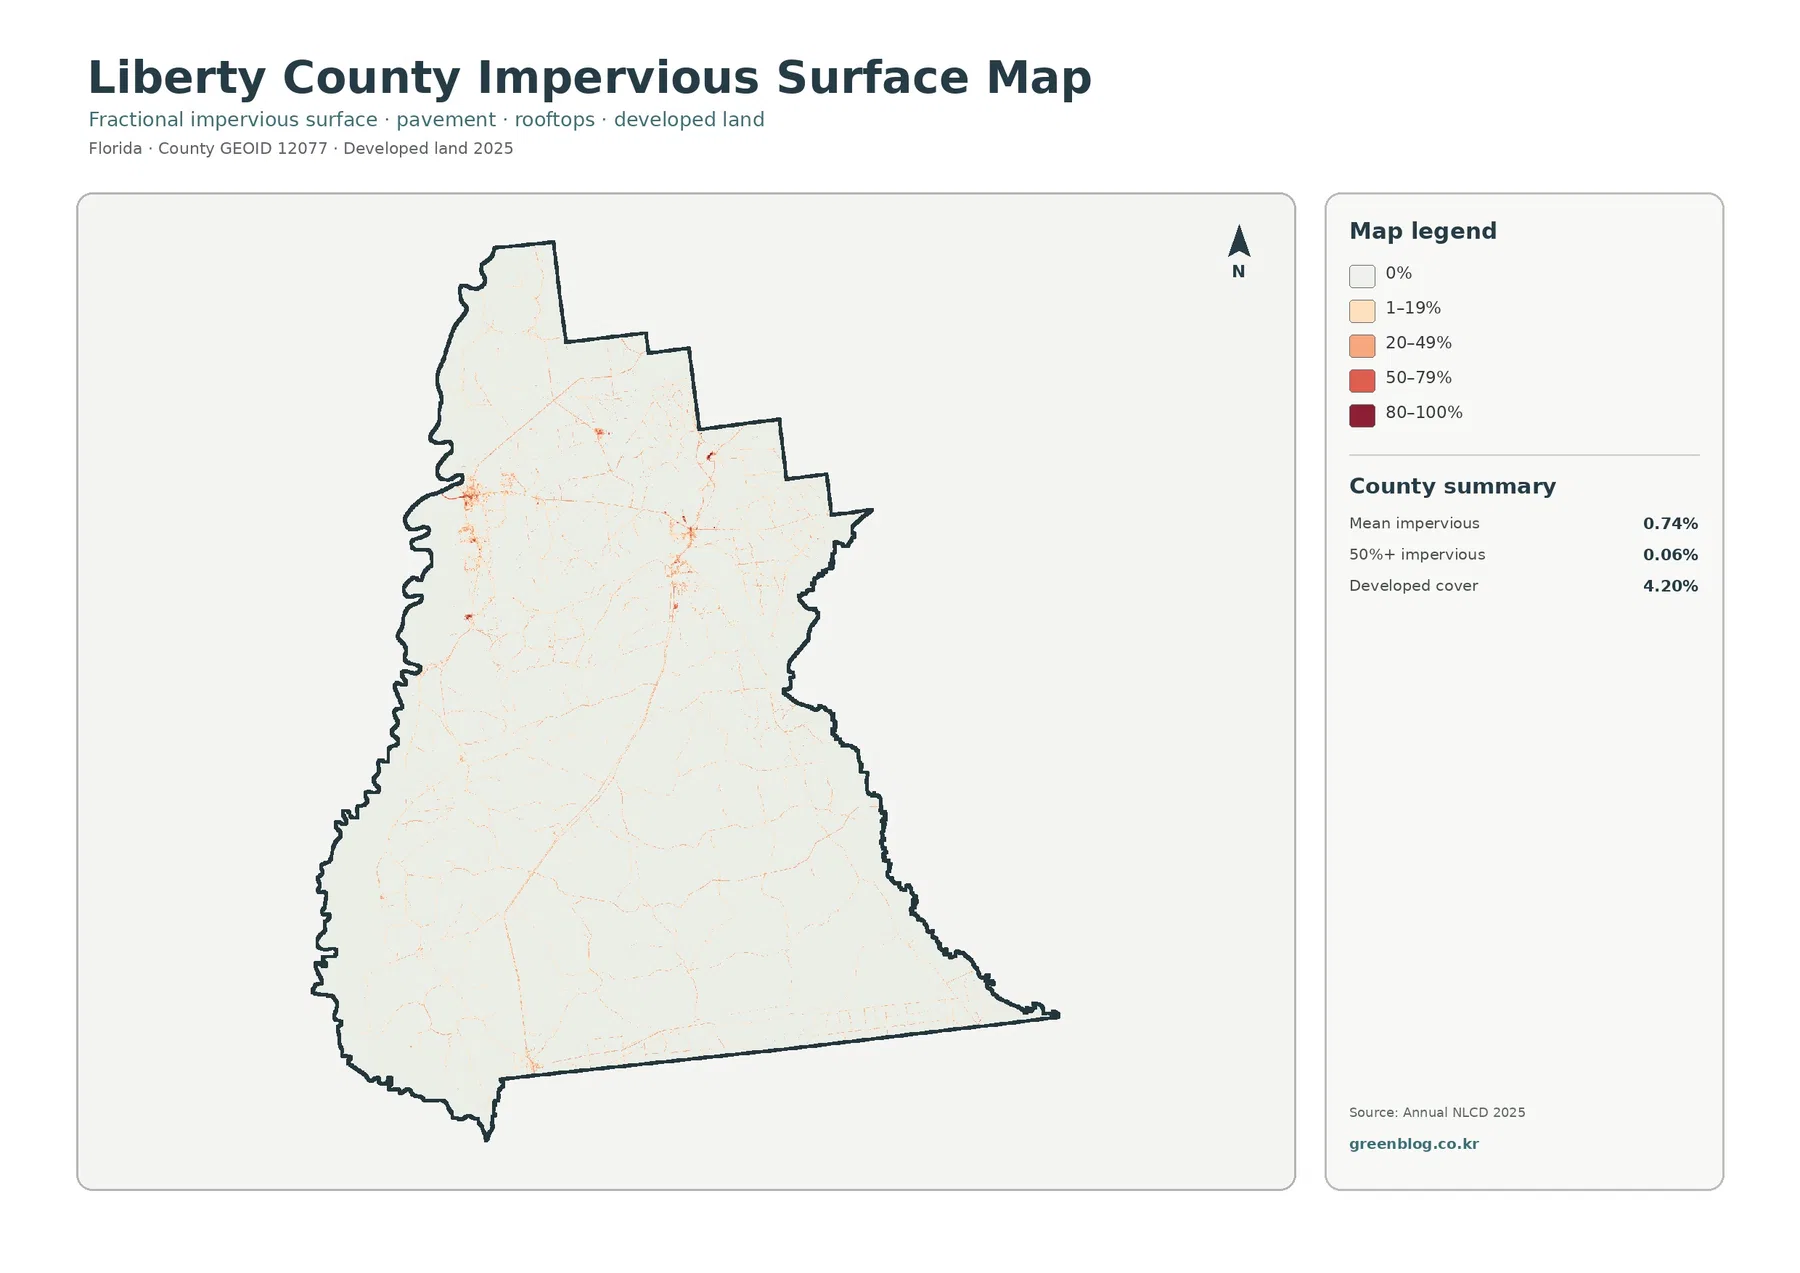
Impervious surface means hard cover such as pavement, parking areas, and rooftops that does not readily absorb rainfall. Liberty County’s mean impervious value is 0.74%, and only 0.06% of the county is mapped at 50% or greater imperviousness. Those are unusually small shares within this map set and help explain why most of the impervious preview appears almost white.
Higher values are confined to a few northern and northwestern settlement clusters and to thin road lines. The central and southern parts contain very little high-intensity impervious cover. Developed land is 4.20%, but even developed classes can include lawns, trees, bare soil, and other permeable surfaces, so the developed percentage is expected to be higher than the direct hard-surface measure.
UF/IFAS Extension Liberty County notes that its office is in Bristol along the Apalachicola River. That verified location is useful as a reference point for the county’s northern settlement pattern, although this raster map is not designed to draw town boundaries. It simply shows where hard surfaces are relatively concentrated.
Low impervious cover should not be interpreted as an absence of flood or drainage concerns. Wetlands and river corridors are extensive, and water behavior also depends on elevation, rainfall, soils, stream levels, and drainage infrastructure. This layer is best used to identify hard-surface concentration rather than to predict flooding or determine development permits.
The forest-and-farmland view reveals how different northern Liberty County is from the south
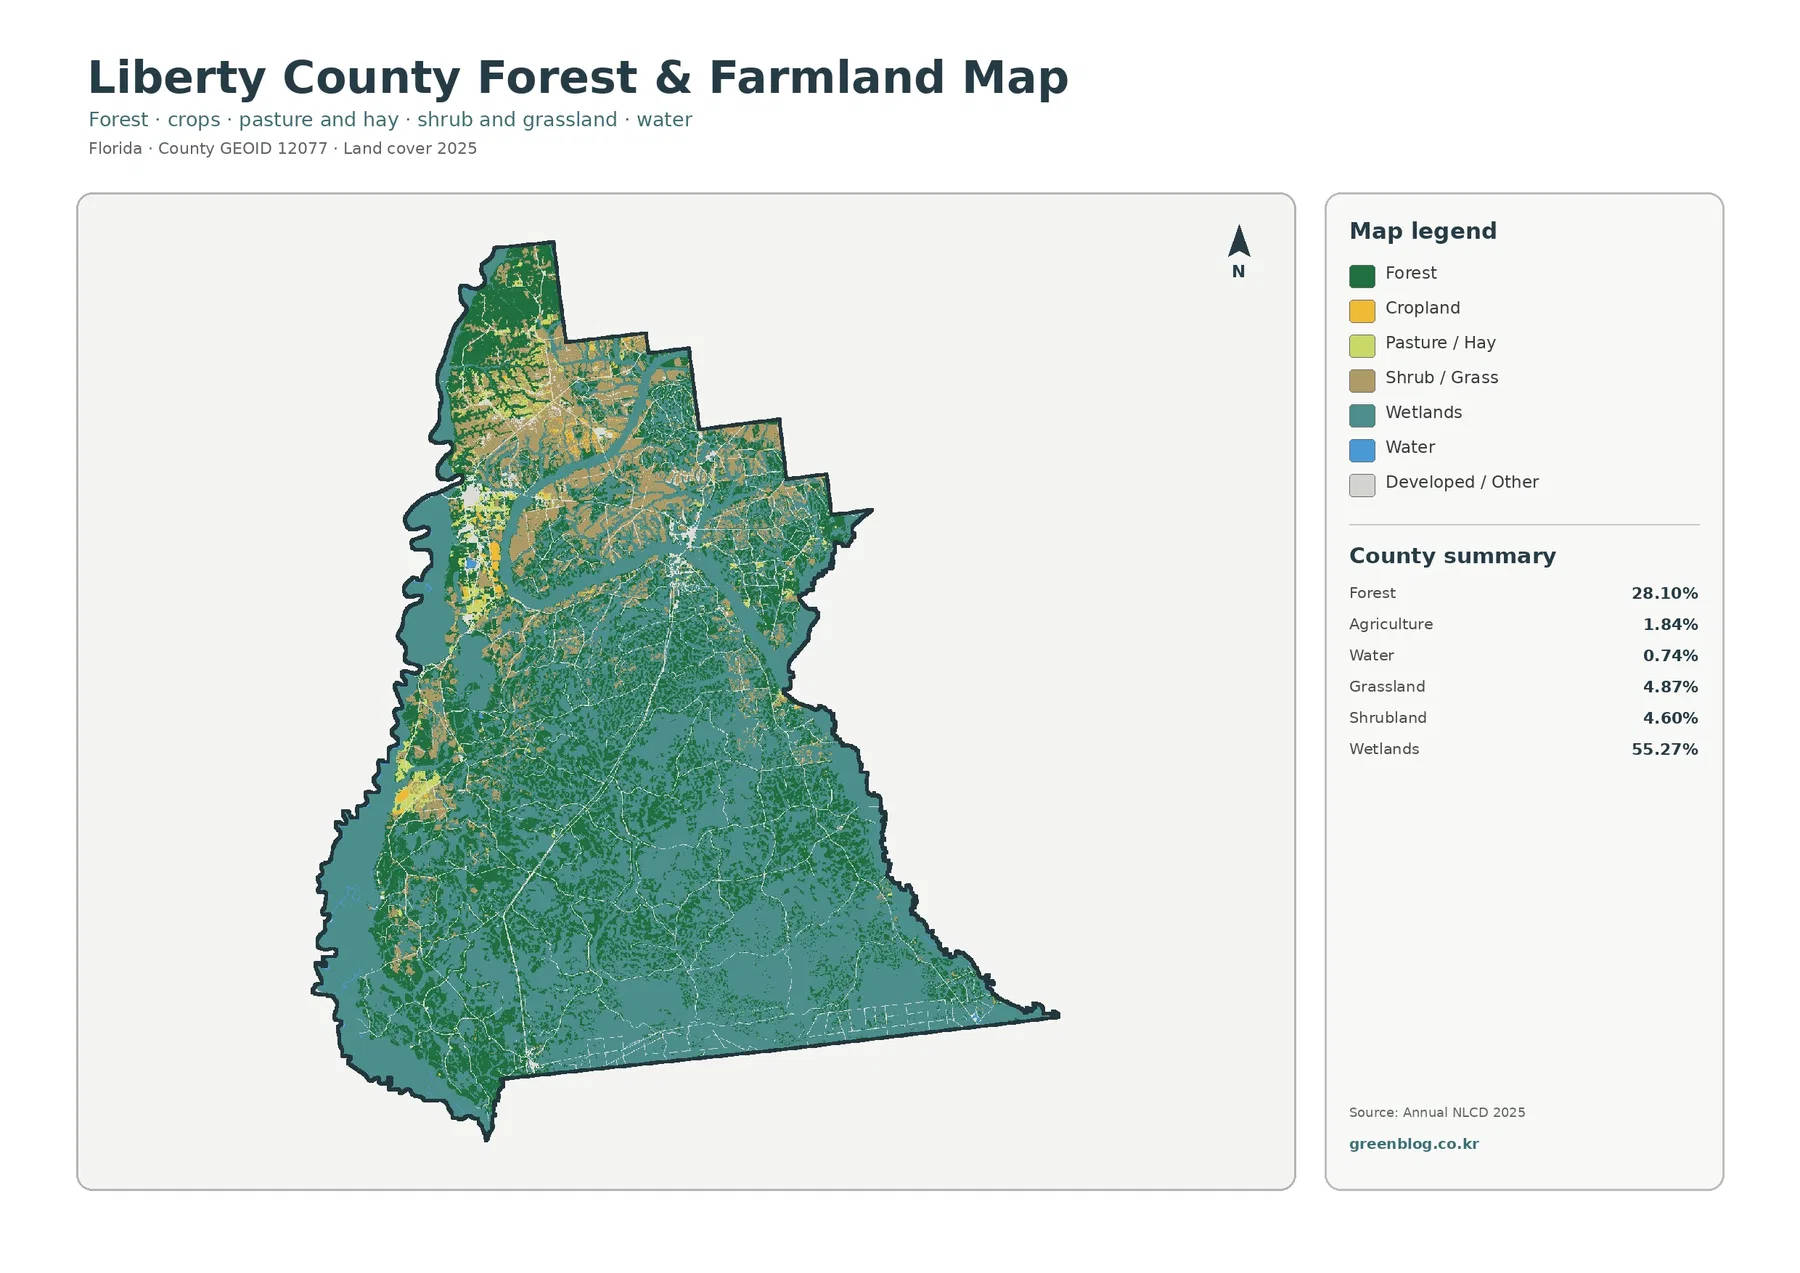
When developed and other classes are simplified, the north becomes the most diverse part of Liberty County. Forest, wetlands, grassland, shrubland, and a small amount of agriculture appear close together. Farther south, wetlands become much more continuous, with forest embedded in and around the larger teal areas.
Agriculture is only 1.84%, so yellow cropland patches are limited and do not define the county’s overall pattern. UF/IFAS Extension Liberty County includes agriculture and natural resources among its local subject areas, but that local service should not be confused with a statement that farming occupies a large share of the county. The map’s verified percentage remains the appropriate countywide measure.
Forest, by contrast, is substantial enough to shape nearly every section of the map. The county’s official website describes extensive natural lands, including the Apalachicola National Forest. A Liberty County long-term recovery plan also states that more than half of the county is part of that national forest. That official background helps explain why forest and wetland cover are central themes, though the land-cover forest class does not equal the national-forest boundary.
For a classroom or presentation, this simplified map is useful after the general land-cover view. The general map establishes the 55.27% wetland dominance, while the forest-and-farmland version makes the smaller agricultural areas and forest distribution easier to compare. Keeping the legend visible is important because shrubland and grassland are much smaller and can be overlooked in a reduced preview.
The 1985–2025 comparison contains more forest and other-class differences than development
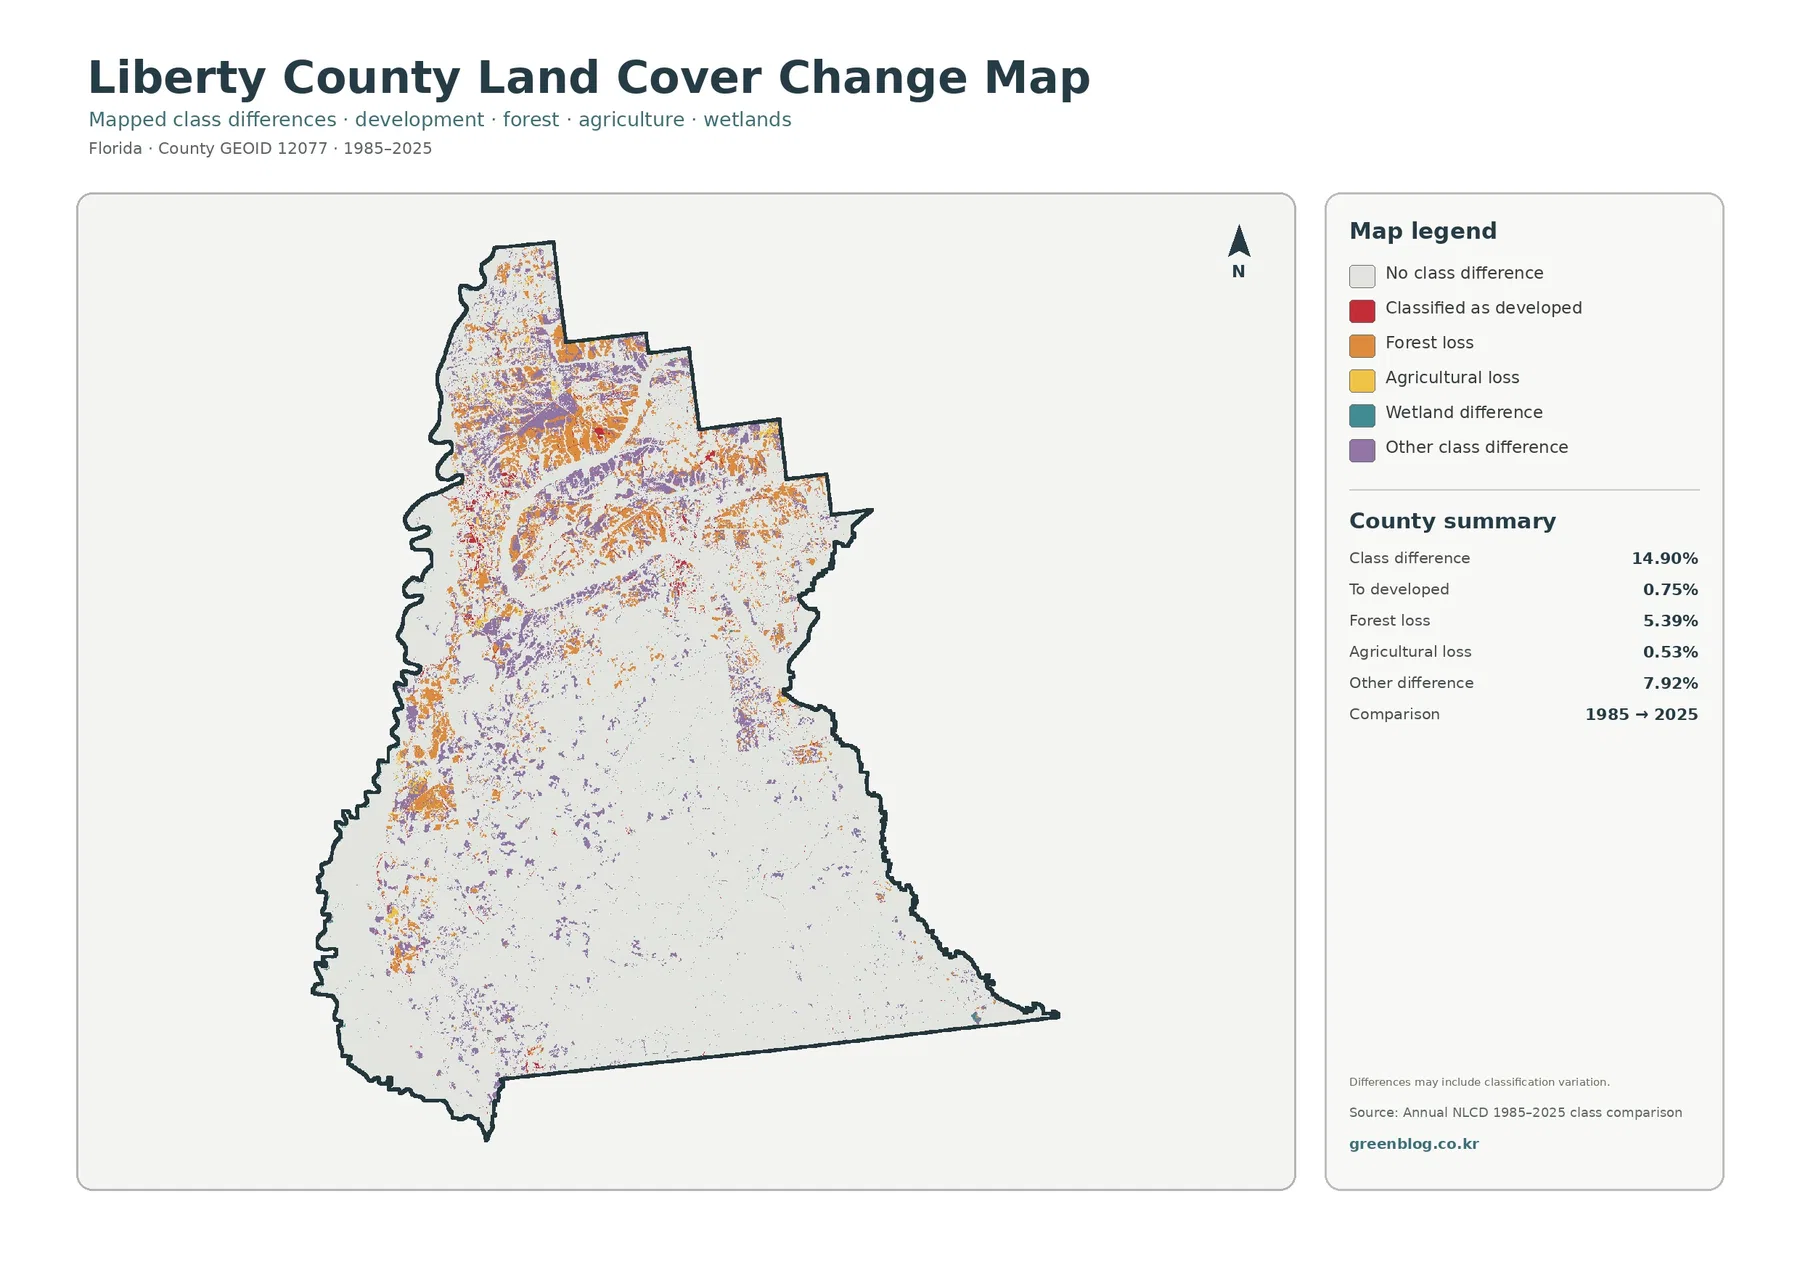
The endpoint comparison reports class differences across 14.90% of Liberty County. Forest loss accounts for 5.39%, transition to developed for 0.75%, agricultural loss for 0.53%, and other class differences for 7.92%. The north contains the densest concentration of change colors, while much of the south remains comparatively light.
Orange forest-loss patches appear repeatedly across the north and portions of the central county. Purple other-class differences are also common in the northern half. Red developed transitions and yellow agricultural-loss areas are much smaller, which fits the current map’s limited development and agriculture.
A note on the map states that the differences may include classification variation. The 14.90% figure therefore should not be treated as an exact physical land-change rate. Different imagery, mixed raster cells, seasonal conditions, and classification methods can assign different labels to the same location.
Only the 1985 and 2025 endpoints are shown. A place may have changed several times during the forty years between them, or the final class difference may reflect a classification issue rather than one simple landscape transition. Aerial photographs and additional Annual NLCD years are better choices when a specific location requires confirmation.
Rivers and large natural areas give the map useful local context
Liberty County’s official website describes the county as closely connected to land and water. It names the Ochlockonee River, Apalachicola River, Telogia Creek, Lake Mystic, and Camel Pond, and it highlights large natural areas including the Apalachicola National Forest and Tate’s Hell State Forest. Those references help connect the broad wetland and forest classes to the county’s actual environmental setting.
The same official material should not be used to turn this land-cover map into a management-boundary map. A forest-colored raster cell does not say who owns the land, whether it is inside a national forest, or which rules apply. A wetland-colored cell likewise is not a legal wetland determination.
The four-map set works best as a sequence. Begin with the general land-cover map to see the wetland-dominated county pattern. Use the forest-and-farmland view to compare northern diversity with southern wetlands, then check the impervious map to see how small the hard-surface footprint is. Finish with the change map to locate areas where 1985 and 2025 classifications differ.
Land cover describes what is physically visible or classified at the surface, such as forest, wetlands, agriculture, or developed ground. It does not provide parcel ownership, zoning, legal land use, or development rights. Property and permitting questions require separate county or agency records.
The download ZIP contains four 2480×1754 JPG files: 2025 land cover, forest and farmland, impervious/developed land, and the 1985–2025 class comparison. The original JPGs are more useful than the reduced WebP previews when a legend needs to be enlarged or a map needs to be placed into a report or presentation.
Annual NLCD products are raster maps, meaning the landscape is represented as a grid of cells. A cell receives a representative class or impervious value even though the real ground may contain several surfaces at once. The colored edges are therefore generalized and should not be treated as surveyed parcel boundaries.
Frequently Asked Questions
What is the largest 2025 land-cover category in Liberty County?
Wetlands are the largest category at 55.27%. Forest follows at 28.10%. Together they account for most of the county, while developed land is 4.20% and agriculture is only 1.84%.
Why is developed land 4.20% while mean impervious cover is only 0.74%?
The two measures describe different things. Developed land can include roads and buildings along with lawns, trees, and bare ground. Impervious cover measures hard surfaces such as pavement and rooftops more directly, so its countywide average is much lower.
Does the 14.90% 1985–2025 class difference equal the true land-change rate?
No. The map notes that classification variation may be included. Important locations should be checked with aerial imagery, additional land-cover years, or other records before a class difference is treated as a confirmed physical change.
Map File Information
Download the four original Liberty County land-cover JPG maps together in one ZIP file.
- Included Files: Use only the versions confirmed in the article and supplied images
- File Type: Use the confirmed download contents
- Intended Use: Printing, education, presentations, and map-based projects
Related Maps
- Alachua County Florida Land Cover Map
- Baker County Florida Land Cover Map
- Bay County Florida Land Cover Map
Sources and References
- MRLC Annual NLCD Data – Official source for Annual NLCD land-cover data.
- USGS Annual NLCD Land Cover Classification – Describes the principal Annual NLCD land-cover classes.
- U.S. Census Bureau TIGER/Line Shapefiles – Official geographic boundary data for county reference.
- Liberty County Board of County Commissioners – Official county background on rivers, lakes, forests, and other natural areas.
- UF/IFAS Extension Liberty County – Local agriculture and natural-resource information from the Liberty County Extension office.
Green Map creates custom-edited map images using open geographic data sources such as geoBoundaries, Natural Earth, OpenStreetMap, and government open data.
These maps are edited visual materials, not raw data files, and are provided for education, documents, presentations, and graphic reference.