Holmes County has a land-cover pattern that is much more balanced than a county dominated by a single urban or agricultural class. In the 2025 summary, forest is the largest category at 32.25%, but wetlands follow closely at 29.63% and agriculture accounts for another 21.54%. Those three classes appear throughout the county rather than separating into one simple east-west or north-south division.
This page brings together four views of the county: current land cover, forest and farmland, impervious surface, and mapped class differences between 1985 and 2025. The four original JPG maps are available together in one download below. They are useful for county-level comparison, classroom work, presentations, environmental background, and a first look at where developed surfaces are concentrated.
Table of Contents
A three-way mix of forest, wetlands, and agriculture defines the 2025 map
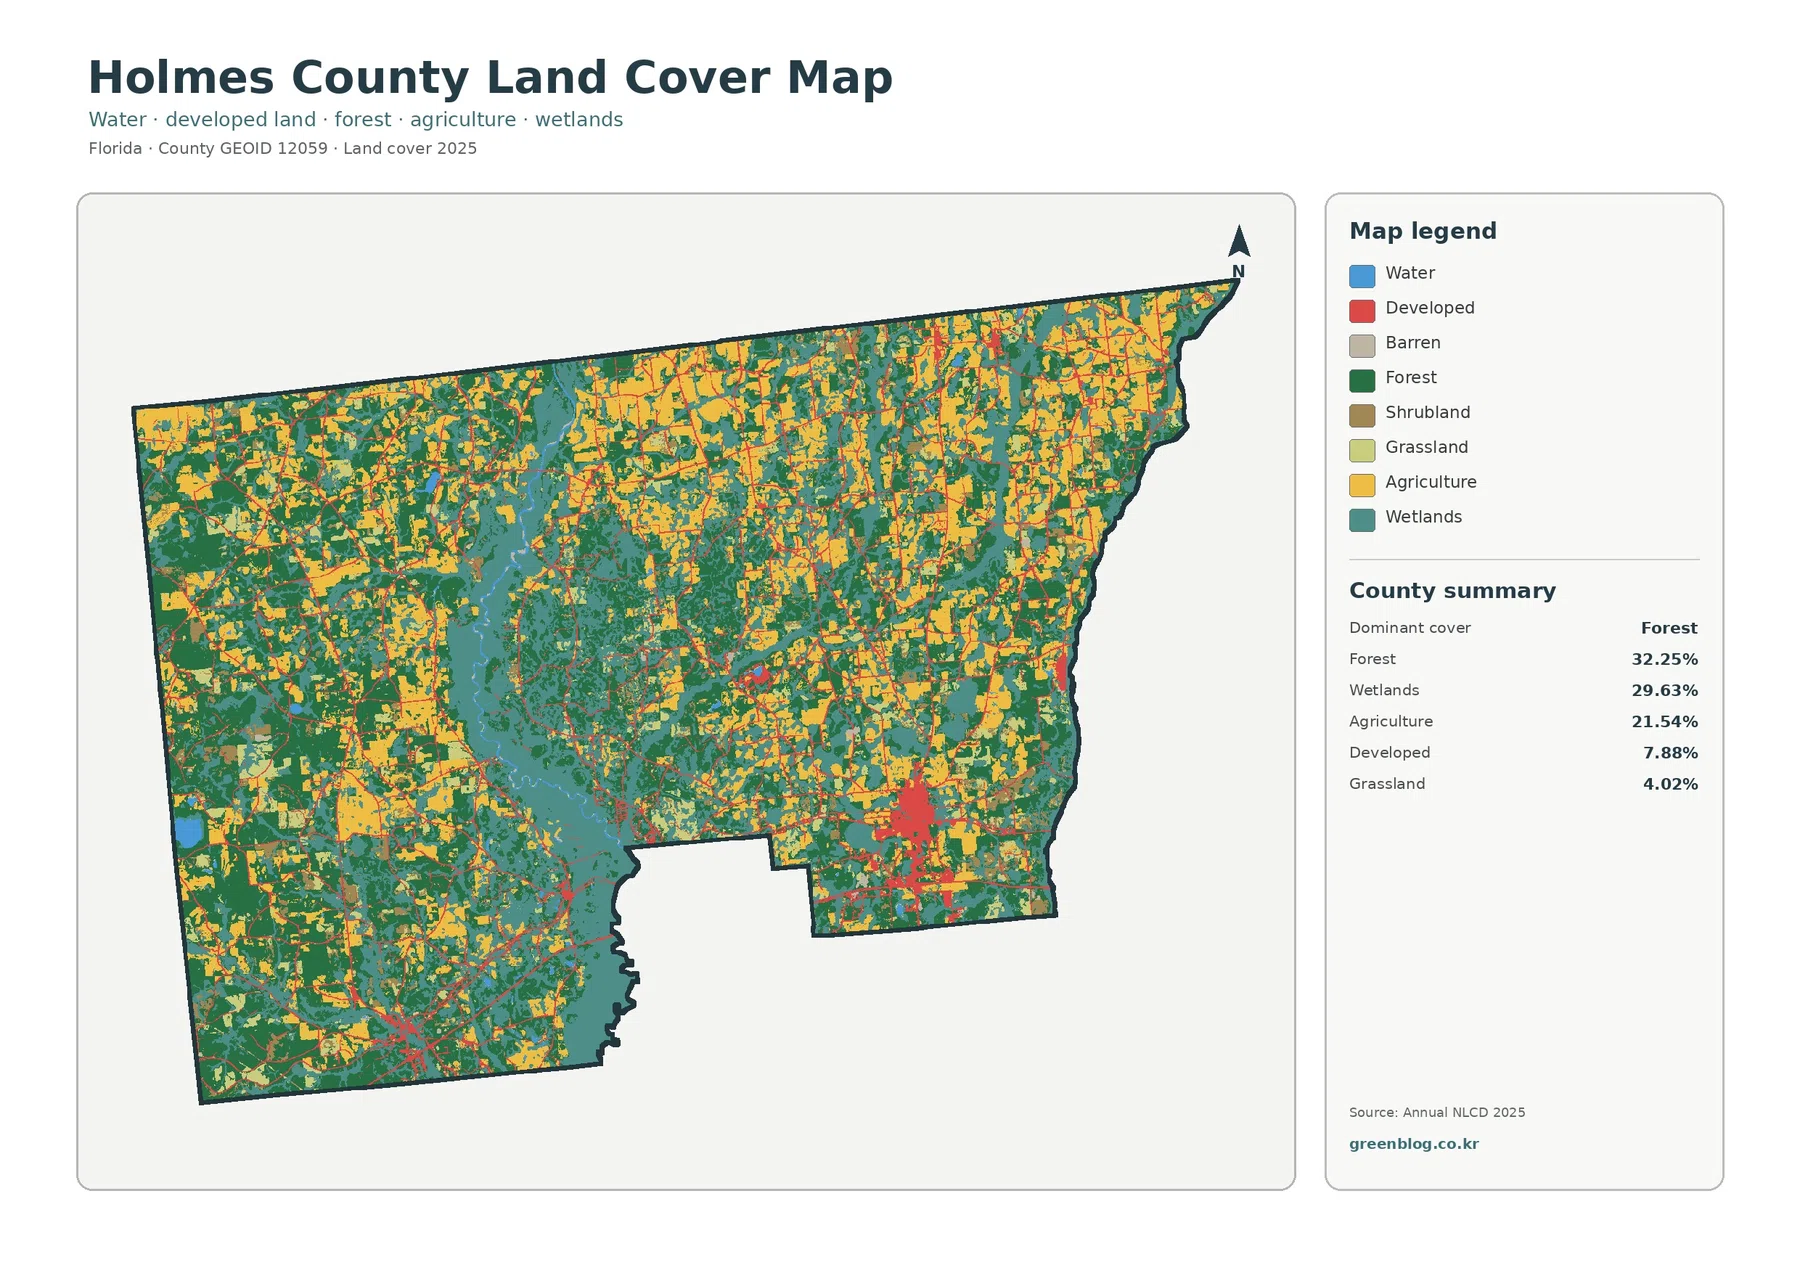
Forest is the largest class, yet the map does not show one continuous block of woodland covering most of Holmes County. Green areas are spread across the west, north, center, and east, with farmland and wetlands repeatedly appearing between them. That distribution matters because the 32.25% countywide figure describes total area, not a single forested zone.
Wetlands occupy 29.63%, only a few percentage points behind forest. The teal areas are especially prominent through the central portion of the county and in several broad sections toward the west and south. Some wetland areas lie next to visible water, while others are surrounded by forest or agriculture. The classification is a land-cover product, so the mapped wetland class should not be treated as a legal wetland boundary or a parcel-level regulatory map.
Agriculture contributes 21.54% of the 2025 total. Yellow agricultural areas are common in the northern half, along the east side, and in many western sections, but they are broken up by forest and wetland cover. This makes the county look different from places where farmland forms one large uninterrupted region. The agricultural share is substantial, yet natural cover remains equally important to the overall landscape.
Developed land is 7.88%, grassland 4.02%, shrubland 3.76%, and water 0.75%. Development has a modest countywide share, but it becomes much easier to notice around several settlement areas and road corridors. Water is a small percentage, though a few larger blue areas stand out on the map. Looking at both percentage and location prevents smaller classes from being overlooked.
The forest-and-farmland view makes the working landscape easier to separate from natural cover
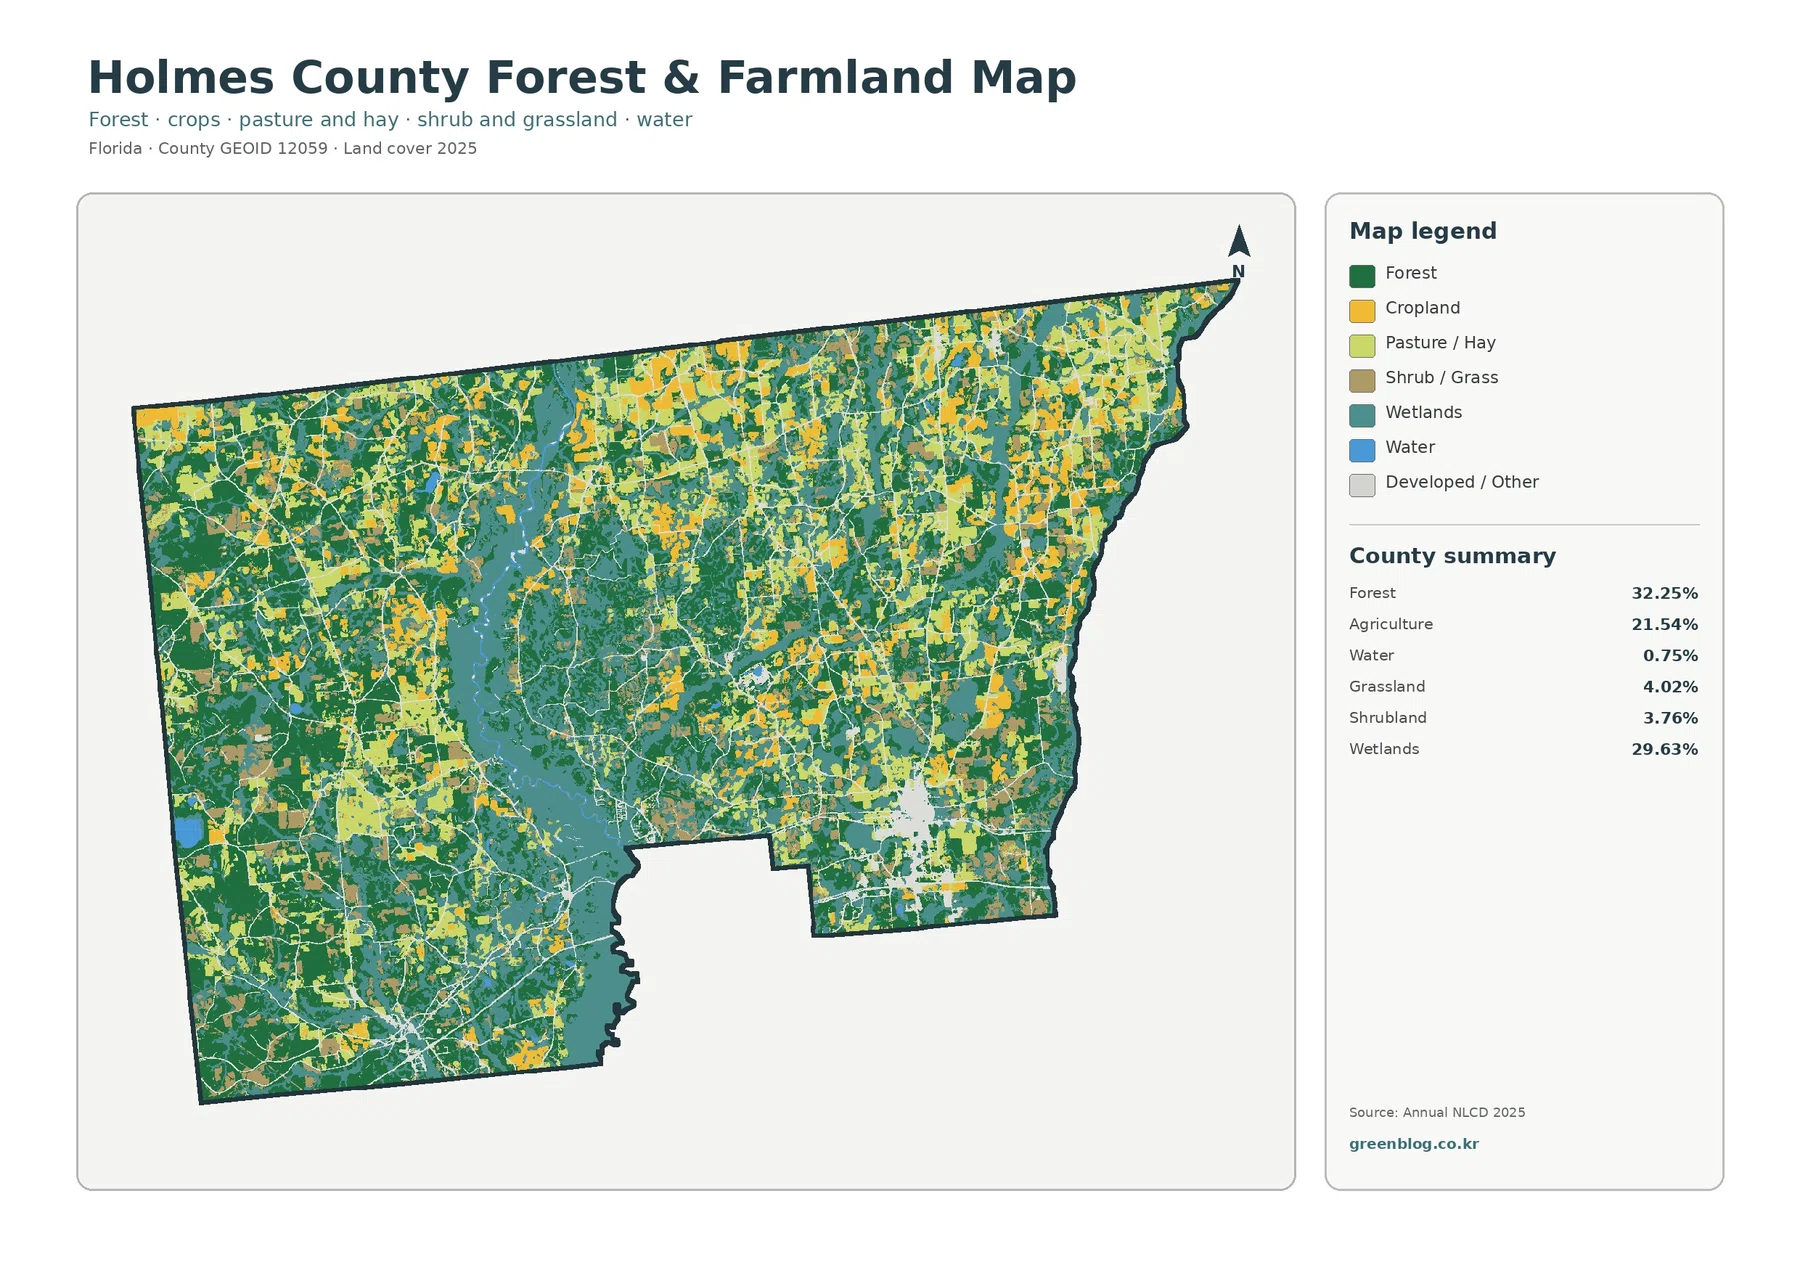
Removing some of the detail from developed classes changes what stands out. Forest remains widespread, while agricultural land becomes easier to trace between wooded and wet areas. The map shows frequent contact between these classes, so it is more useful for comparing their arrangement than for drawing a sharp boundary between “farm country” and “forest country.”
Holmes County’s 21.54% agricultural share is important enough to shape many parts of the map. UF/IFAS Extension Holmes County provides local programs in agriculture and natural resources, which offers useful background for readers who want to understand the county beyond the map itself. The yellow map class, however, represents observed surface cover rather than a legal agricultural designation, ownership category, or tax classification.
Wetlands remain visually important even in a map designed to emphasize forest and farmland. Their 29.63% share means that many agricultural and wooded areas are close to wet ground. This is one reason a single-purpose interpretation can be misleading: a reader interested in farming should still pay attention to the wetland layer, while a reader focused on forest should notice how often the green areas are interrupted by other cover.
Grassland and shrubland have smaller countywide shares, but they are scattered through many parts of Holmes County rather than confined to one corner. These smaller classes can be difficult to judge on a reduced web image. The downloadable JPG is more useful when the goal is to enlarge the map, compare the legend carefully, or place the image in a report without losing as much detail.
Only a small share of Holmes County is covered by highly impervious surfaces
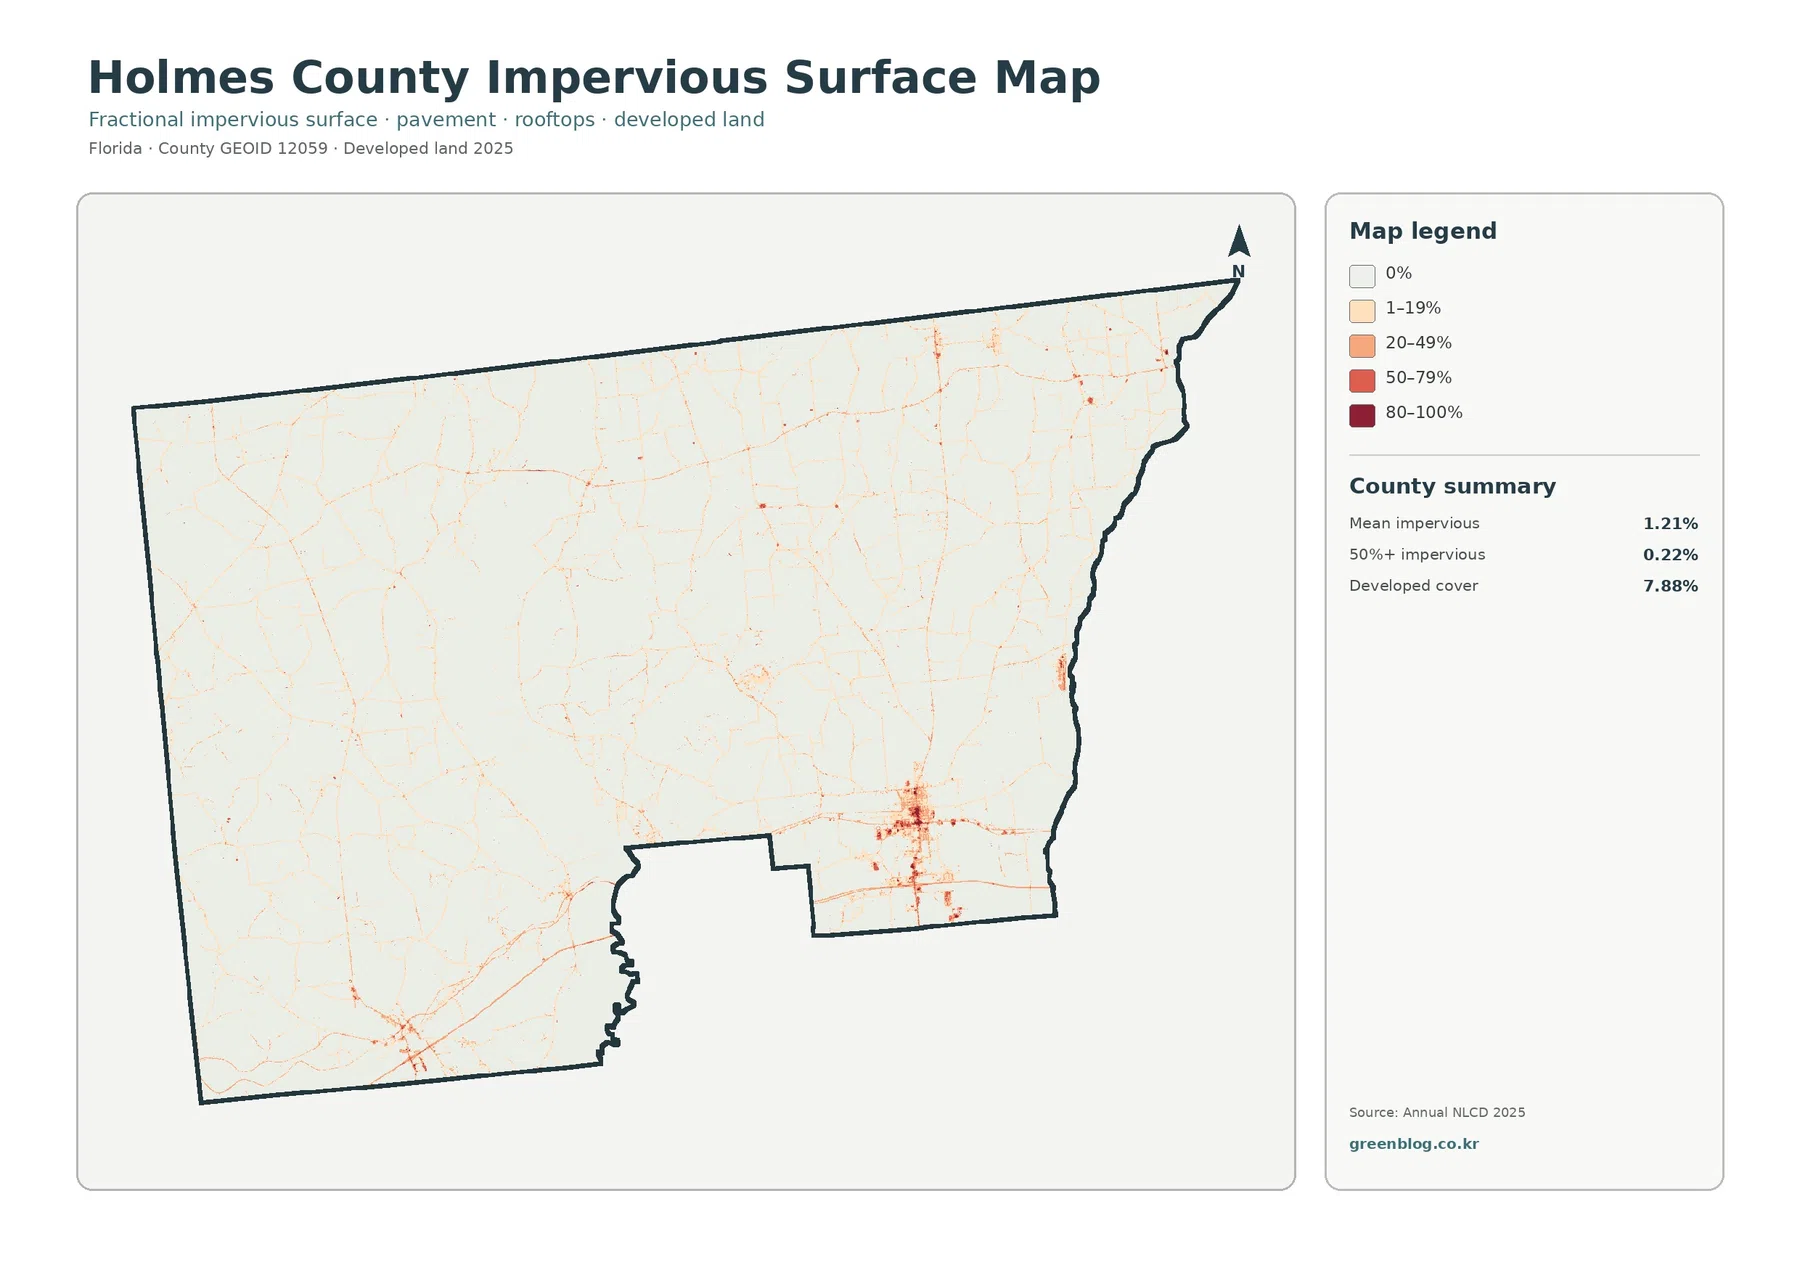
Impervious surface means pavement, rooftops, parking areas, and similar hard surfaces that do not readily absorb rainfall. The countywide mean is 1.21%, and only 0.22% of the county falls in the 50%-or-greater impervious category. Those figures are much lower than the 7.88% developed-land share because a developed land-cover class can also contain lawns, trees, soil, and other surfaces that still absorb water.
Most of the county appears very light on the impervious map. Stronger concentrations are limited to a few settlement areas and road-linked locations, including a noticeable cluster in the south-central part of the county. Smaller concentrations also appear near the southwest and along parts of the eastern side. The pattern fits a county where hard surfaces are localized rather than spread broadly across most of the landscape.
Bonifay is the location of county administration and the local UF/IFAS Extension office, and the south-central settlement area is one of the clearer developed concentrations on the map. That geographic context is useful, but the impervious layer should still be read as a surface map rather than a municipal-boundary map. It does not identify city limits, parcel ownership, zoning districts, or individual building footprints.
For environmental education, this view can be compared with the wetland layer to see where hard surfaces are relatively common and where natural cover remains dominant. It is not a flood-risk model. Drainage, soil, topography, rainfall, stream conditions, and infrastructure all affect runoff, so the map is best used as broad background rather than a site-specific engineering tool.
The 1985–2025 comparison highlights forest and agricultural class differences across many small areas
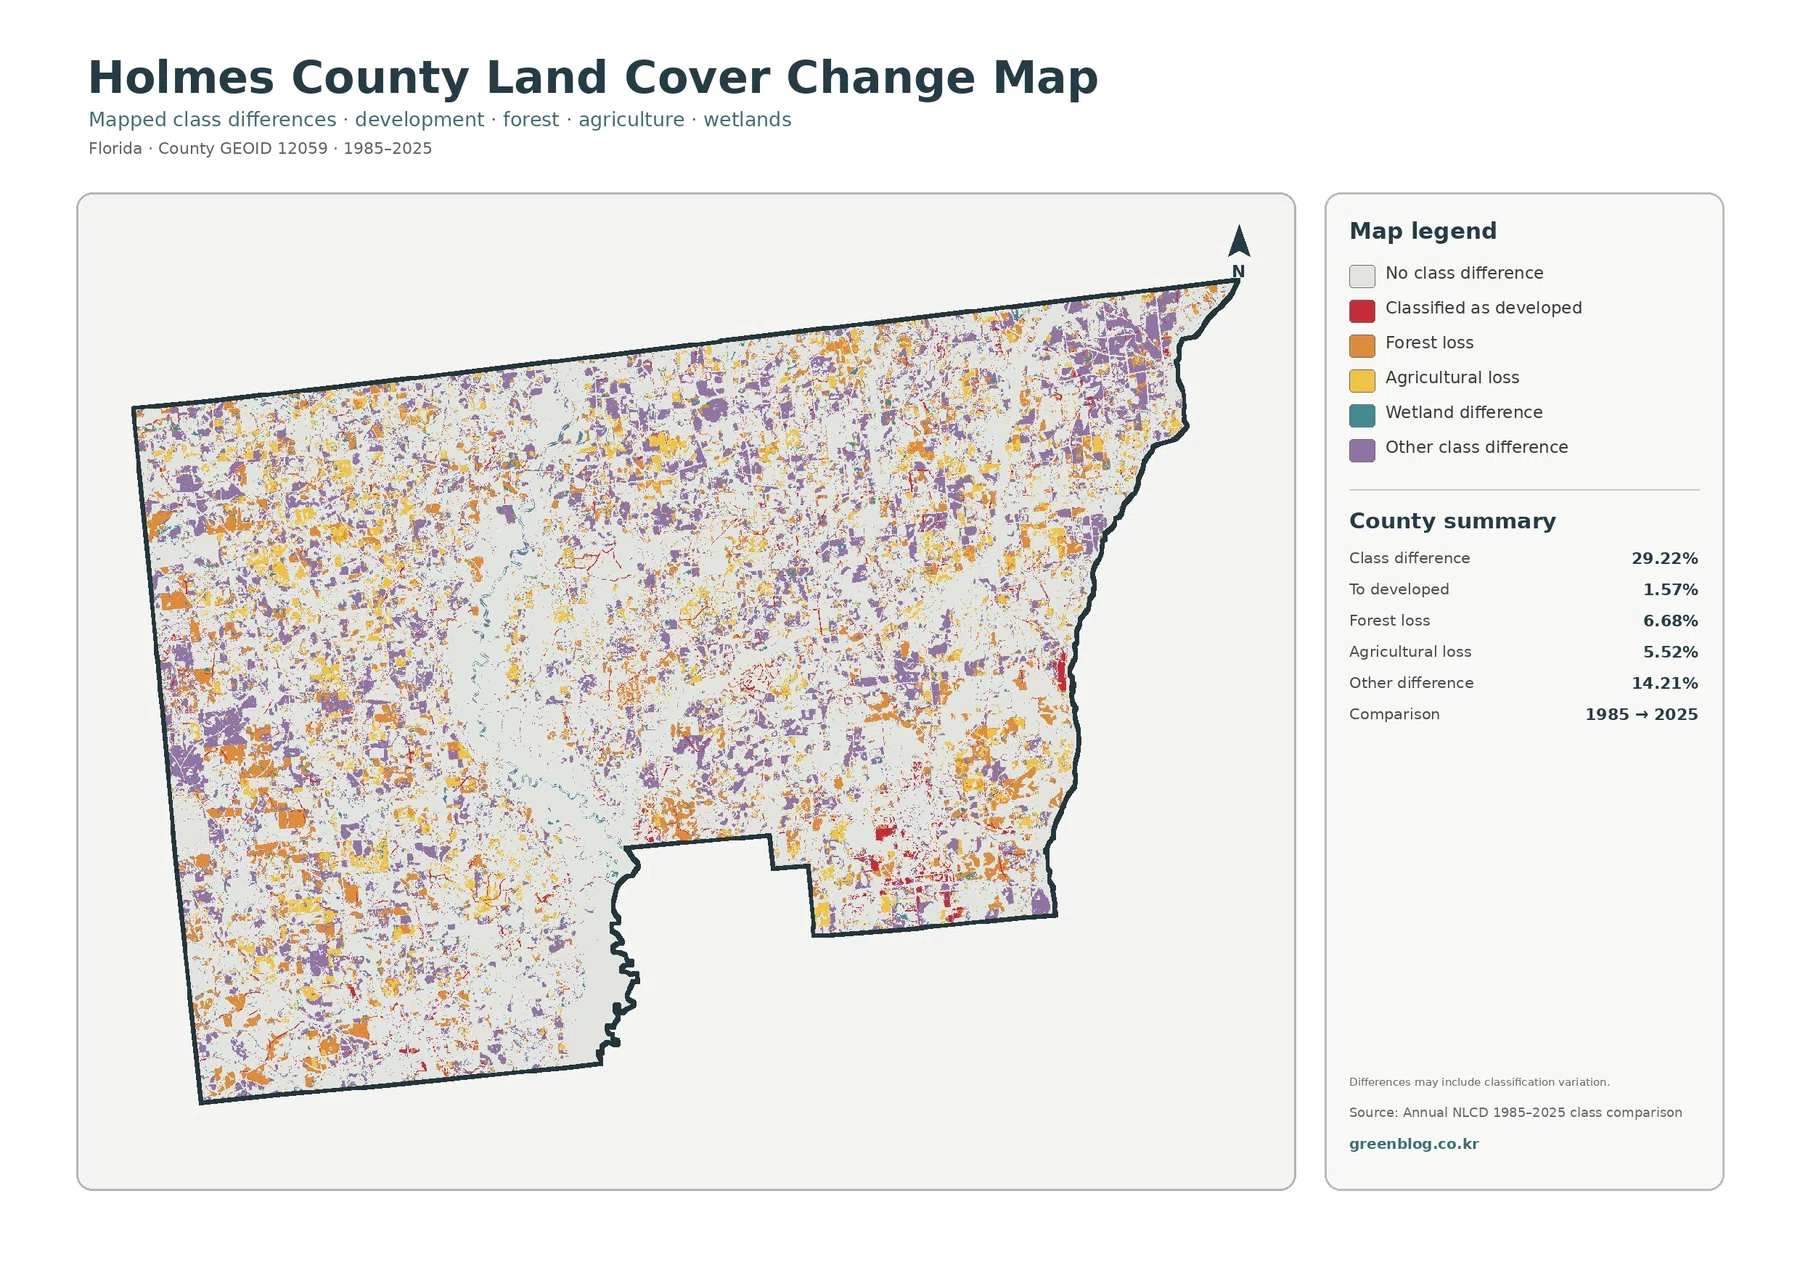
The comparison marks 29.22% of the county as having a different mapped class between 1985 and 2025. Forest loss accounts for 6.68%, agricultural loss for 5.52%, transitions classified as developed for 1.57%, and other class differences for 14.21%. Rather than forming one dominant change area, the colored cells are scattered through many parts of the county.
Orange forest-loss areas and yellow agricultural-loss areas appear in numerous patches across the west, north, and east. Red developed-transition areas are much smaller overall and are easiest to notice near current settlement concentrations and along some transportation routes. Similar locations on two maps do not prove a cause-and-effect relationship; they simply provide places where a reader may want to compare additional imagery or historical records.
An important note on the map states that the differences may include classification variation. For that reason, 29.22% should not be presented as a direct measurement of physical land conversion. Satellite conditions, classification methods, and mixed surfaces within a raster cell can cause the same location to be assigned to different classes at different dates. The comparison is most useful as a screening view that identifies areas worth checking in greater detail.
Two endpoint years also leave the intervening history unknown. A location may have changed more than once between 1985 and 2025, or a recent change may look the same as one that occurred decades earlier. Anyone studying timing should use additional annual or historical datasets instead of relying on the endpoint comparison alone.
Different map views answer different practical questions about Holmes County
The general land-cover map is the best starting point for a county overview because it shows the balance among forest, wetlands, agriculture, and developed land. The forest-and-farmland map is more useful when the goal is to compare working lands with wooded and wet areas. Impervious surface helps isolate hard surfaces within developed places, while the change map adds a long-term comparison without pretending to explain every cause.
A classroom exercise can use the four views in sequence. Students can first identify the three largest 2025 classes, then trace where farm and forest areas meet, compare those places with the impervious map, and finally inspect the 1985–2025 differences. That approach demonstrates why a county can have a developed class of 7.88% while its mean impervious surface is only 1.21%.
Planning and parcel questions require a different source. Holmes County’s official Building/Planning/Zoning page provides future land-use and comprehensive-plan information. Those documents address policy and allowed uses, while the maps on this page describe observed surface cover. A parcel shown as agricultural cover is not automatically zoned for agriculture, and developed cover does not establish what a property owner may build.
UF/IFAS Extension Holmes County is a useful local reference for agriculture and natural-resource topics. It also illustrates why combining a county-specific source with national land-cover data is helpful: the satellite map provides broad spatial context, while local programs provide subject matter that is tied to Holmes County itself. Neither source replaces parcel records, field inspection, or regulatory review.
The downloadable JPG set is best used for county-scale comparison rather than parcel decisions
The ZIP includes four JPG files: 2025 land cover, forest and farmland, impervious and developed land, and the 1985–2025 land-cover comparison. Each image is 2480×1754 pixels. That size is convenient for screen presentations, reports, and moderate enlargement, but it is below the pixel dimensions normally associated with full A3 printing at 300 dpi. Check label and legend readability before producing a large print.
Annual NLCD products are raster datasets, meaning the landscape is represented by a grid of cells rather than exact parcel outlines. A single cell can contain more than one real-world surface, so the mapped category generalizes what is on the ground. Boundaries between colors should therefore be treated as approximate land-cover boundaries, not survey lines or legal property limits.
Frequently Asked Questions
What is the largest 2025 land-cover class in Holmes County?
Forest is the largest class at 32.25%. Wetlands are close behind at 29.63%, and agriculture accounts for 21.54%. Because those three classes are widely interspersed, Holmes County is better understood as a mixed forest-wetland-agricultural landscape than as a county dominated by only one type of cover.
Why is developed land 7.88% while mean impervious surface is only 1.21%?
The two measures describe different things. Developed land can contain lawns, trees, soil, and other permeable surfaces in addition to roads and buildings. Impervious surface measures hard surfaces such as pavement and rooftops more directly, so its countywide average can be much lower than the developed land-cover share.
Does the 29.22% class difference mean that 29.22% of the county physically changed?
No. The map notes that classification variation may be included in the comparison. The 29.22% figure describes locations assigned to different mapped classes in 1985 and 2025; it should be checked against additional imagery, annual data, or local records before being treated as confirmed physical change.
Map File Information
Download the four original Holmes County land-cover JPG maps together in one ZIP file.
- Included Files: Use only the versions confirmed in the article and supplied images
- File Type: Use the confirmed download contents
- Intended Use: Printing, education, presentations, and map-based projects
Related Maps
- Alachua County Florida Land Cover Map
- Baker County Florida Land Cover Map
- Bay County Florida Land Cover Map
Sources and References
- MRLC Annual NLCD Data – official access point for annual land-cover datasets.
- USGS Annual NLCD Land Cover Classification – explanation of the major land-cover classes used in Annual NLCD products.
- U.S. Census Bureau TIGER/Line Shapefiles – official boundary data used for county geography.
- UF/IFAS Extension Holmes County – local agriculture, natural resources, and Extension information for Holmes County.
- Holmes County Building/Planning/Zoning – official county planning information, including future land-use and comprehensive-plan resources.
Green Map creates custom-edited map images using open geographic data sources such as geoBoundaries, Natural Earth, OpenStreetMap, and government open data.
These maps are edited visual materials, not raw data files, and are provided for education, documents, presentations, and graphic reference.