Agriculture is the largest 2025 land-cover class in Gilchrist County at 40.85%, but the county is not a continuous field landscape. Forest accounts for 26.05% and wetlands for 15.63%, creating a broad natural interior between large agricultural blocks on the western and eastern sides. The four maps on this page separate the countywide pattern, forest and farmland, hard surfaces, and the 1985–2025 endpoint comparison.
The WebP figures are intended for quick browser viewing. A ZIP containing the four original JPG maps is available in the download section below. These are land-cover maps, meaning they classify what is on the ground surface; they are not parcel ownership, zoning, building-permit, or legal land-use maps. That distinction is especially important in a rural county where farms, woods, wetlands, springs, roads, and small communities occur close together.
Table of Contents
Agriculture covers 40.85%, while forest and wetlands form a broad interior contrast
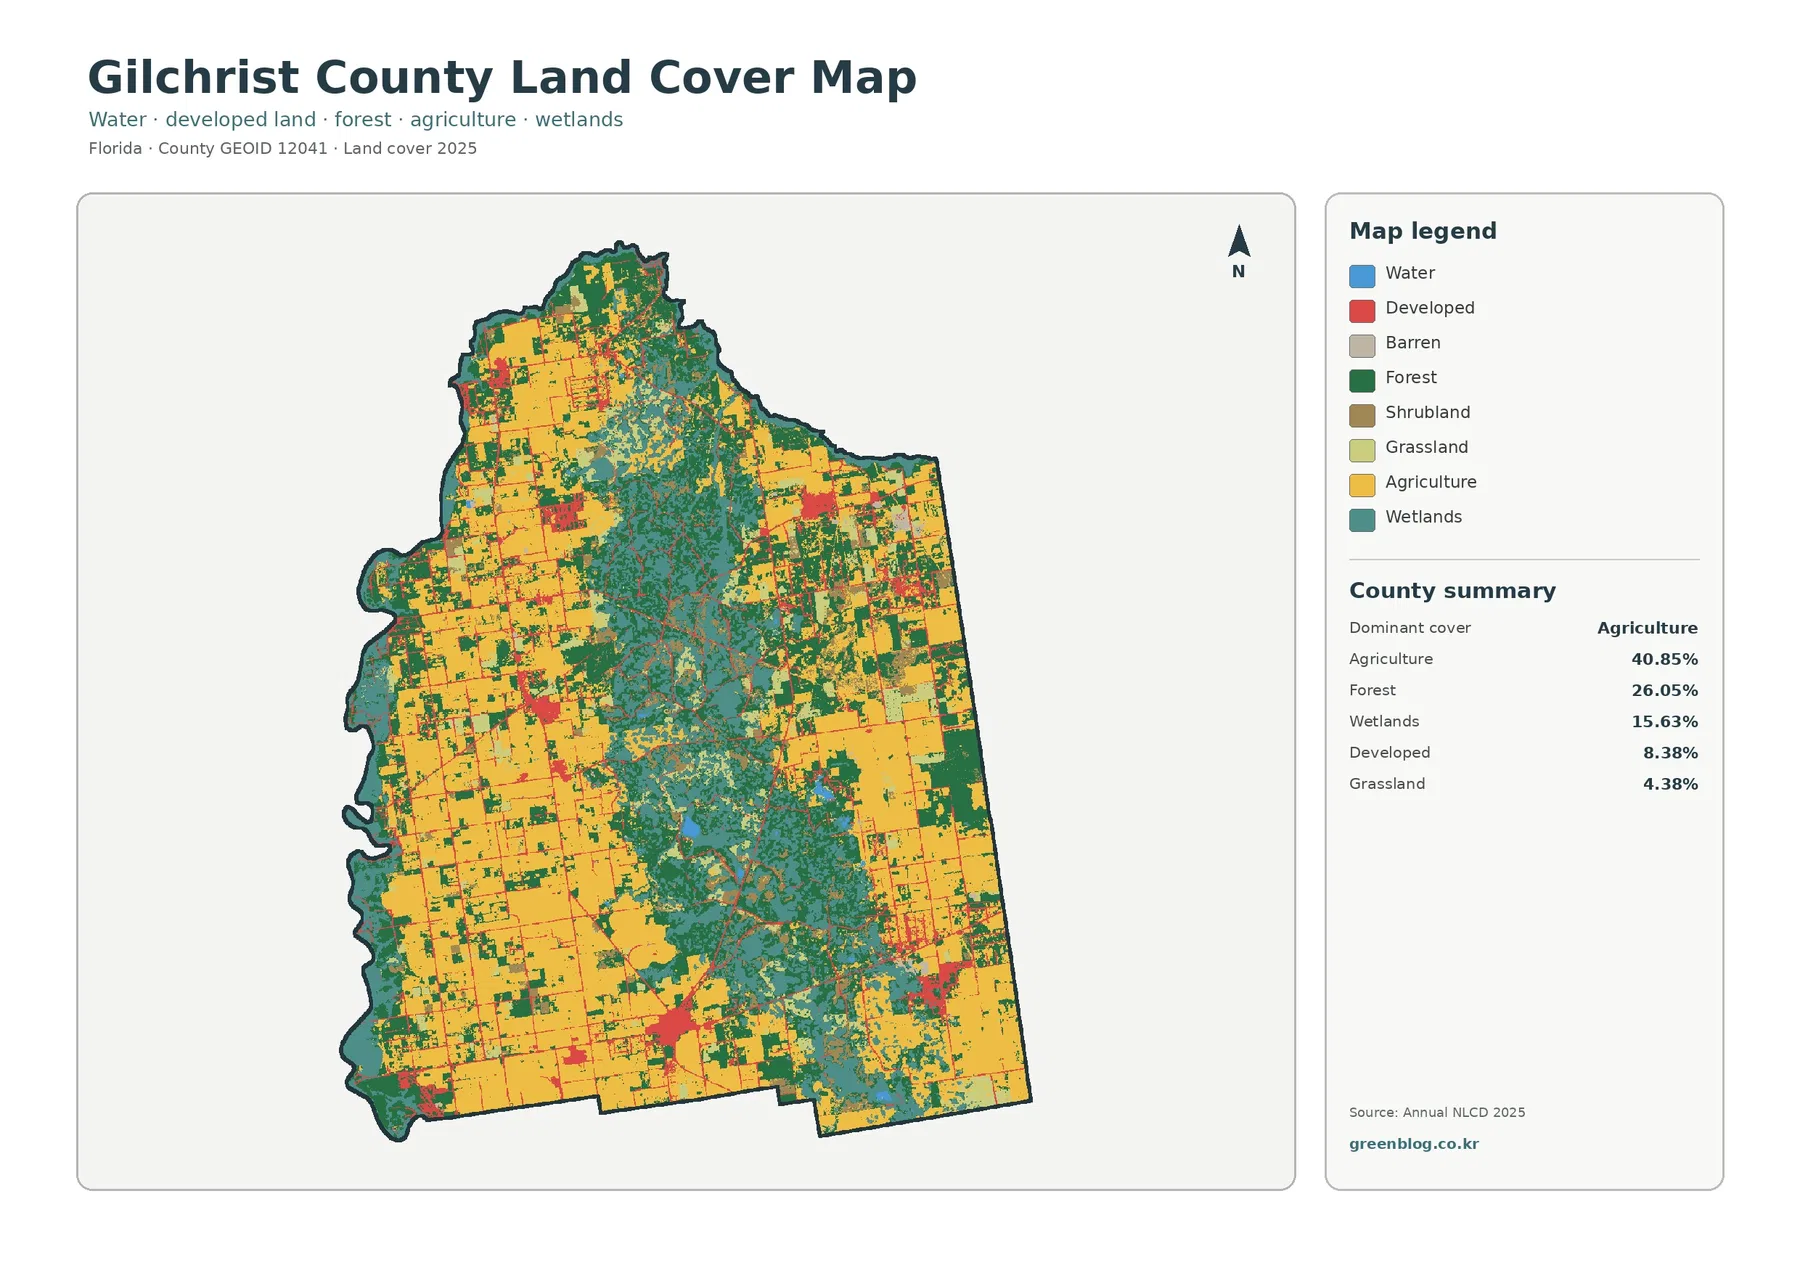
The strongest countywide pattern is the amount of yellow agricultural cover. Agriculture represents 40.85% of the mapped area and appears in large blocks across much of the west and east, with additional patches scattered elsewhere. Those blocks are interrupted by forest, wetlands, grassland, and small developed areas, so the map is better described as an agricultural landscape with substantial natural cover than as an uninterrupted farming plain.
Forest is the second-largest class at 26.05%. Dark green is especially prominent through the middle of the county and in additional patches around the agricultural areas. The shape is irregular rather than a single clean rectangle, which matters when reading the map: forest often meets fields, wetland cells, and smaller open-cover classes along complex edges.
Wetlands account for 15.63%. Teal areas are widespread through the central and southeastern portions of the county and also appear in smaller pieces near the western side. Open water is only 0.64% in the summary, but that figure should not be used as a measure of the county’s full water-related landscape. Wetlands are a separate class and can represent vegetation strongly influenced by wet conditions even when no broad open-water surface is visible.
Developed cover is 8.38%, much smaller than agriculture, forest, or wetlands. Red areas occur as several compact clusters and thin road-like lines instead of forming one continuous urban belt. Gilchrist County’s official website identifies Trenton as the county seat and discusses Bell and Fanning Springs as local communities. The land-cover image itself is unlabeled, so individual red clusters should not be assigned to municipal boundaries without a separate reference map.
Grassland makes up 4.38% and shrubland 3.80%. Both occur as smaller pieces among the dominant classes. At county scale, some colors can look similar when the image is reduced, so the legend is necessary for distinguishing agriculture, pasture or grass, shrub cover, and forest. The map is useful for broad comparison, not for identifying a specific crop or vegetation species.
Hard surfaces remain sparse even where developed cover appears
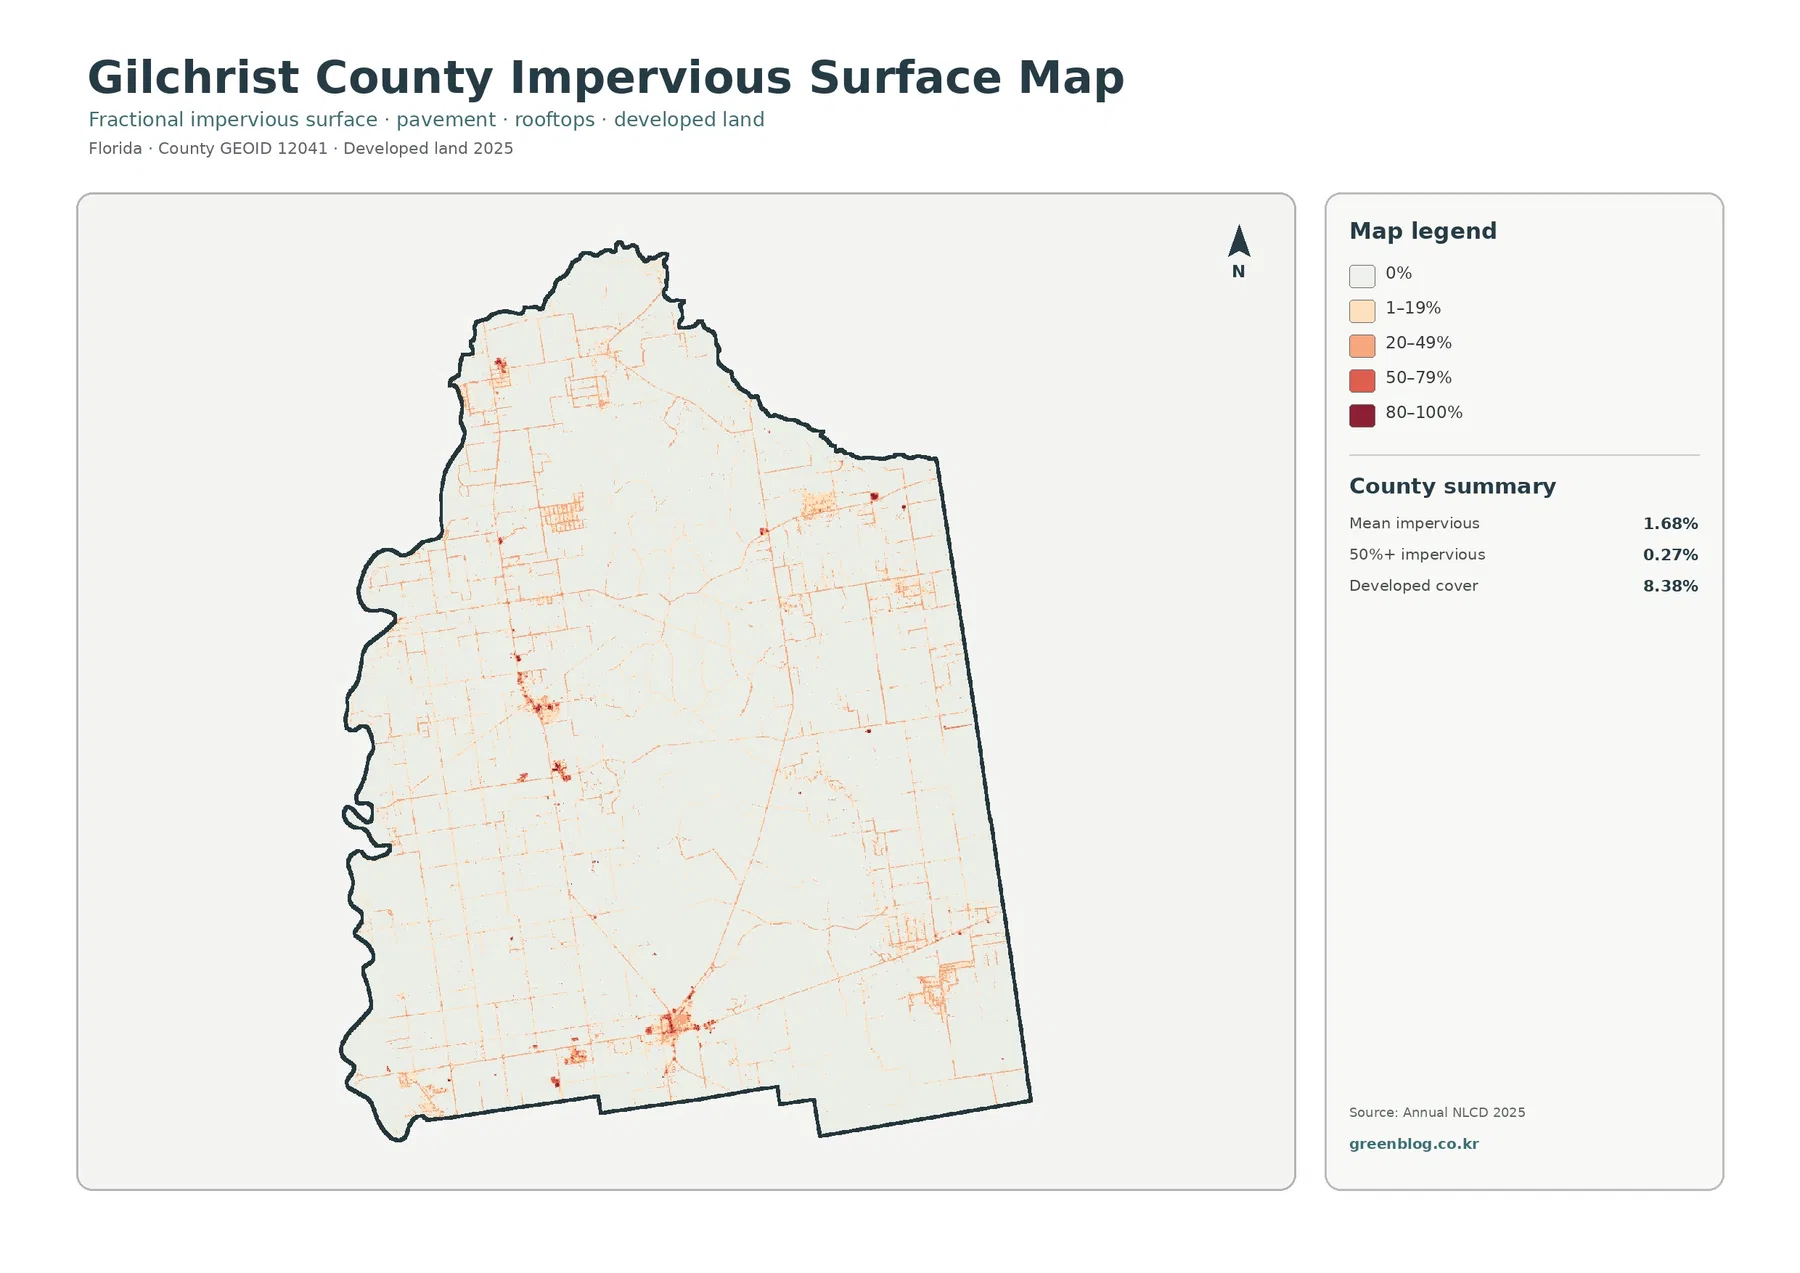
Mean imperviousness is only 1.68% across Gilchrist County. Impervious surface means pavement, rooftops, parking areas, and similar surfaces that do not readily absorb rainfall. Only 0.27% of the county is mapped at 50% or greater imperviousness, even though developed cover totals 8.38%. The gap is expected because developed land can include lawns, trees, bare soil, and other permeable surfaces in addition to hard materials.
Most of the impervious map is pale. Stronger red values appear in a limited number of compact centers, with thin lines extending along roads and smaller clusters scattered elsewhere. This pattern is more useful than the countywide average when the goal is to locate where hard surfaces are concentrated. A mean of 1.68% does not imply that every part of the county has the same amount of pavement.
The county’s settlement context helps explain why the hard-surface map looks fragmented rather than metropolitan. Trenton is the county seat, and the official county site also describes Bell and Fanning Springs. These places are separated by large areas of agricultural and natural cover. The map does not provide town boundaries, but the dispersed pattern of stronger impervious values is consistent with a rural county organized around smaller communities and road corridors.
Imperviousness should not be treated as a flood-risk map. Runoff depends on rainfall, soil, topography, drainage, groundwater, rivers, wetlands, and local infrastructure as well as pavement. Gilchrist County planning and natural-resource materials also emphasize springs and water resources. Anyone evaluating a specific property should use current flood, elevation, drainage, and planning information in addition to this regional surface map.
Springs and Suwannee Valley agriculture give the wetland pattern useful local context
Gilchrist County’s official website highlights the county’s natural springs and its rural history of farms and timber. The county comprehensive plan also identifies regional water resources, wetlands, rivers, and springs. That background is relevant when viewing the 15.63% wetland class, because the teal interior is not an isolated map artifact; it belongs to a county where water resources are a prominent part of the landscape and public planning context.
UF/IFAS Extension Gilchrist County works in both agriculture and natural resources. Suwannee Valley research from UF/IFAS discusses crops such as corn, peanuts, and watermelon alongside groundwater and spring protection in sandy soils. Those sources help explain why agricultural and water-resource questions frequently overlap in this region. The map, however, only classifies surface cover and cannot determine fertilizer practices, groundwater quality, or the cause of any local water condition.
Care is also needed when connecting a wetland patch to a named spring or river. The supplied land-cover image does not label waterways, and its teal class is not a management-boundary layer. A specific spring, river reach, or conservation area should be located with an official hydrology or park map before making site-level statements.
The forest-and-farmland view makes the east-west working-land pattern easier to compare
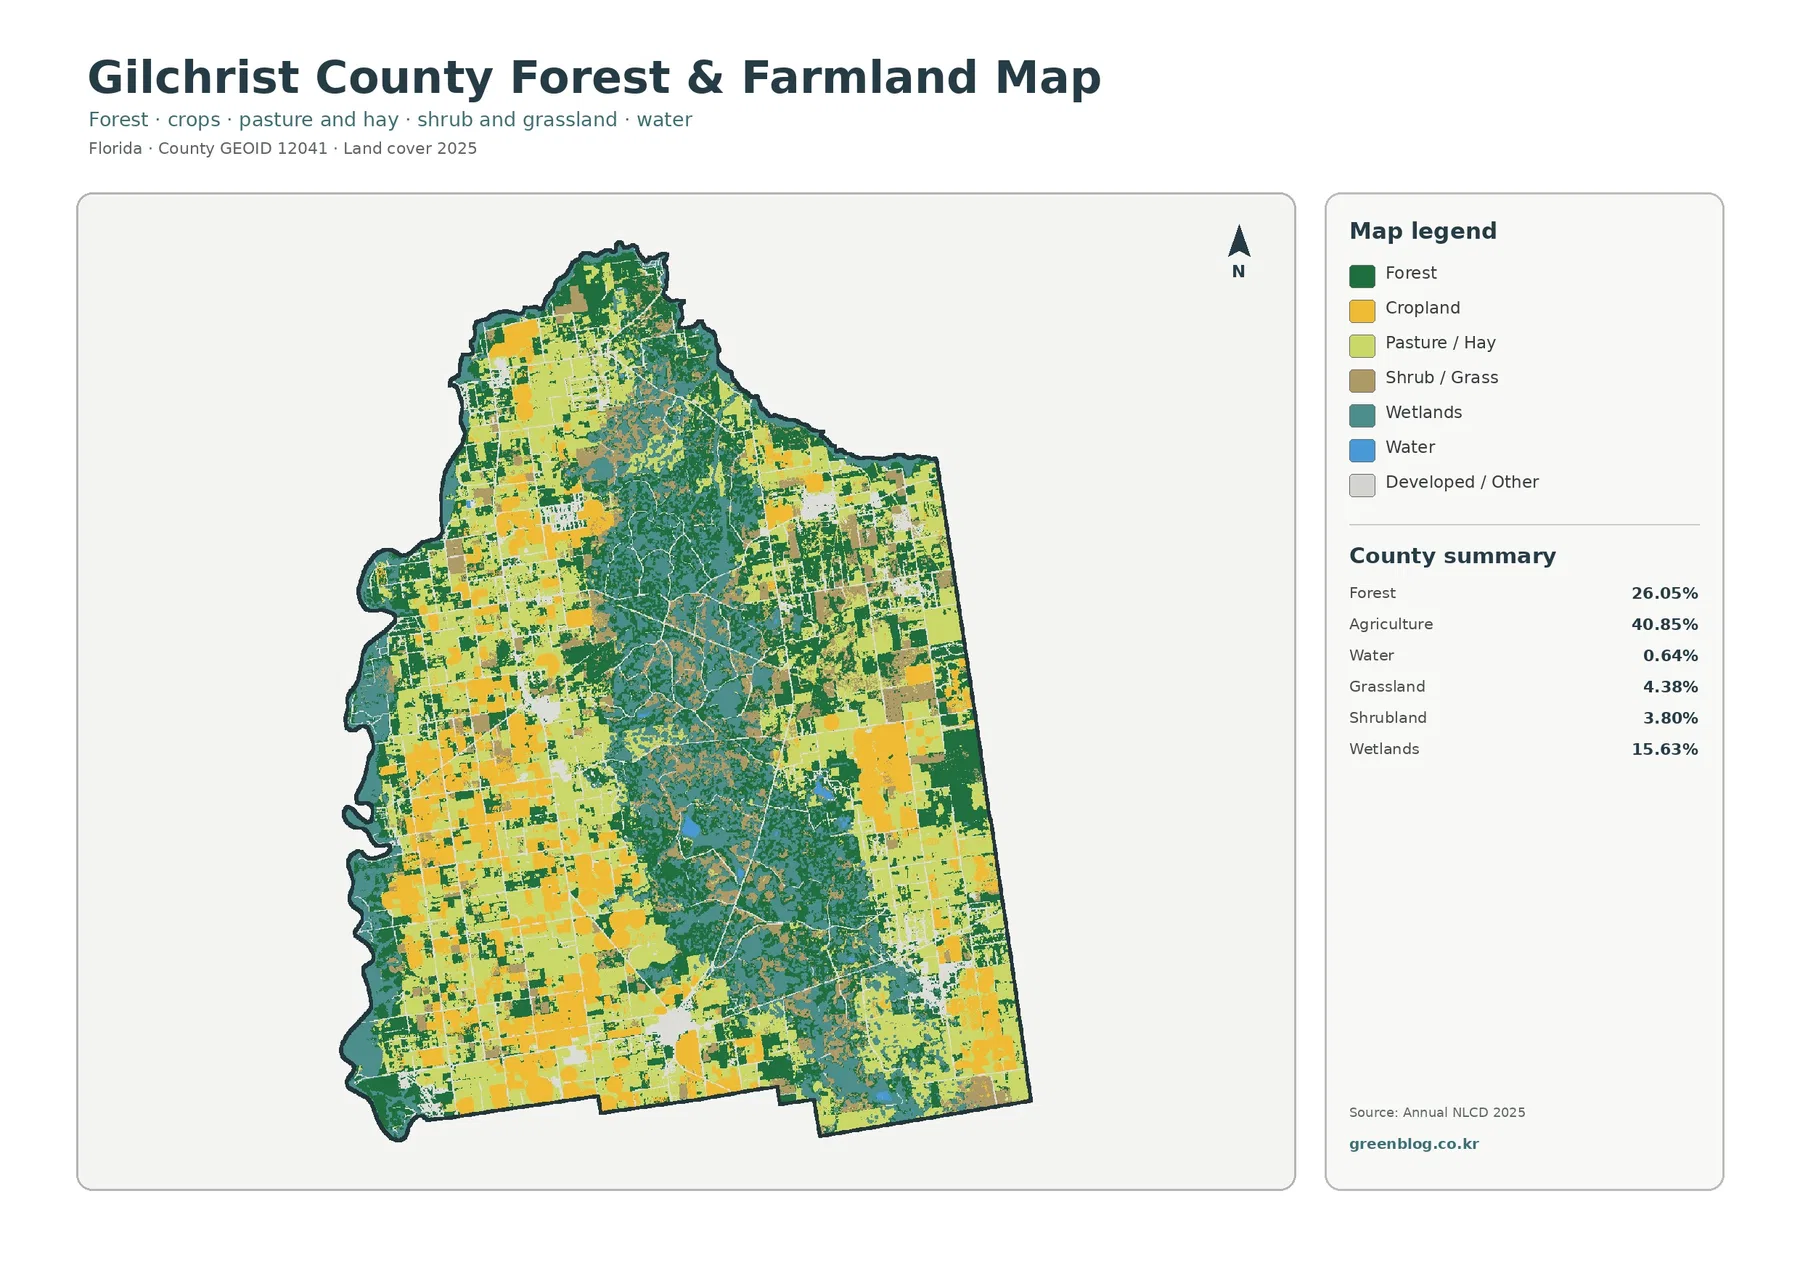
Removing much of the developed-color emphasis makes the county’s working-land structure clearer. Large agricultural blocks are visible on both sides of the broad central forest-wetland area, with additional field-sized patches scattered between darker green forest. Agriculture at 40.85% is therefore not just a statistical lead; it is a visibly extensive part of the county map.
Forest at 26.05% still occupies enough area to shape the county’s appearance. In several places, forest borders agricultural cover directly, while wetlands fill portions of the interior and southeast. The combination is important for presentations because showing agriculture alone would miss nearly half of the county that is represented by forest and wetlands together.
Raster classification introduces another caution at field edges. Annual NLCD represents the landscape as grid cells, and a cell can contain more than one real-world surface. A narrow tree line, farm road, field margin, and cropped area may not produce a perfectly sharp boundary at county scale. Enlarging the JPG makes the existing cell pattern easier to see, but it does not add parcel-level detail.
The county’s official description of farms and timber industries provides historical context for the strong agricultural and forest presence. It does not mean that the 40.85% agricultural class is an economic statistic, nor that 26.05% forest directly measures the timber industry. The map reports surface area classes for 2025, while employment, production, ownership, and industry output require separate datasets.
A 36.64% endpoint class difference does not mean 36.64% definitely changed on the ground
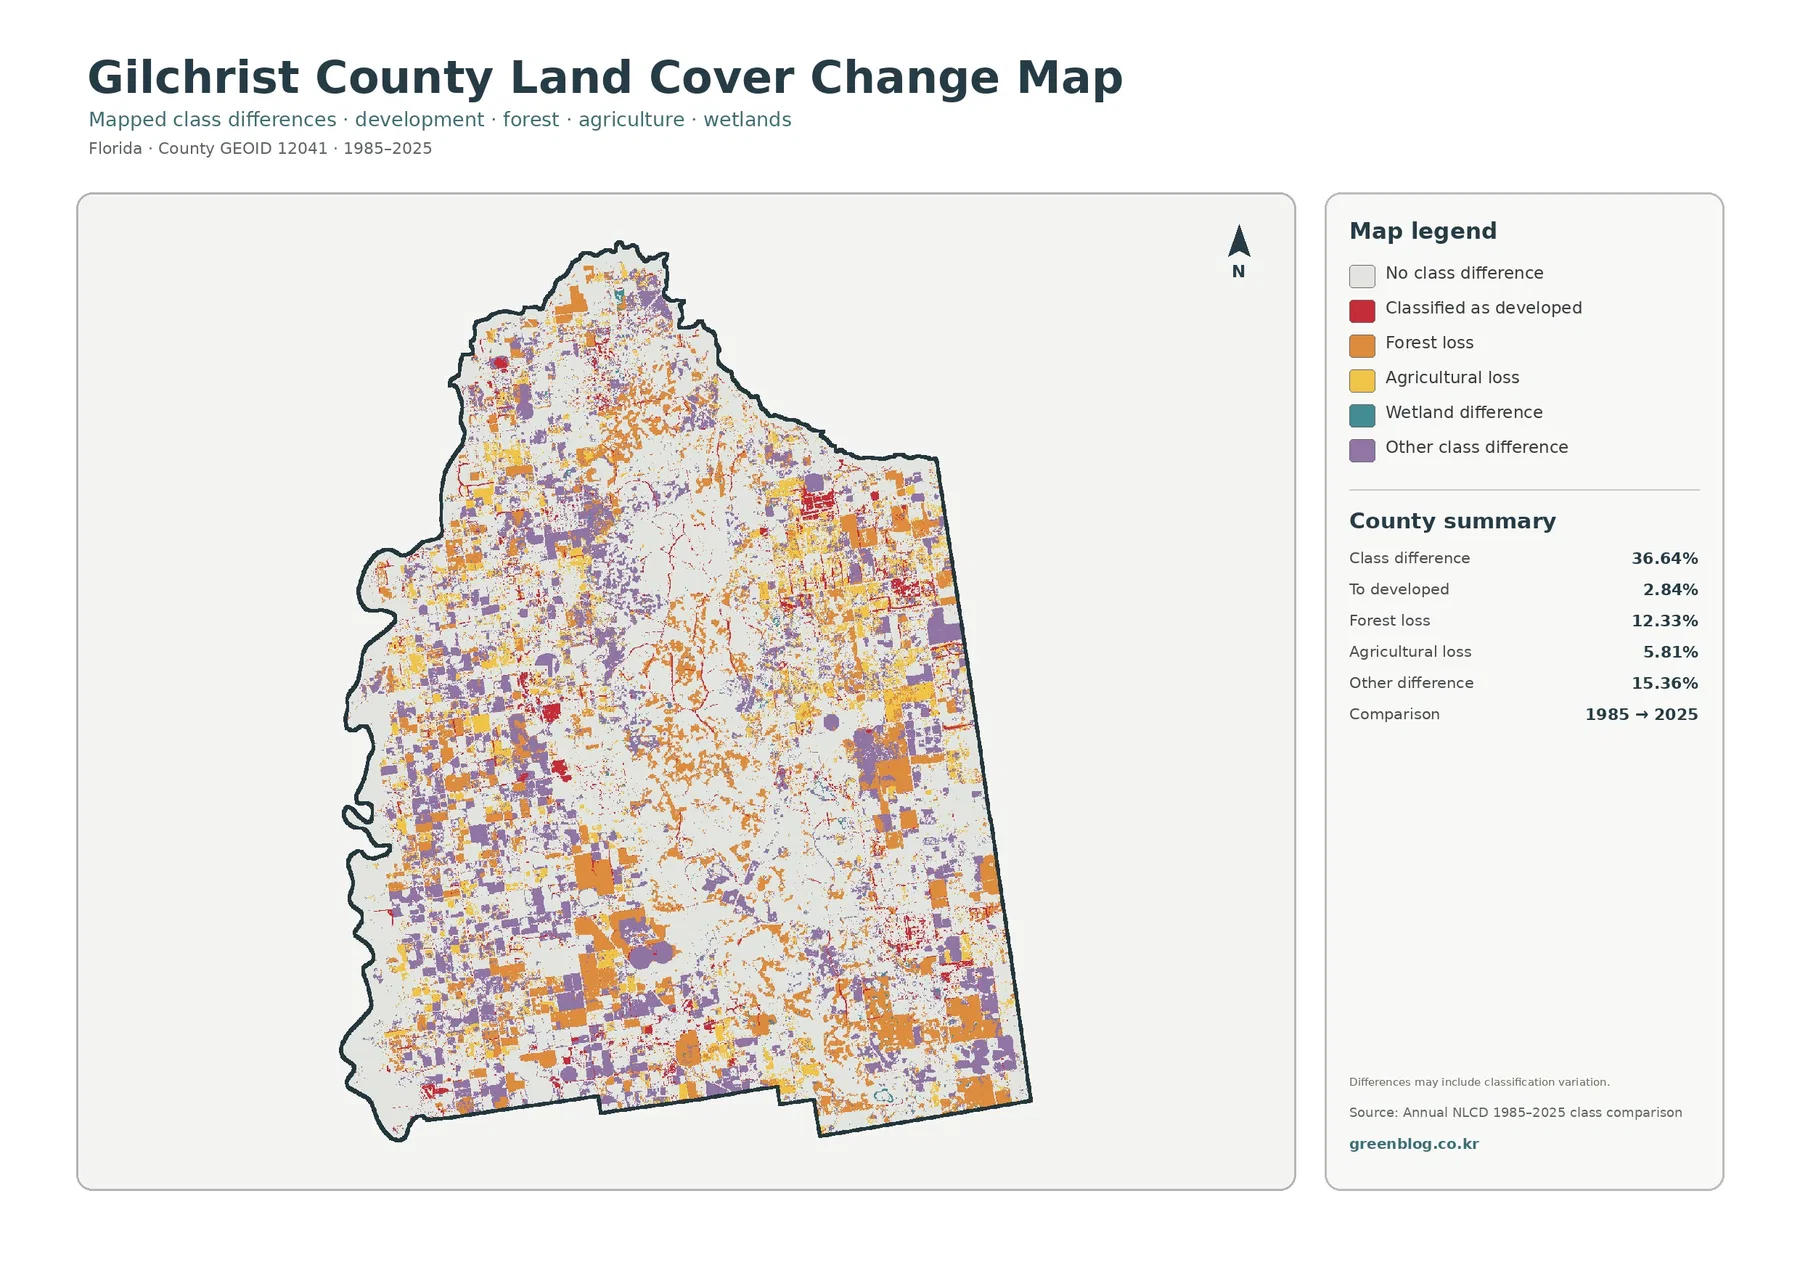
The supplied 1985–2025 comparison reports a total class difference of 36.64%. It identifies 2.84% as change to developed, 12.33% as forest loss, 5.81% as agricultural loss, and 15.36% as other difference. Colored cells are distributed across much of the county, indicating that the endpoint differences are not confined to one town or one side of Gilchrist County.
Forest loss is the largest named component at 12.33%, but the label requires caution. The note printed on the map states that differences may include classification variation. Real forest harvest, regrowth, agricultural conversion, vegetation changes, image timing, mixed pixels, and classification behavior can all contribute to a different class at the two endpoints.
The 5.81% agricultural-loss category also should not be subtracted directly from the 2025 agriculture share to create a simple decline rate. The map compares two years forty years apart and does not describe every intermediate transition. A stronger historical analysis would combine intermediate Annual NLCD products, aerial imagery, agricultural statistics, and local records.
Change to developed is 2.84%. When this figure is considered alongside mean imperviousness of 1.68%, the evidence does not support describing Gilchrist County as broadly paved or densely urbanized. A useful workflow is to locate a red endpoint-difference area, check its present class on the 2025 map, and then compare the impervious layer to see whether hard-surface values are actually concentrated there.
Choosing the right map depends on the question you are asking
For a quick county profile, the general 2025 map is the best starting point because it shows all major classes and the summary percentages. The forest-and-farmland view is better when the question is how agricultural cover fits around forest, wetlands, and open land. The impervious map is the most direct choice for comparing harder developed surfaces, while the change layer is intended for finding endpoint classification differences.
No single map answers parcel-level questions. Land cover is not zoning, and a farm-colored cell does not establish agricultural zoning or ownership. A developed cell does not show what permit exists there. The 2025 classification also may not reflect construction, forestry, restoration, or agricultural changes that occurred after the mapped observation period.
For teaching or presentations, pairing the map image with the summary numbers produces a more complete explanation. Agriculture at 40.85% is the headline statistic, but forest at 26.05%, wetlands at 15.63%, and the very low mean imperviousness change the interpretation. Together they describe a county dominated by working land and natural cover, with relatively small hard-surface concentrations.
Download the four original JPG maps
The download archive contains four JPG files: the 2025 land-cover map, forest-and-farmland map, impervious/developed-land map, and the 1985–2025 land-cover-change map. The JPG versions are useful when the legend or small patches need to be enlarged in a document, slide, or classroom handout.
Each source JPG in this package is 2480×1754 pixels. That size works well for many screen presentations and document layouts, but it is below full A3 dimensions at 300 dpi. Print quality will depend on the physical output size, so a test print is sensible before using the maps in a large-format display.
Frequently Asked Questions
What is the dominant 2025 land-cover class in Gilchrist County?
Agriculture is the largest class at 40.85%. Forest follows at 26.05%, wetlands at 15.63%, developed land at 8.38%, grassland at 4.38%, shrubland at 3.80%, and water at 0.64%. The map shows large farm blocks on both sides of a broad central area where forest and wetlands are more prominent.
Why is developed cover 8.38% when mean imperviousness is only 1.68%?
Developed classes can include lawns, trees, soil, and other permeable surfaces along with roads, parking lots, and rooftops. Imperviousness measures the harder component. Only 0.27% of Gilchrist County is mapped at 50% or greater imperviousness, and the strongest values occur in limited clusters rather than across the county.
Does the 36.64% class difference prove that more than a third of the county physically changed between 1985 and 2025?
No. The endpoint comparison includes 2.84% change to developed, 12.33% forest loss, 5.81% agricultural loss, and 15.36% other difference, but the map explicitly notes that classification variation may be included. Physical change should be confirmed with intermediate-year data, aerial imagery, and local records.
Map File Information
The ZIP contains the four original JPG land-cover maps for Gilchrist County, Florida.
- Included Files: Use only the versions confirmed in the article and supplied images
- File Type: Use the confirmed download contents
- Intended Use: Printing, education, presentations, and map-based projects
Related Maps
- Alachua County Florida Land Cover Map
- Baker County Florida Land Cover Map
- Bay County Florida Land Cover Map
Sources and References
- MRLC Annual NLCD Data – official access to annual land-cover products and comparison data
- USGS Annual NLCD Land Cover Classification – class definitions and background for the land-cover system
- U.S. Census Bureau TIGER/Line Shapefiles – county boundary reference
- Gilchrist County Board of County Commissioners – official county information on Trenton, Bell, Fanning Springs, local history, farms, timber, and natural springs
- UF/IFAS Extension Gilchrist County – local agriculture and natural-resources programs
- Gilchrist County Comprehensive Plan – official planning context for water resources, wetlands, springs, and regional natural resources
Green Map creates custom-edited map images using open geographic data sources such as geoBoundaries, Natural Earth, OpenStreetMap, and government open data.
These maps are edited visual materials, not raw data files, and are provided for education, documents, presentations, and graphic reference.