Duval County’s 2025 land-cover pattern is shaped by a large developed footprint beside an equally important network of rivers, wetlands, and forest. The supplied summary places developed cover first at 43.05%, followed by wetlands at 24.02%, forest at 17.55%, water at 9.32%, and agriculture at 2.48%. The county therefore does not read as a uniform urban surface: dense development is interrupted by major water bodies, broad wetland areas in the northeast, and greener land toward the western and northern edges.
This page provides four views of the same county: general land cover, forest and farmland, impervious surface, and a 1985–2025 class-difference map. The four original JPG maps are available together in one download near the end of the article. They work well for classroom comparison, presentations, and county-level environmental context, but they should not be treated as zoning, parcel, ownership, flood-risk, or wetland-permit maps.
Table of Contents
A developed county with major river, wetland, and forest areas
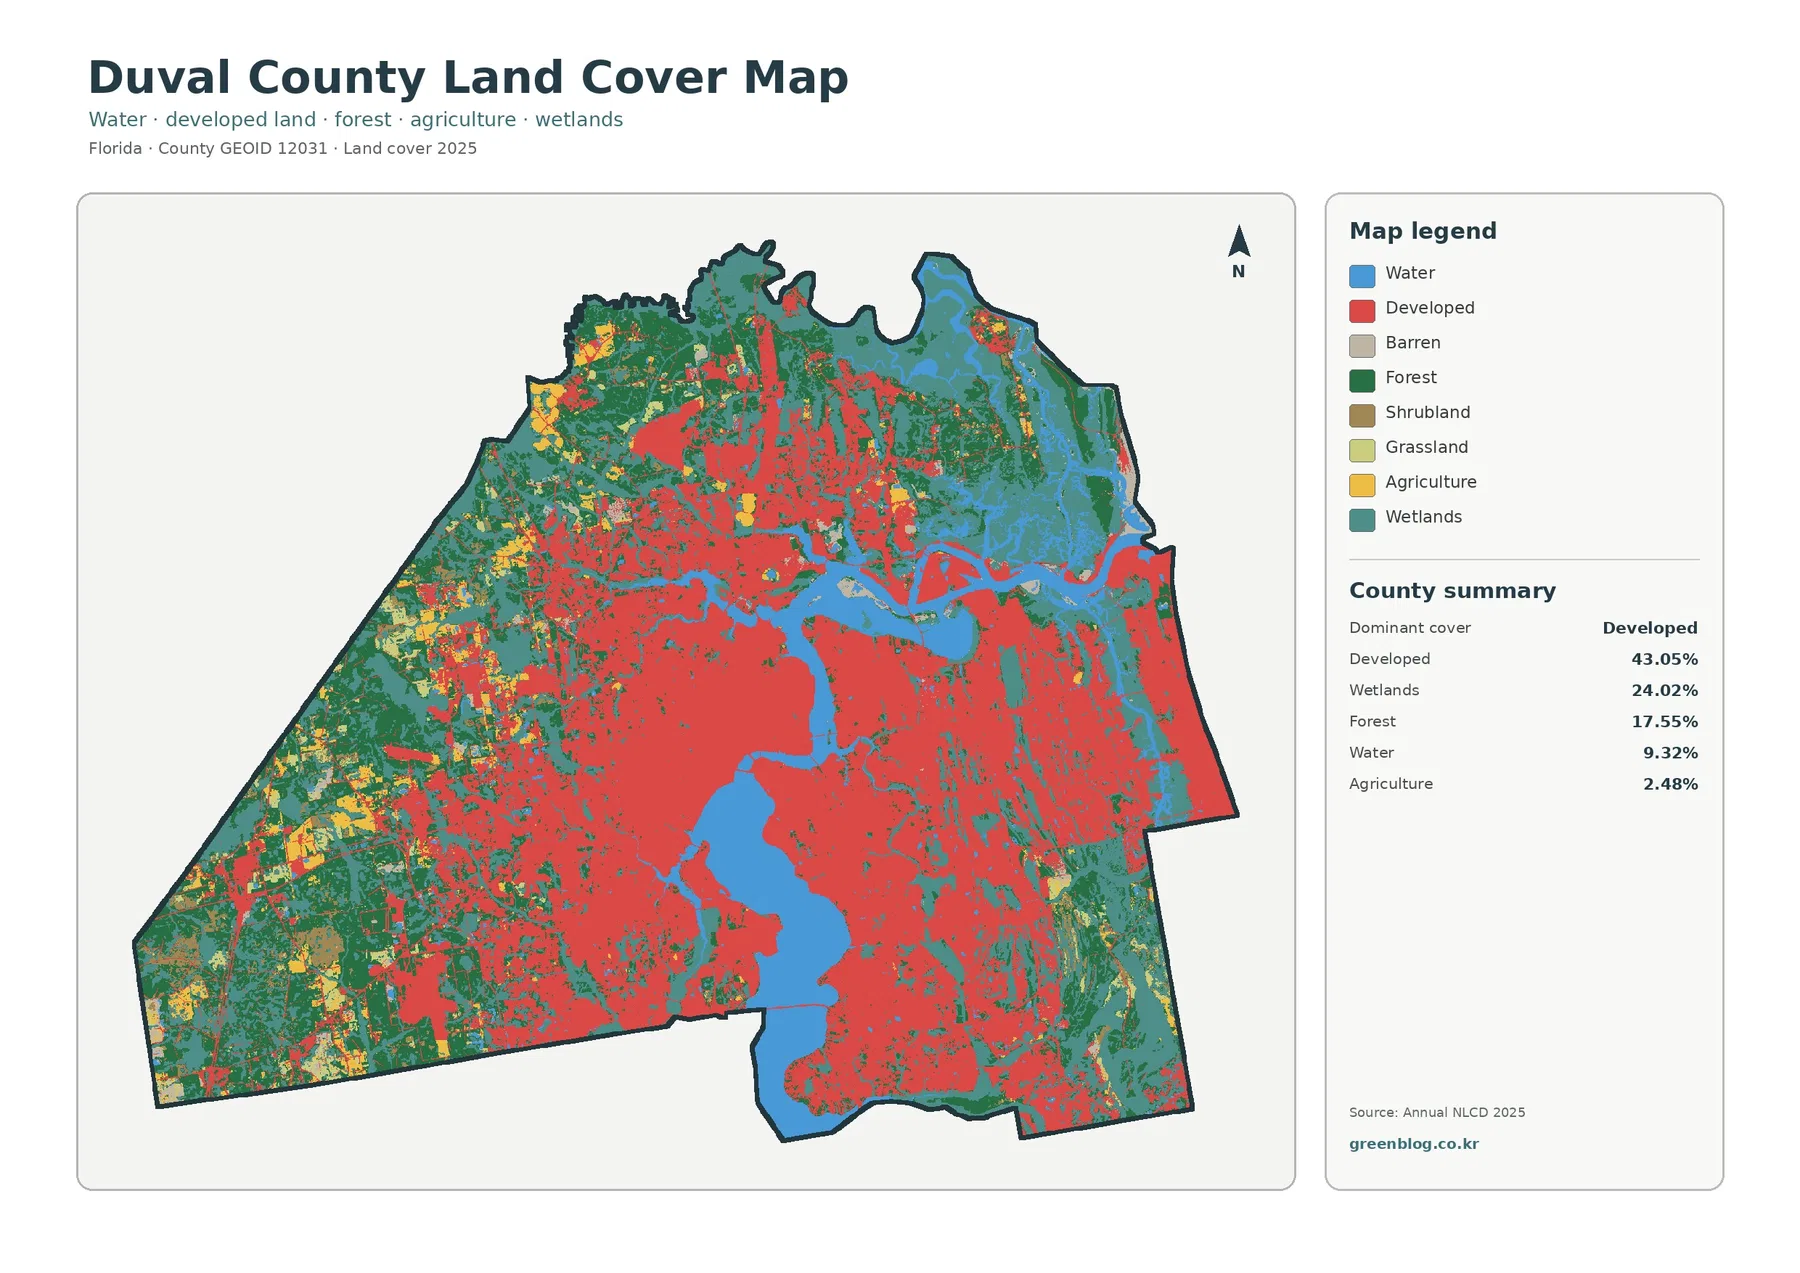
Red developed cover dominates the broad central and southeastern part of the county. At 43.05%, it is the largest mapped class, and the pattern forms a substantial connected urban area rather than a few isolated patches. Development also extends along narrow corridors and around major water features, while the western edge becomes progressively greener.
Wetlands account for 24.02% and are especially prominent in the northeast and along broad water-connected areas. Their distribution matters because it breaks up the urban pattern and creates a strong contrast between built surfaces and natural lowland cover. A visitor looking only at the developed percentage could easily miss how much of Duval County remains tied to wetland environments.
Forest covers 17.55%. The largest green areas appear toward the west and north, with additional patches beside wetlands and around the county’s outer margins. Water represents 9.32%, a large enough share to become one of the defining visual elements of the map. The major river and estuarine network cuts through the county and separates developed areas into distinct sections.
Agriculture is much smaller at 2.48%, while grassland is 1.27% and shrubland 1.33%. These classes are visible mainly as smaller patches toward the outer parts of the county. They add useful detail, but the main story is the relationship among developed land, wetlands, forest, and water. Those four classes explain most of what a reader sees at county scale.
Land cover describes the physical surface observed and classified from remote-sensing data. It does not tell the reader how a parcel is zoned, who owns it, whether construction is allowed, or whether a wetland determination has been made for regulatory purposes. A developed class can include lawns and trees as well as buildings and pavement, while a wetland class can contain different vegetation and moisture conditions.
Impervious surface reveals where development is most intense
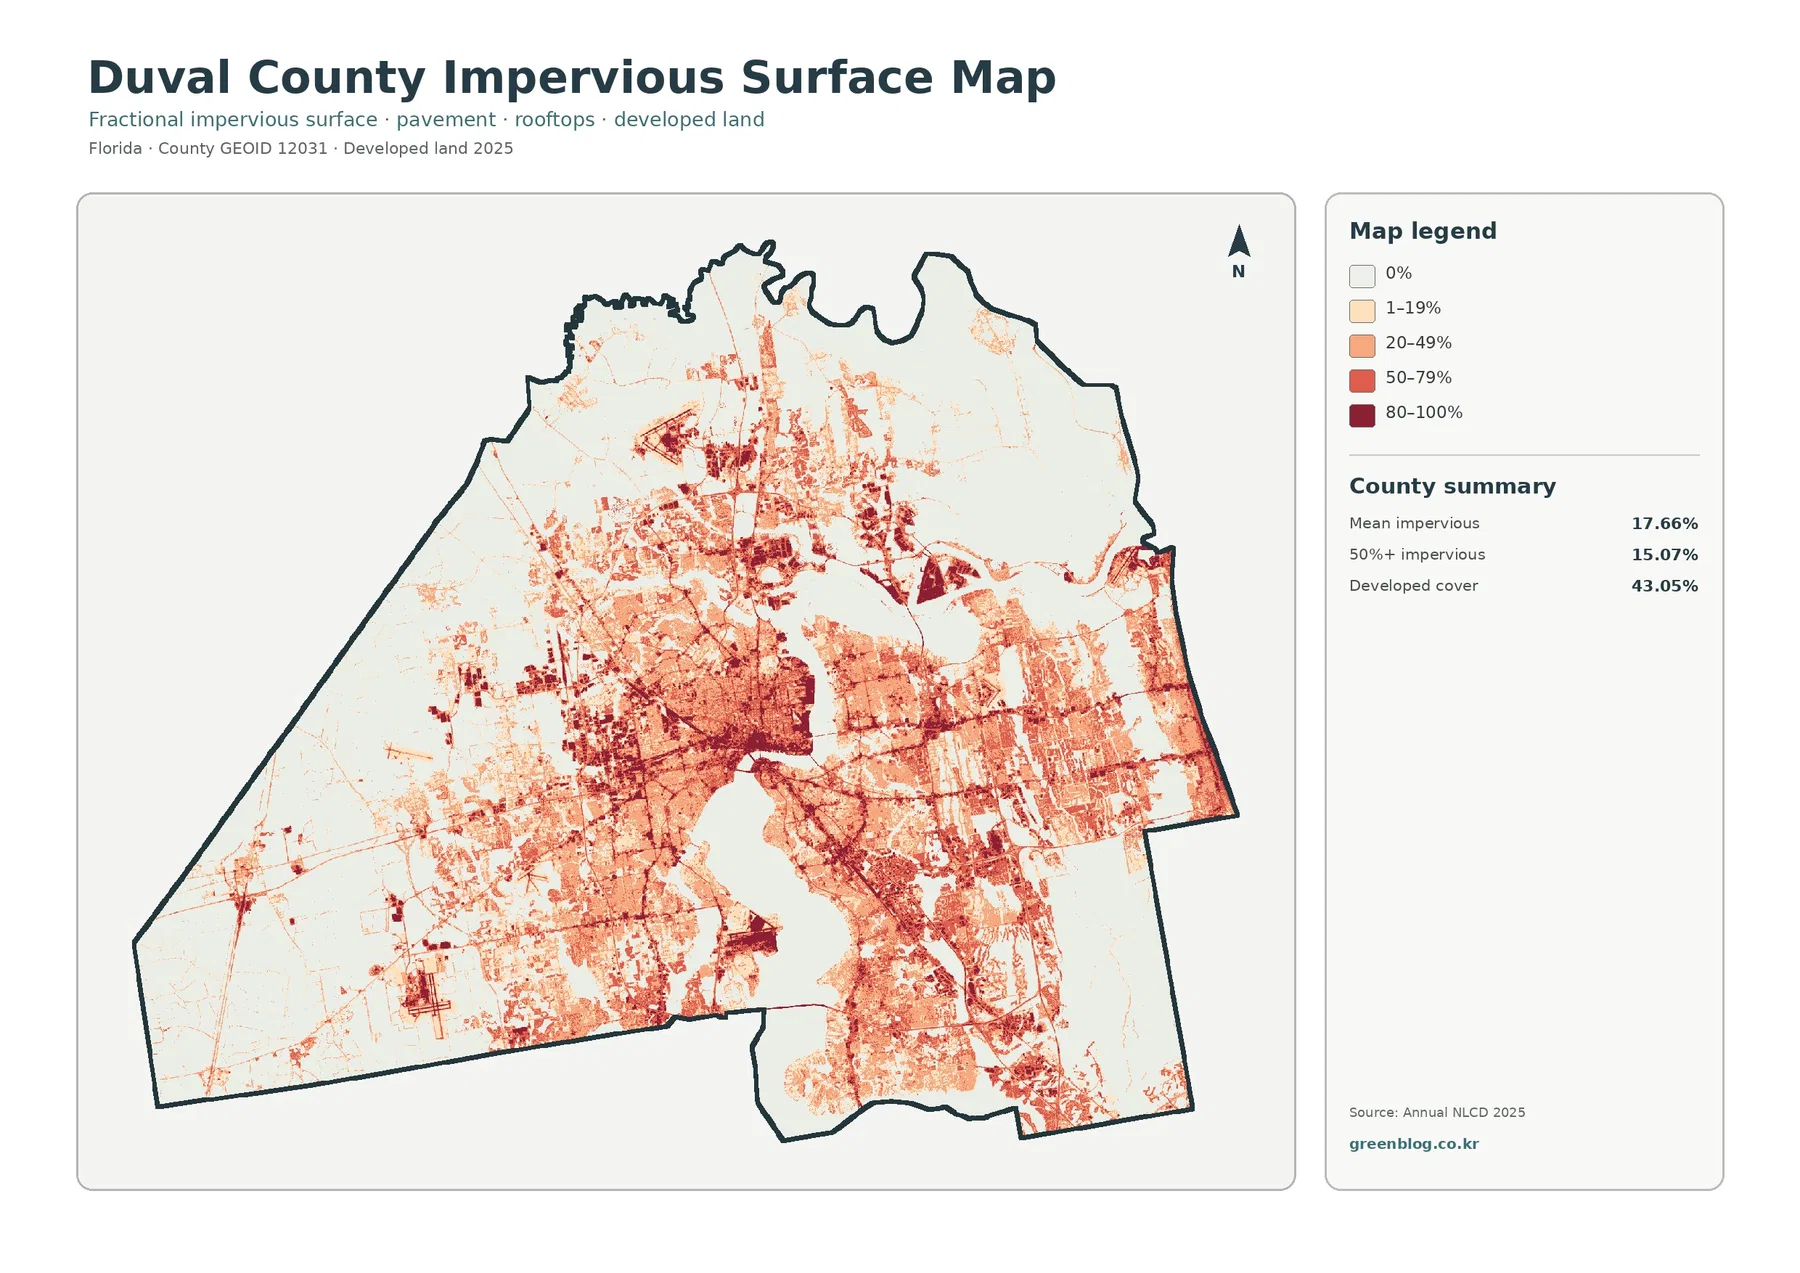
The impervious-surface map answers a different question from the general developed class. It emphasizes pavement, rooftops, parking areas, and other hard surfaces that resist infiltration. Duval County’s mean impervious value is 17.66%, and 15.07% of the mapped area is at least 50% impervious. Those figures are far below the 43.05% developed-cover share because developed land can still contain lawns, trees, open ground, and other permeable surfaces.
The darkest tones cluster through the central urban area and in several eastern and southern concentrations. Narrow linear features connect many of those zones, while the west and the northeastern natural areas remain much lighter. This makes the impervious map useful for separating the geographic extent of development from the intensity of hard surface within that development.
A cell with high impervious cover is not automatically a commercial or industrial site, and a lower value does not necessarily mean undeveloped land. Low-density neighborhoods, parks within developed areas, transportation edges, and mixed vegetation can all reduce the impervious percentage inside a developed setting. The map therefore should be read as a surface-cover layer rather than a land-use inventory.
The three development-related numbers should be kept separate. Developed cover at 43.05% describes the share classified as developed in the 2025 land-cover layer. Mean imperviousness at 17.66% is an average across the county. The 15.07% figure identifies the area where at least half of the surface is impervious. Together they show both the reach of urban cover and the places where pavement and rooftops are most concentrated.
Jacksonville’s Environmental Quality Division lists surface water, groundwater, wetlands, and wildlife among the resources it monitors and regulates within Duval County. That local context helps explain why a surface-cover map can be useful for broad environmental discussion. It does not turn the impervious layer into a regulatory map, however; site-specific decisions require the city’s current rules, surveys, and technical records.
Forest and farmland stand out more clearly once the urban surface is muted
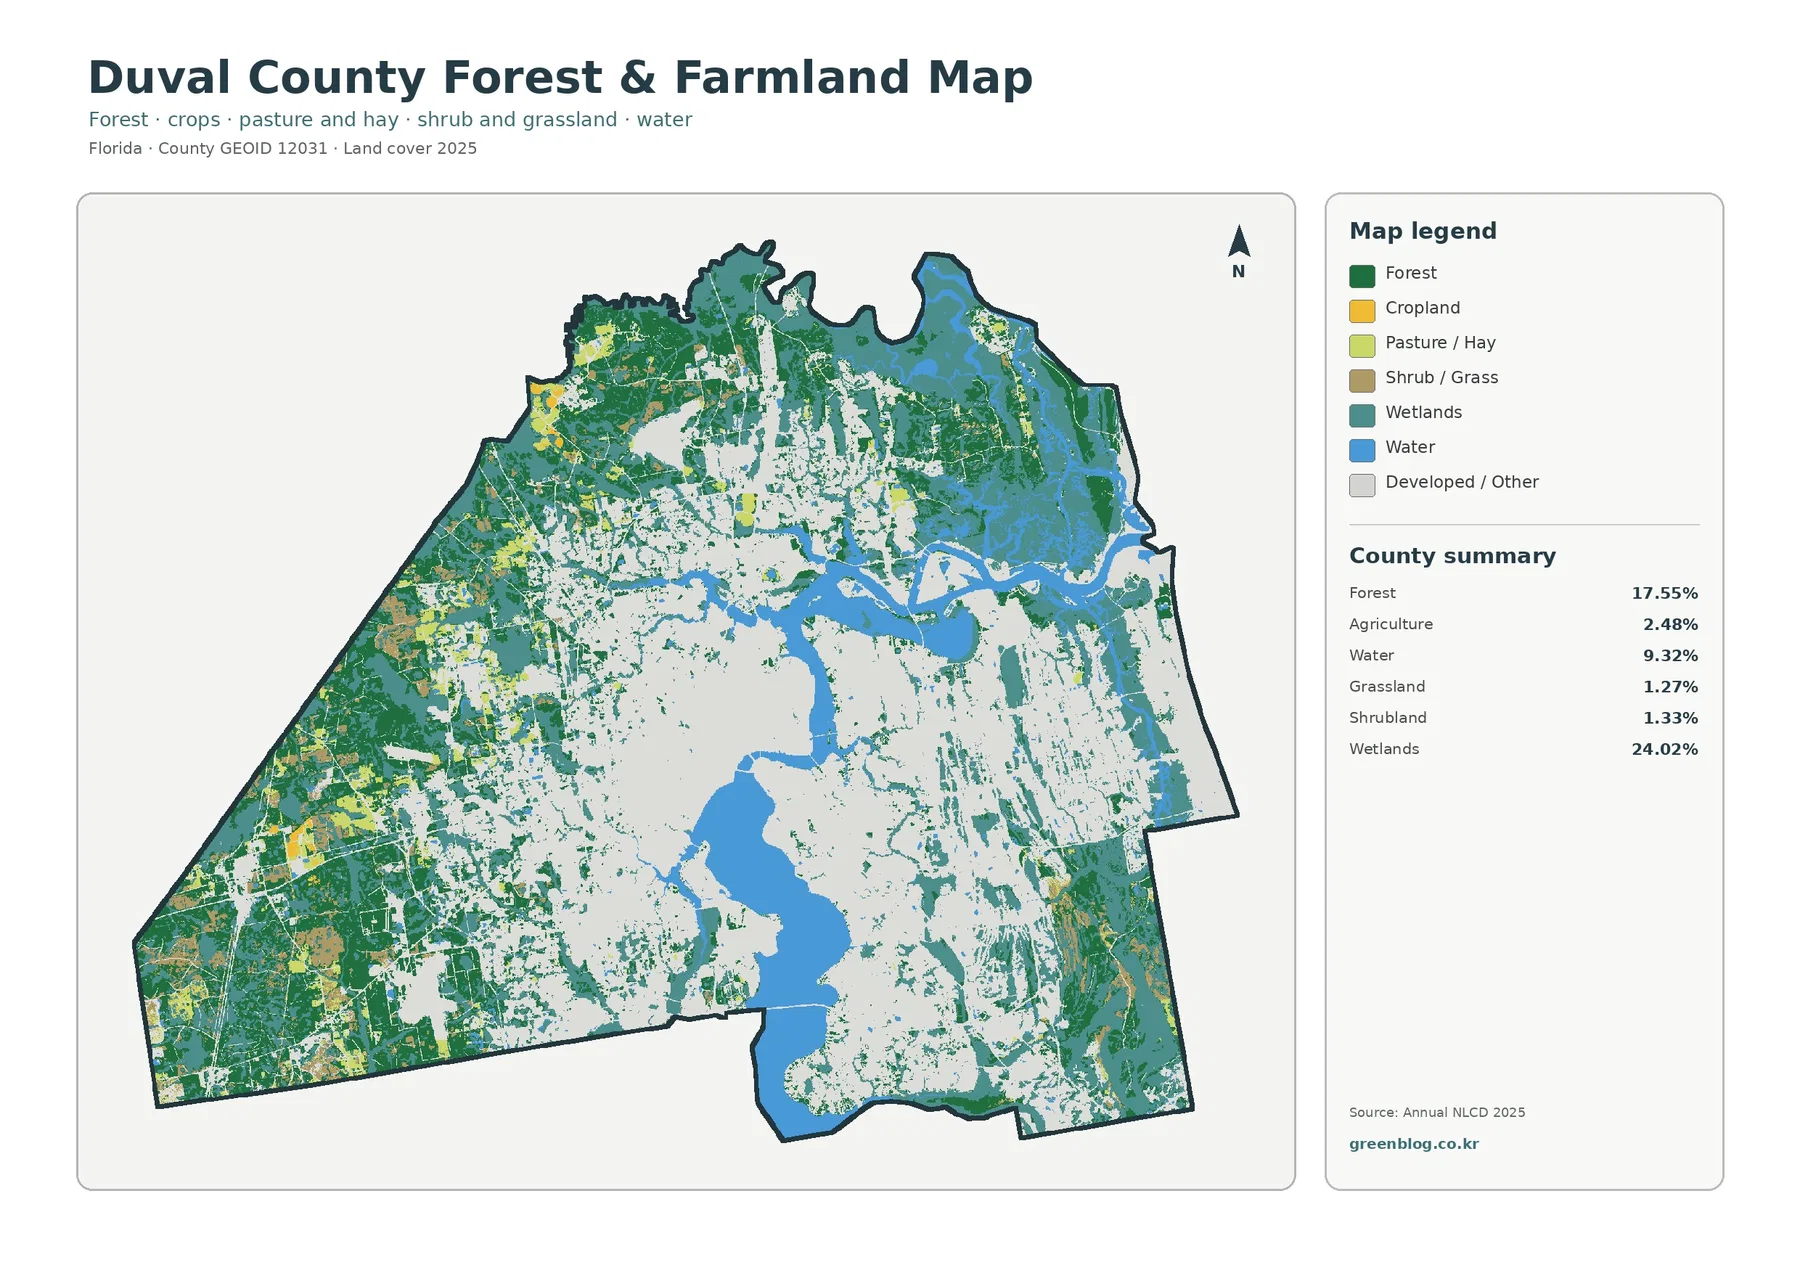
The forest-and-farmland view removes much of the visual weight of the urban area, allowing the county’s outer natural cover to stand out. Forest at 17.55% forms broad blocks in the west and north and also appears beside wetland areas. The pattern is more fragmented near the developed core, where natural cover is divided by roads, neighborhoods, and other mapped developed surfaces.
Agriculture makes up 2.48% of the county. Yellow agricultural patches are more noticeable on the western and northwestern side than in the urban center. The summary provides a combined agriculture value, so the image should not be used to invent separate cropland and pasture percentages. Its strength is positional: it shows where agricultural cover appears relative to forest, wetlands, and developed land.
Grassland at 1.27% and shrubland at 1.33% occur in smaller pieces. These classes can occupy transitional spaces between forest, wetland, agriculture, and development, but a map cell does not provide a complete description of vegetation management or habitat condition. A 30-meter classification generalizes the dominant surface, especially where multiple covers meet within one cell.
Wetlands remain one of the strongest features even in this focused map. The northeast contains extensive wetland and water cover, while forest wraps around many of those areas. This pattern makes it easier to see that Duval County’s greener land is not simply one continuous forest zone. It includes forest, wetland, water, and smaller agricultural or grass-covered areas arranged around a large developed center.
The National Park Service describes Timucuan Ecological & Historic Preserve in Jacksonville as a landscape of salt marshes, coastal dunes, hardwood hammocks, and estuarine waters near the meeting of the St. Johns and Nassau rivers with the Atlantic. That official description provides useful geographic context for the wetland and water pattern in northeastern Duval County. The preserve boundary itself is not shown by this land-cover map and should be checked on an official park map when exact limits matter.
The 1985–2025 layer is a map of class differences, not a simple development total
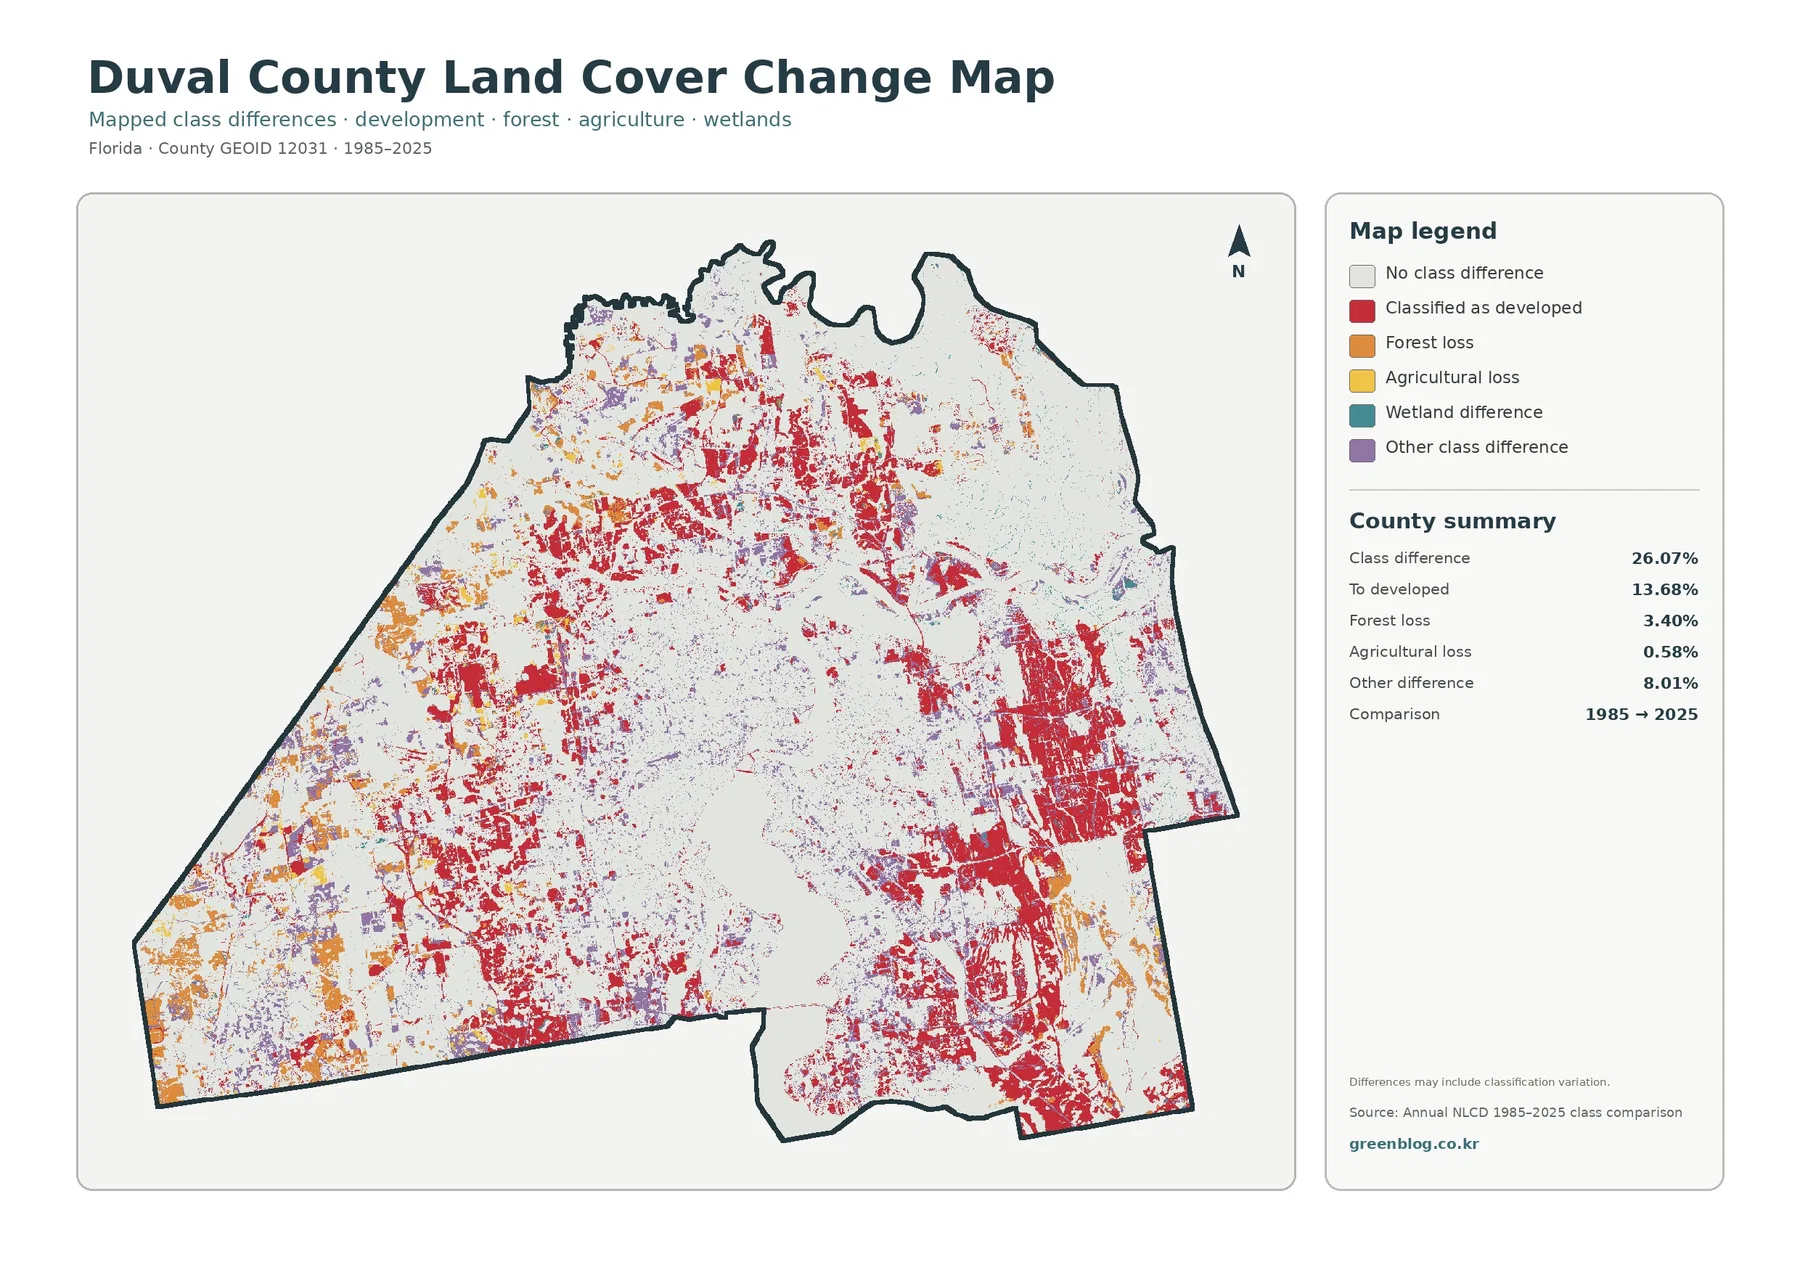
The change layer reports a 26.07% overall class difference between 1985 and 2025. The note printed on the map is important: some of that difference may reflect classification variation rather than a verified physical change on the ground. Different imagery, edge conditions, mixed pixels, or classification methods can move a cell from one category to another even when the landscape change is subtle.
The largest named change category is ‘to developed’ at 13.68%. Red change areas appear around many of the current developed zones and across several expanding outer sections. This value should not be described as a 13.68% increase in total developed land. It represents cells whose class changed to developed between the two comparison years, which is a different measurement from the current 43.05% developed share.
Forest loss is listed at 3.40% and agricultural loss at 0.58%. Orange and yellow change patches appear in several western and northern areas, but the map alone cannot explain why a cell changed class. Timber harvest, urban conversion, vegetation succession, mapping differences, or other processes would need supporting records or intermediate-year data before a cause could be stated confidently.
Other class differences account for 8.01%. The legend also includes a wetland-difference category, although the county summary does not provide a separate wetland percentage. That is a good reason not to estimate missing values by eye. The layer is most useful for locating areas that deserve closer comparison with annual land-cover data or local records.
For presentations, the change map works best beside the 2025 map. A reader can compare current developed land with cells that changed to developed, inspect whether forest-loss areas now fall within developed or other cover, and see where class differences occur near water and wetlands. Keeping current status and change information on separate maps reduces the risk of treating two different measurements as the same statistic.
Water and wetlands help explain the northeastern side of Duval County
Water occupies 9.32% of the 2025 land-cover summary, which is unusually visible for a county-level map. The St. Johns River and connected waterways divide the developed area and widen toward estuarine environments. In the northeast, blue water and teal wetlands spread across large areas that contrast sharply with the denser urban surface farther south and west.
Water and wetlands should not be treated as interchangeable categories. Open-water cells represent visible water surfaces, while wetlands can include vegetated land influenced by saturated soils or recurring water conditions. That distinction helps explain why wetlands cover 24.02% even though water itself is 9.32%. Looking at both colors together gives a more complete picture of the county’s river and estuary setting.
The Timucuan Preserve provides a useful real-world reference for this pattern. The National Park Service describes one of the Atlantic Coast’s major remaining coastal-wetland landscapes, including salt marshes and hardwood hammocks within Jacksonville. Those descriptions align with the broad wetland and forest pattern visible in northeastern Duval County, but the land-cover layer does not identify park ownership or legal protection status.
Urban and natural cover occur close together in several parts of the county. That proximity can be shown safely as a geographic observation: developed land, high-impervious areas, rivers, and wetlands appear near one another. The maps do not by themselves prove that one feature caused a change in another. Water quality, flooding, habitat condition, and regulatory status each require additional datasets and professional analysis.
Using the four maps together produces a clearer county profile
The general map is the best starting point when the audience needs a quick overview. It shows that Duval County is 43.05% developed while still containing 24.02% wetlands, 17.55% forest, and 9.32% water. That combination immediately explains why the county cannot be described only as an urban landscape or only as a coastal natural area.
The impervious map is the next step for an urban-surface question. Comparing 43.05% developed cover with 17.66% mean imperviousness shows that a large developed footprint can contain substantial permeable surface. Areas above 50% impervious cover, representing 15.07% of the county, isolate the more heavily paved and roofed portions of that broader urban footprint.
The forest-and-farmland map works better for outer-county comparisons. It reveals where forest blocks remain more continuous, where agricultural patches are concentrated, and where wetlands interrupt or border those green areas. This is especially useful when the full land-cover map feels visually dominated by the developed class.
The change layer adds a time comparison, but it should come last rather than first. Once the current distribution is understood, the 26.07% class-difference value and the 13.68% to-developed category are easier to interpret. Readers can then ask where the differences occur instead of assuming that every colored change cell records a single type of physical transformation.
Practical uses for classrooms, presentations, and county comparisons
For a classroom exercise, students can compare the developed percentage with the impervious statistics and explain why the numbers are different. A second activity can separate water from wetlands and use the northeast side of the county as an example. These tasks encourage readers to interpret the legend and statistics rather than simply identify colors.
A presentation about urban and natural environments can place the general map beside the impervious map. The first establishes the broad land-cover pattern; the second shows where hard surfaces are most concentrated. Adding the forest-and-farmland map afterward makes the western and northern green areas easier to discuss without the visual weight of the urban class.
When comparing Duval County with another Florida county, use the same data year and the same Annual NLCD classification. Developed cover alone is not enough for a fair comparison. Wetlands, forest, water, agriculture, mean imperviousness, and the share above 50% impervious can reveal very different county structures even when two places have similar developed percentages.
The 1985–2025 map can support a long-term comparison, but the same caution applies across counties: class differences may include classification variation. Matching years, definitions, and change categories is necessary before drawing conclusions about which county changed more.
Scale and classification limits matter when the map is enlarged
Annual NLCD land cover is commonly represented with 30-meter raster cells. Each cell receives a class even though the real ground may contain several materials or vegetation types. Mixed pixels are especially common along riverbanks, wetland edges, roads, neighborhoods, and forest boundaries. Those edge effects are part of the reason small shapes should not be treated as survey-quality boundaries.
A larger JPG makes the legend and small patches easier to see, but enlargement does not create finer source detail. Small drainage channels, narrow forest strips, individual buildings, property lines, and tiny wetland pockets can be generalized or absorbed into neighboring classes. Site-level questions require parcel, survey, wetland, flood, or permitting data that were designed for that purpose.
The 2025 layer is a snapshot for its classification year. Development, vegetation clearing, regrowth, flooding, or restoration that occurred afterward may not appear. The 1985–2025 comparison is also not a continuous record of every event during forty years. A location that changed several times may appear only as the difference between the two end points.
Used at the proper scale, the maps are strong visual tools. They support county-level land-cover comparison, environmental education, presentation graphics, and identification of areas for follow-up research. They are not substitutes for current legal, engineering, ecological, or property records.
What is included in the downloadable map set
The download contains the four original JPG maps used in this article: the 2025 general land-cover map, the forest-and-farmland map, the impervious/developed-land map, and the 1985–2025 class-difference map. The general view is best for an overall county profile, while the other three isolate specific questions about green cover, urban surface intensity, and long-term mapped differences.
For print or slides, it is usually clearer to show one map at a readable size and then add a second map for comparison. Placing all four on a single small page can make the legends difficult to read. The original JPG files are useful when a larger view of the legend, edge patterns, or small land-cover patches is needed.
Frequently Asked Questions
What is the largest land-cover class in Duval County in 2025?
Developed land is the largest class at 43.05%. Wetlands follow at 24.02%, then forest at 17.55%, water at 9.32%, agriculture at 2.48%, shrubland at 1.33%, and grassland at 1.27%. The map shows the developed core across much of the center and southeast, with extensive wetlands and water in the northeast and larger forest areas toward the west and north.
Why is developed cover 43.05% while mean imperviousness is only 17.66%?
The developed land-cover class can include trees, lawns, bare ground, and other permeable surfaces mixed with buildings and pavement. Imperviousness measures the share of hard surface such as rooftops and pavement. In Duval County, 15.07% of the mapped area is at least 50% impervious, which identifies the more heavily hardened parts of the larger developed footprint.
Does the 26.07% class difference mean 26.07% of the county was physically transformed?
Not necessarily. The 26.07% figure represents cells classified differently in 1985 and 2025, and the map itself warns that classification variation may be included. The 13.68% to-developed category, 3.40% forest loss, and 0.58% agricultural loss are useful for locating change candidates, but the exact cause and timing require additional annual data or local records.
Map File Information
The four original JPG land-cover maps for Duval County, Florida are included together in one ZIP file.
- Included Files: Use only the versions confirmed in the article and supplied images
- File Type: Use the confirmed download contents
- Intended Use: Printing, education, presentations, and map-based projects
Related Maps
- Alachua County Florida Land Cover Map
- Baker County Florida Land Cover Map
- Bay County Florida Land Cover Map
Sources and References
- MRLC Annual NLCD Data – source data for the 2025 land-cover and 1985–2025 comparison layers
- USGS Annual NLCD Land Cover Classification – definitions for developed land, forest, wetlands, agriculture, water, and related classes
- U.S. Census Bureau TIGER/Line Shapefiles – official geographic boundary reference for Duval County
- City of Jacksonville Environmental Quality Division – local context for water, wetlands, wildlife, and environmental management in Duval County
- National Park Service – Timucuan Ecological & Historic Preserve – official background on the St. Johns and Nassau river estuary, coastal wetlands, and forest environments in Jacksonville
Green Map creates custom-edited map images using open geographic data sources such as geoBoundaries, Natural Earth, OpenStreetMap, and government open data.
These maps are edited visual materials, not raw data files, and are provided for education, documents, presentations, and graphic reference.