Calhoun County in the Florida Panhandle has a land-cover pattern shaped by broad wetlands, forest, open vegetation, farmland, and a relatively small developed footprint. This page brings together four matching views: 2025 land cover, forest and farmland, impervious surface and developed land, and mapped class change from 1985 to 2025.
The four original JPG maps are available in one download farther down the page. Before downloading, the sections below explain where the strongest patterns appear, how the Blountstown area differs from the more rural parts of the county, and why the change map should be read as a classification comparison rather than a parcel-level record of land-use history.
Table of Contents
Wetlands set the county-wide pattern
Wetlands are the dominant mapped cover in the 2025 county summary at 32.77 percent. Forest accounts for 19.77 percent, grassland 15.84 percent, shrubland 12.94 percent, and agriculture 11.62 percent. Those numbers describe a county where several natural and working-land covers share the landscape rather than one class occupying almost everything.
The spatial arrangement matters as much as the percentages. Wetland colors form a broad presence along the winding eastern side of the county and across substantial southern and interior areas. Forest, shrubland, grassland, and agricultural patches break up that wetland pattern, producing frequent transitions over short distances instead of a simple north-south split.
UF/IFAS Extension describes Calhoun County as a rural county with strong agriculture and natural-resource interests and notes that it is home to the Chipola and Apalachicola rivers. That local context helps explain why water and wetland corridors deserve attention when reading the maps. The maps themselves do not label every stream, so named river interpretation is best paired with an official hydrography or recreation source.
Development is much more concentrated. A clear cluster appears in the east-central part of the county around Blountstown, while most other developed features are thin lines or small nodes associated with roads and scattered settlements. Large uninterrupted urban surfaces are uncommon in the county-wide view, which is consistent with the low impervious figures shown on the dedicated impervious-surface map.
Reading the 2025 land-cover mosaic
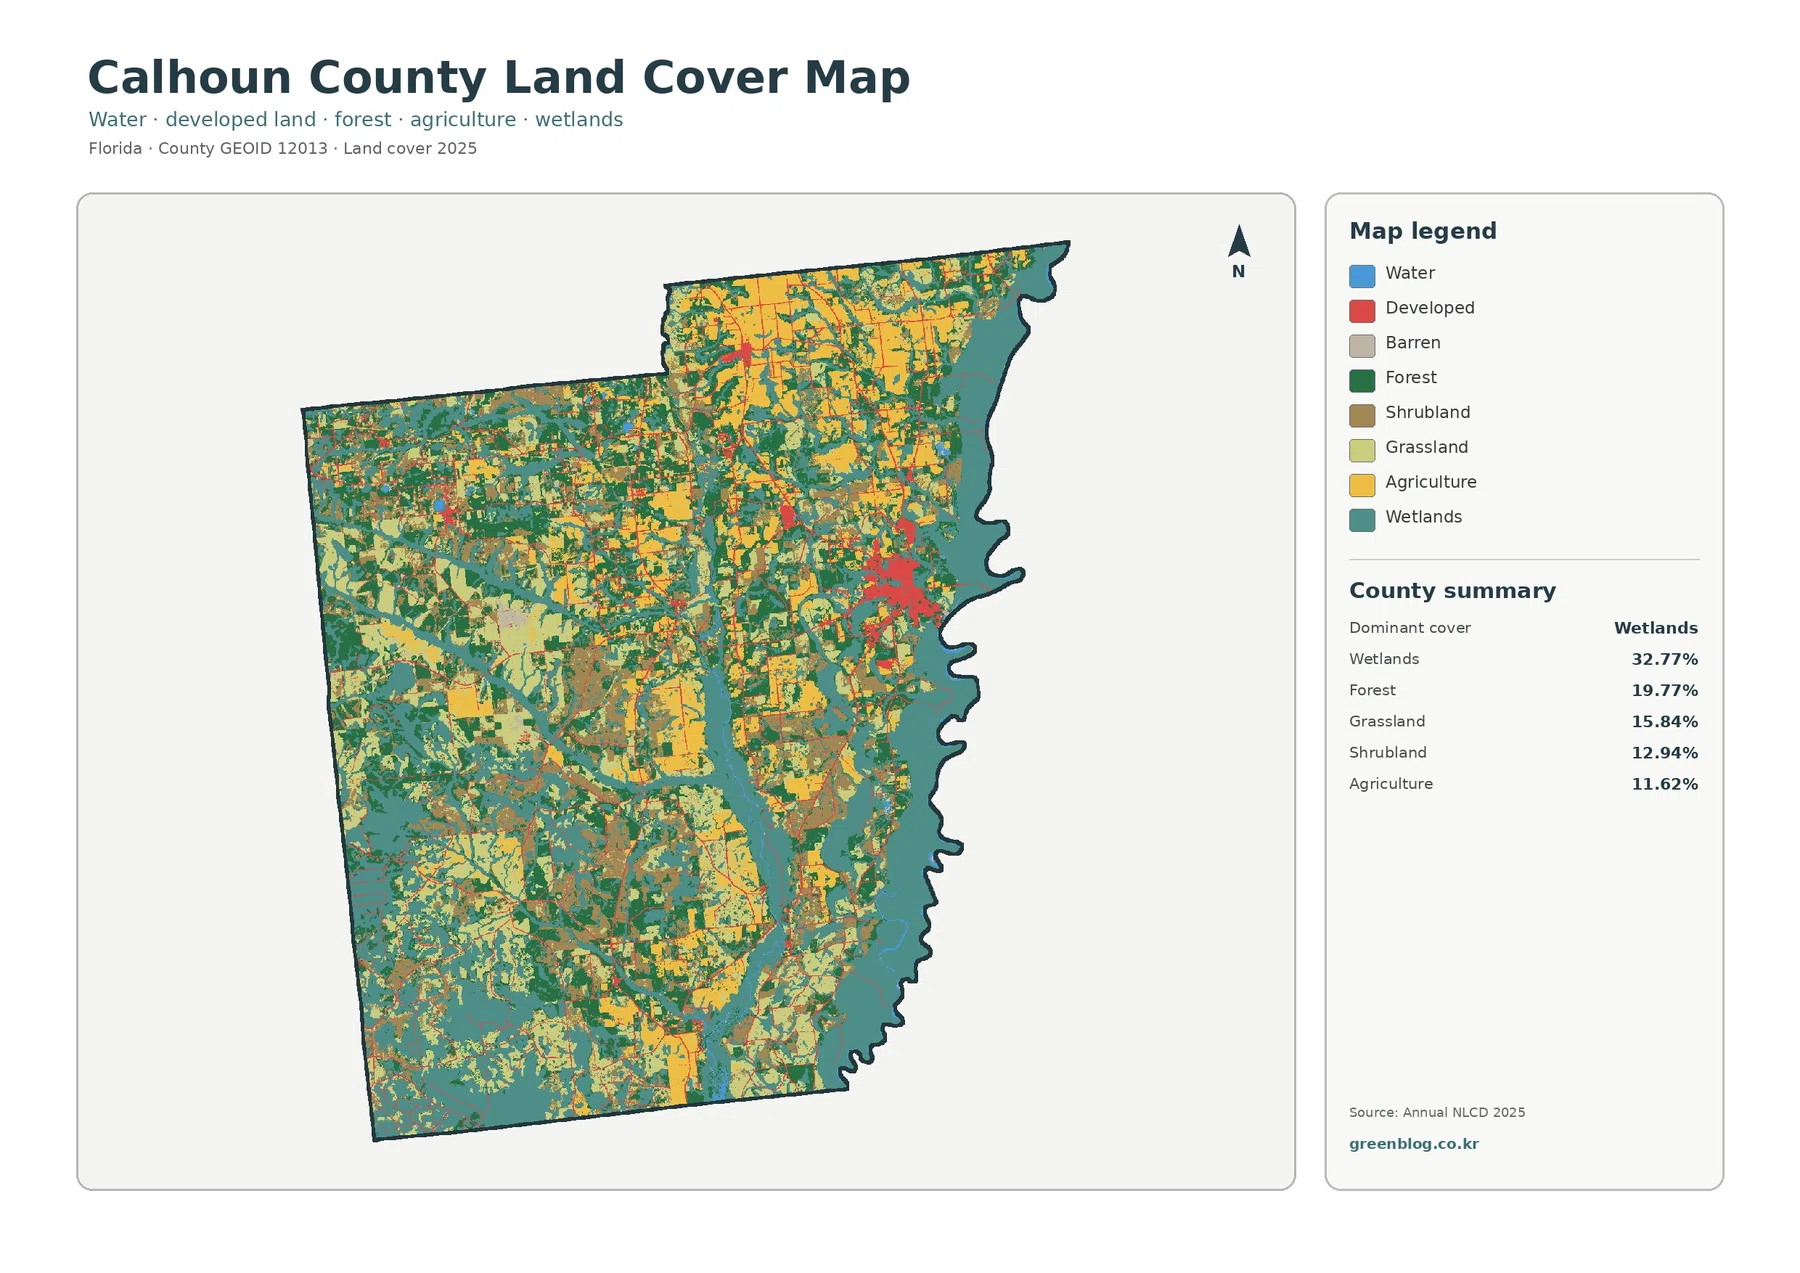
The general land-cover map is the best place to start because every major class can be compared in one frame. Teal wetland areas are especially extensive along the eastern edge and in the lower half of the county. Green forest patches are widespread through the west and center, but they are repeatedly interrupted by open vegetation, agricultural fields, and wetland corridors.
Agriculture is visually prominent in the north, where yellow areas form some of the county’s largest coherent field patterns. Smaller agricultural patches also occur through the central and southern sections. Although agriculture represents 11.62 percent of the summary, the bright map color makes fields easy to locate, so readers should use the percentage rather than visual brightness when comparing total area.
Developed land is summarized at 5.86 percent. The strongest red cluster sits around the Blountstown area near the eastern side of the county, with much thinner traces extending outward along local transportation routes. This pattern is useful for comparing the compact settlement footprint with the much broader wetland, forest, grassland, and shrubland matrix that surrounds it.
Water is listed at 0.91 percent on the forest-and-farmland summary. A narrow river can occupy little total area while remaining geographically important because it extends for many miles. For that reason, water and wetland colors should be read together when studying river corridors, floodplain environments, or the way fields and forest patches stop at wetter ground.
Forest and farmland do not occupy separate halves of Calhoun County
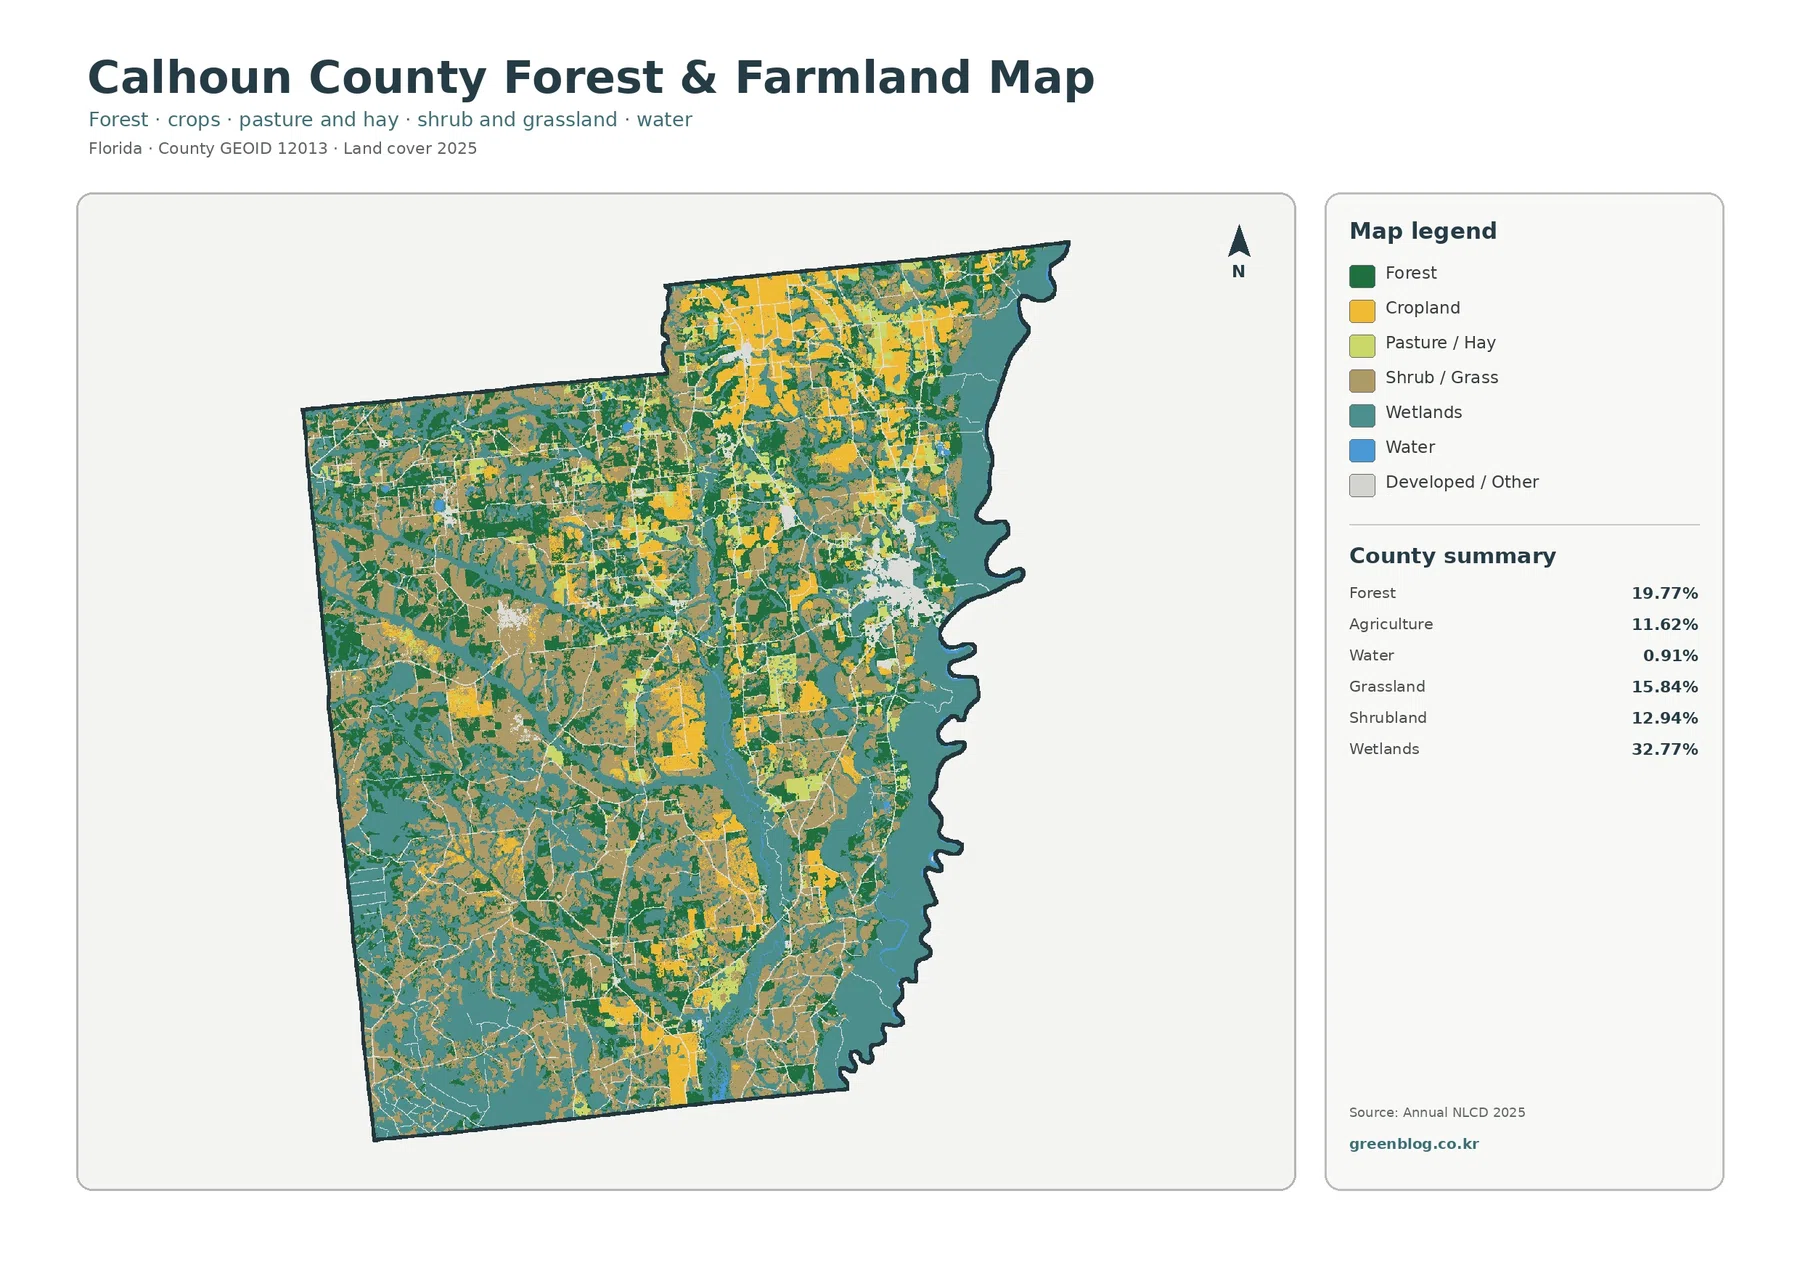
The forest-and-farmland view makes the rural pattern easier to separate from the full legend. Cropland is strongest across portions of the north and northeast, with additional field blocks scattered through the center and south. Forest is more continuous in parts of the west and center, yet it frequently borders wetlands and open vegetation rather than forming one unbroken western forest block.
Forest covers 19.77 percent of the county summary. The map shows that this forest is distributed through many medium and large patches, which matters for anyone comparing habitat or rural landscape context. A single county percentage cannot tell whether forest is one large tract or a patchwork; here, the mapped pattern clearly favors a patchwork interwoven with wet and open land.
Grassland at 15.84 percent and shrubland at 12.94 percent are also major parts of the visible landscape. These classes should not be treated as farmland simply because they are open covers. They can represent different vegetation conditions and management histories, so the legend is essential when distinguishing cropland from pasture, grassy openings, or shrub-dominated areas.
UF/IFAS Extension Calhoun County focuses much of its local programming on agriculture and natural resources. That is useful context for a county where working lands sit directly beside forest, wetlands, and open vegetation. The map does not identify individual crops, ownership, farm boundaries, or zoning, however, so those questions require agricultural records or parcel data rather than land-cover colors.
For a quick field-pattern scan, begin with the larger yellow areas in the north and then follow smaller agricultural patches southward. For forest, compare the darker green areas in the west and center with the teal wetlands beside them. This approach reveals how frequently the landscape changes from one cover to another without assuming that a color transition is a legal property boundary.
Impervious surfaces stay low outside the Blountstown cluster
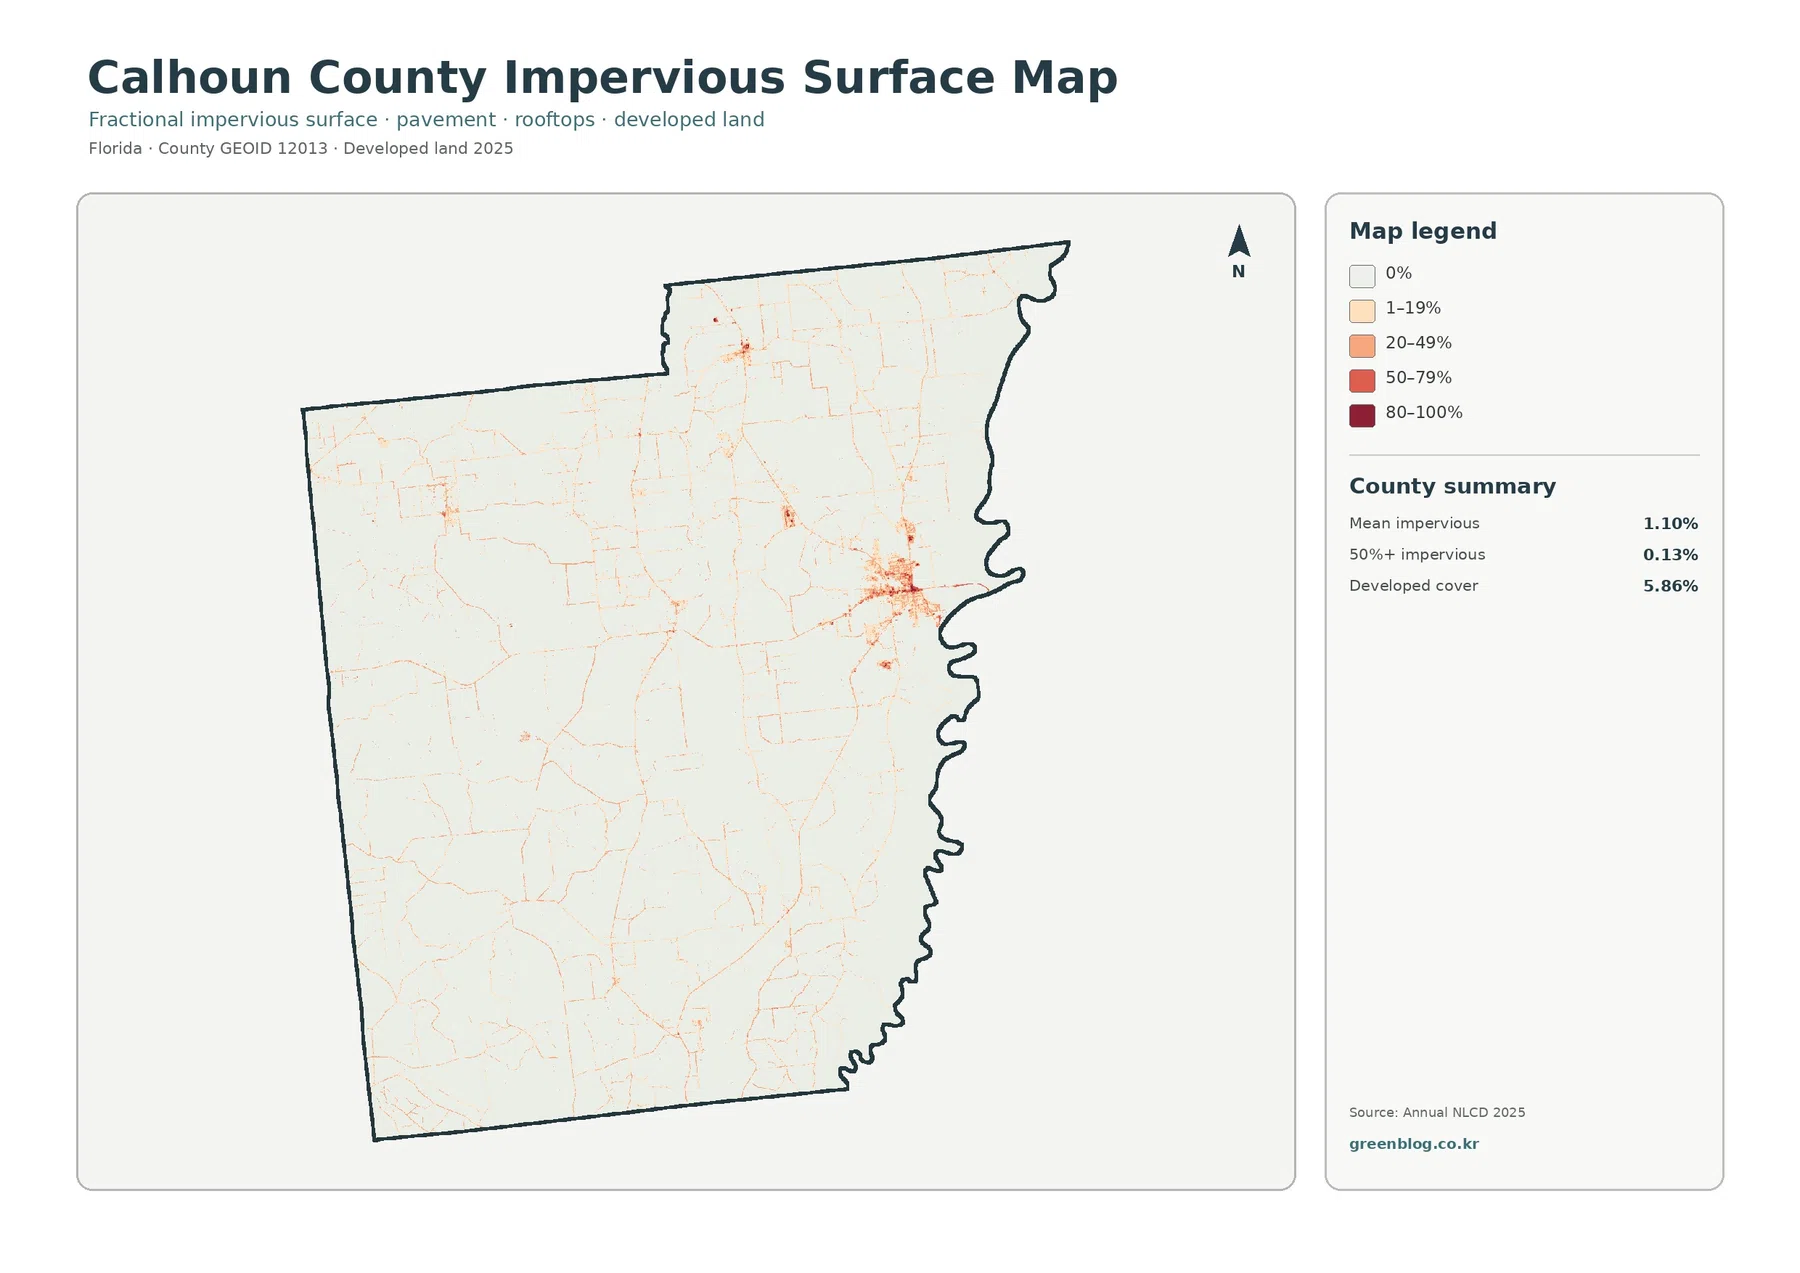
An impervious surface is a hard surface such as pavement or a rooftop where water does not readily soak into the ground. Most of Calhoun County is mapped at zero or very low impervious intensity. The strongest orange and red concentration is around Blountstown, while the rest of the county is crossed mainly by fine road-like traces and small localized nodes.
The county summary reports a mean impervious value of 1.10 percent. Only 0.13 percent of the mapped area reaches 50 percent or greater imperviousness, while developed cover totals 5.86 percent. Together, these figures describe a rural county where developed land exists but high-intensity hard surfaces occupy a very small share of the total landscape.
Calhoun County’s official website and UF/IFAS both place county offices in Blountstown, providing independent local confirmation that the east-central development cluster corresponds to the county’s main civic center. The impervious map still cannot distinguish a courthouse from a store, a school, a house, or a parking lot. It measures surface intensity and developed cover, not building function.
Comparing imperviousness with wetlands is useful because the two maps answer different questions. One identifies hard, built surfaces; the other identifies broader cover classes, including wetland environments. A road or settlement may sit close to a wetland corridor, but proximity alone does not establish that development caused a hydrologic or ecological effect. Such conclusions need separate water-quality, drainage, or engineering evidence.
What changed between 1985 and 2025?
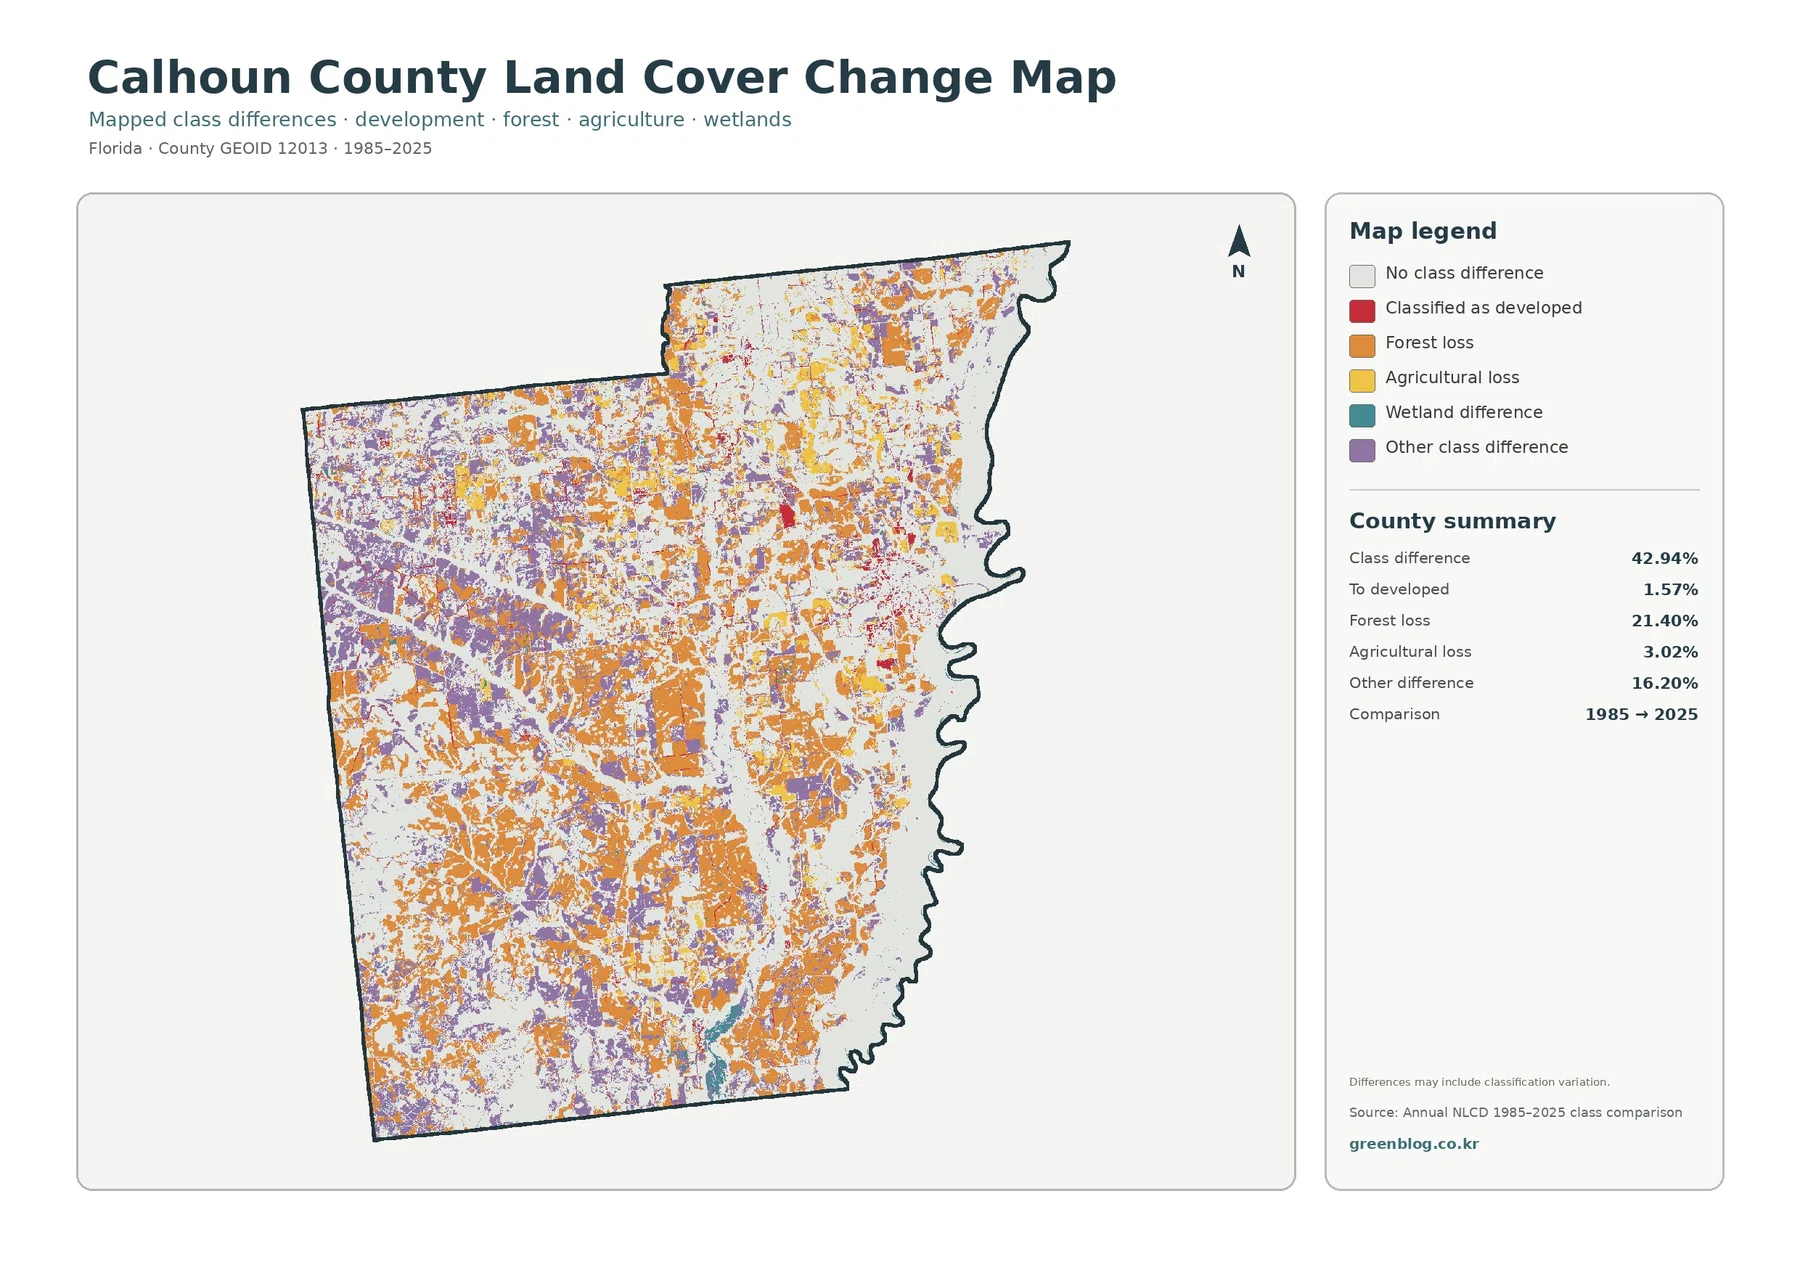
The change map reports a class difference across 42.94 percent of the county. That number is intentionally broader than a simple measure of physical land conversion. It indicates places where the two mapped classifications differ, and the map itself warns that some differences can reflect classification variation rather than a direct, observable change on the ground.
Within the summary, 1.57 percent is classified as change to developed land, 21.40 percent as forest loss, 3.02 percent as agricultural loss, and 16.20 percent as other difference. Orange forest-loss pixels are distributed widely through the west, south, and north. Purple other-difference areas are also widespread, while red developed conversions are much smaller and more localized.
The 21.40 percent forest-loss category is significant enough to deserve attention, but it should not automatically be read as logging or urban expansion. A long comparison interval can include transitions among forest, shrub, grass, agriculture, and wetland classes, and classification methods or observation conditions can also influence the result. Aerial imagery and year-specific datasets are needed to identify the cause at a particular location.
Wetland and other class differences appear especially complex in the southern and eastern portions of the map. Wet areas can be sensitive to seasonal water conditions and vegetation differences in remote-sensing imagery. A colored pixel in the change map is therefore a useful flag for closer review, not proof that a wetland was drained, created, or permanently converted.
A practical reading sequence is to compare white areas with colored areas first, then isolate the orange forest-loss category, and finally examine the smaller red developed-conversion features. That sequence makes the county-wide distribution of change easier to understand. In Calhoun County, the broad story is not a blanket spread of development; forest and other class differences occupy far more of the change map.
River corridors help explain the wetland geography
Calhoun County sits between major river environments in northwest Florida. UF/IFAS identifies both the Chipola and Apalachicola rivers as important local natural resources, and the Florida Fish and Wildlife Conservation Commission describes the Chipola as a spring-fed river that flows south through the region and eventually reaches the Apalachicola River. Those sources provide useful geographic context for the wetland-heavy map.
The county’s winding eastern edge aligns with the Apalachicola River corridor, where the land-cover map shows broad wetland cover. Inside the county, additional water and wetland features extend through the landscape in narrow and broad forms. Because this is a land-cover product rather than a detailed hydrography map, readers should use an official river map when they need exact tributary names, access points, or channel locations.
Wetland geography also changes how the agricultural pattern looks. Some field blocks are large and regular, while others stop abruptly at darker wetland or forest colors. That does not mean the map is showing property or regulatory boundaries. It simply records different surface-cover classes in adjacent raster cells, which can help identify broad transitions but not legal limits.
Choosing the right map for a specific question
Use the full 2025 land-cover map when you need one county-wide reference. It is the strongest option for comparing the northern agricultural blocks, the extensive eastern and southern wetlands, the forest and open-land mosaic, and the compact Blountstown development cluster at the same time. It also provides the most complete legend for presentations that introduce the county.
The forest-and-farmland map is better when the main question concerns rural land patterns. It reduces visual competition from some of the general classes and makes cropland, forest, pasture or hay, shrub and grass cover, wetlands, and water easier to compare. This is particularly useful in Calhoun County because forest and farmland are interspersed rather than separated into two simple zones.
Choose the impervious-surface map to examine settlement intensity. The Blountstown cluster stands out immediately, while road traces and smaller developed nodes remain visible elsewhere. The map is useful for watershed or development-context discussions, but it should not be used to identify exact building footprints, parcel impervious percentages, or infrastructure ownership.
The 1985–2025 change map serves a different purpose: finding places where classifications differ over a long interval. It is a screening and comparison tool. If a location matters for planning, conservation, forestry, or historical research, use the change category as a starting point and then verify it with dated imagery, management records, or other authoritative datasets.
Land cover is not zoning, ownership, or a parcel survey
Land cover describes what the ground surface is classified as: forest, agriculture, wetland, water, developed cover, grassland, shrubland, and similar categories. Zoning describes legal development rules. Ownership identifies who holds a property interest. Land use describes how land is used. These concepts can overlap in practice, but the colored cells on this page do not substitute for any of those records.
Annual NLCD products are raster datasets, meaning the landscape is divided into grid cells and each cell receives a representative classification. At edges, one cell can contain more than one real-world surface. Such a mixed pixel might include road, forest, lawn, or wet ground together, while the final map still displays a single class or impervious value for that cell.
This generalization is appropriate for county-scale comparison but not for surveying a property boundary. Narrow roads, small ponds, individual buildings, small wetlands, and sharp field edges can be simplified at the map scale. Anyone making a legal, engineering, environmental-permitting, or parcel-level decision should consult current high-resolution and authoritative records in addition to these maps.
The observation year matters too. The 2025 maps represent the supplied 2025 classification and may not capture changes that occurred afterward. The 1985–2025 product compares endpoints and cannot describe every intermediate change. A field could have changed classes more than once during four decades and still appear only through the relationship between the two selected years.
Ways to use the four-map set
For a classroom or presentation, place the general land-cover map first, then use the forest-and-farmland map to simplify the rural pattern. Follow with the impervious map to highlight Blountstown and the road network, and finish with the change map to discuss long-term classification differences. Because the county boundary is consistent, viewers can compare the same location across all four images.
A watershed-focused lesson can start with the 32.77 percent wetland share and ask where those wetlands actually occur. Students can then compare water at 0.91 percent with the much larger wetland footprint, showing why open water and wetland are not interchangeable categories. Official Chipola and Apalachicola River sources can add named geographic context without forcing the land-cover map to do the job of a river map.
For county comparisons, use maps created from the same year and classification system whenever possible. Calhoun County offers several useful comparison points: wetlands are the dominant 2025 class, developed cover is concentrated rather than extensive, mean imperviousness is low, and the long-term map contains broad forest and other classification differences. Those characteristics can be compared with neighboring or more urban Florida counties.
Frequently Asked Questions
What is the largest land-cover class in Calhoun County in 2025?
Wetlands are the largest class in the supplied 2025 summary at 32.77 percent. Forest follows at 19.77 percent, with grassland at 15.84 percent, shrubland at 12.94 percent, and agriculture at 11.62 percent. Wetland cover is especially prominent along the eastern side and through southern and interior corridors.
Which map is best for seeing development around Blountstown?
The impervious-surface and developed-land map provides the clearest view. It shows the strongest impervious concentration around Blountstown while most of the county remains at low values. The county summary gives a mean impervious value of 1.10 percent and developed cover of 5.86 percent.
Does the 42.94 percent class difference mean that nearly half the county physically changed?
No. The 42.94 percent value means the 1985 and 2025 mapped classifications differ in those cells. Some differences may represent real land-cover change, while others can reflect classification variation or observation differences. Use the change map to identify areas for further review rather than as a parcel-level change record.
Map File Information
Download the four original JPG maps used for this Calhoun County land-cover guide in a single ZIP file.
- Included Files: Use only the versions confirmed in the article and supplied images
- File Type: Use the confirmed download contents
- Intended Use: Printing, education, presentations, and map-based projects
Related Maps
- Alachua County Florida Land Cover Map
- Baker County Florida Land Cover Map
- Bay County Florida Land Cover Map
Sources and references
- MRLC Annual NLCD Data – Annual NLCD land-cover and related datasets
- USGS Annual NLCD Land Cover Classification – official class definitions and documentation
- U.S. Census Bureau TIGER/Line Shapefiles – county boundary reference
- UF/IFAS Extension Calhoun County – local agriculture, natural resources, and river context
- Florida Fish and Wildlife Conservation Commission – Chipola River – official Chipola River location and river information
- Calhoun County, Florida – About – official county and Blountstown information
Green Map creates custom-edited map images using open geographic data sources such as geoBoundaries, Natural Earth, OpenStreetMap, and government open data.
These maps are edited visual materials, not raw data files, and are provided for education, documents, presentations, and graphic reference.