The Gray County Texas Map on this page is available as high-resolution JPG files that you can download in one ZIP archive, with WebP previews below for quick viewing. Pampa occupies the northwest, Lefors sits closer to the middle, and McLean is near the southeastern edge. Across the center, the North Fork Red River cuts through a dense set of tributary valleys, while McClellan Creek and Lake McClellan define another drainage area farther south. Comparing these places with the road, water, and elevation views shows that Gray County is much more varied than a simple Panhandle outline might suggest.
The package contains four actual map views: a general county map, a city-connections map, a terrain and water map, and an elevation map. The on-page images are sized for quick reading, while the matching JPG files retain more detail for printing, presentations, and closer inspection. Together they show where the main communities sit, how the major road corridors differ between the north and south, where the river system becomes most intricate, and why the western side looks broader and higher than the stream-cut country to the east.
Pampa is the easiest place to use as an initial reference because the strongest concentration of roads and labels appears around the city. Yet it is not in the geographic center of Gray County. Moving southeast toward Lefors brings the map closer to the North Fork Red River breaks, while McLean belongs to a different travel corridor near Interstate 40. The elevation view reinforces that contrast: the northwest is part of a broader high surface, whereas the central and eastern half is carved by lower valleys that branch away from the main streams.
Table of Contents
Pampa and the two main road settings in Gray County
The general county map gives Pampa the clearest visual emphasis. The city sits in the northwest, where several major routes meet or pass nearby. U.S. Highway 60 crosses the Pampa area and continues east, State Highway 152 is also labeled near the city, and State Highway 70 provides an important north-south reference on the western side. These routes make the northwestern part of the county look much more road-focused than the broad interior areas where drainage lines outnumber settlement labels.
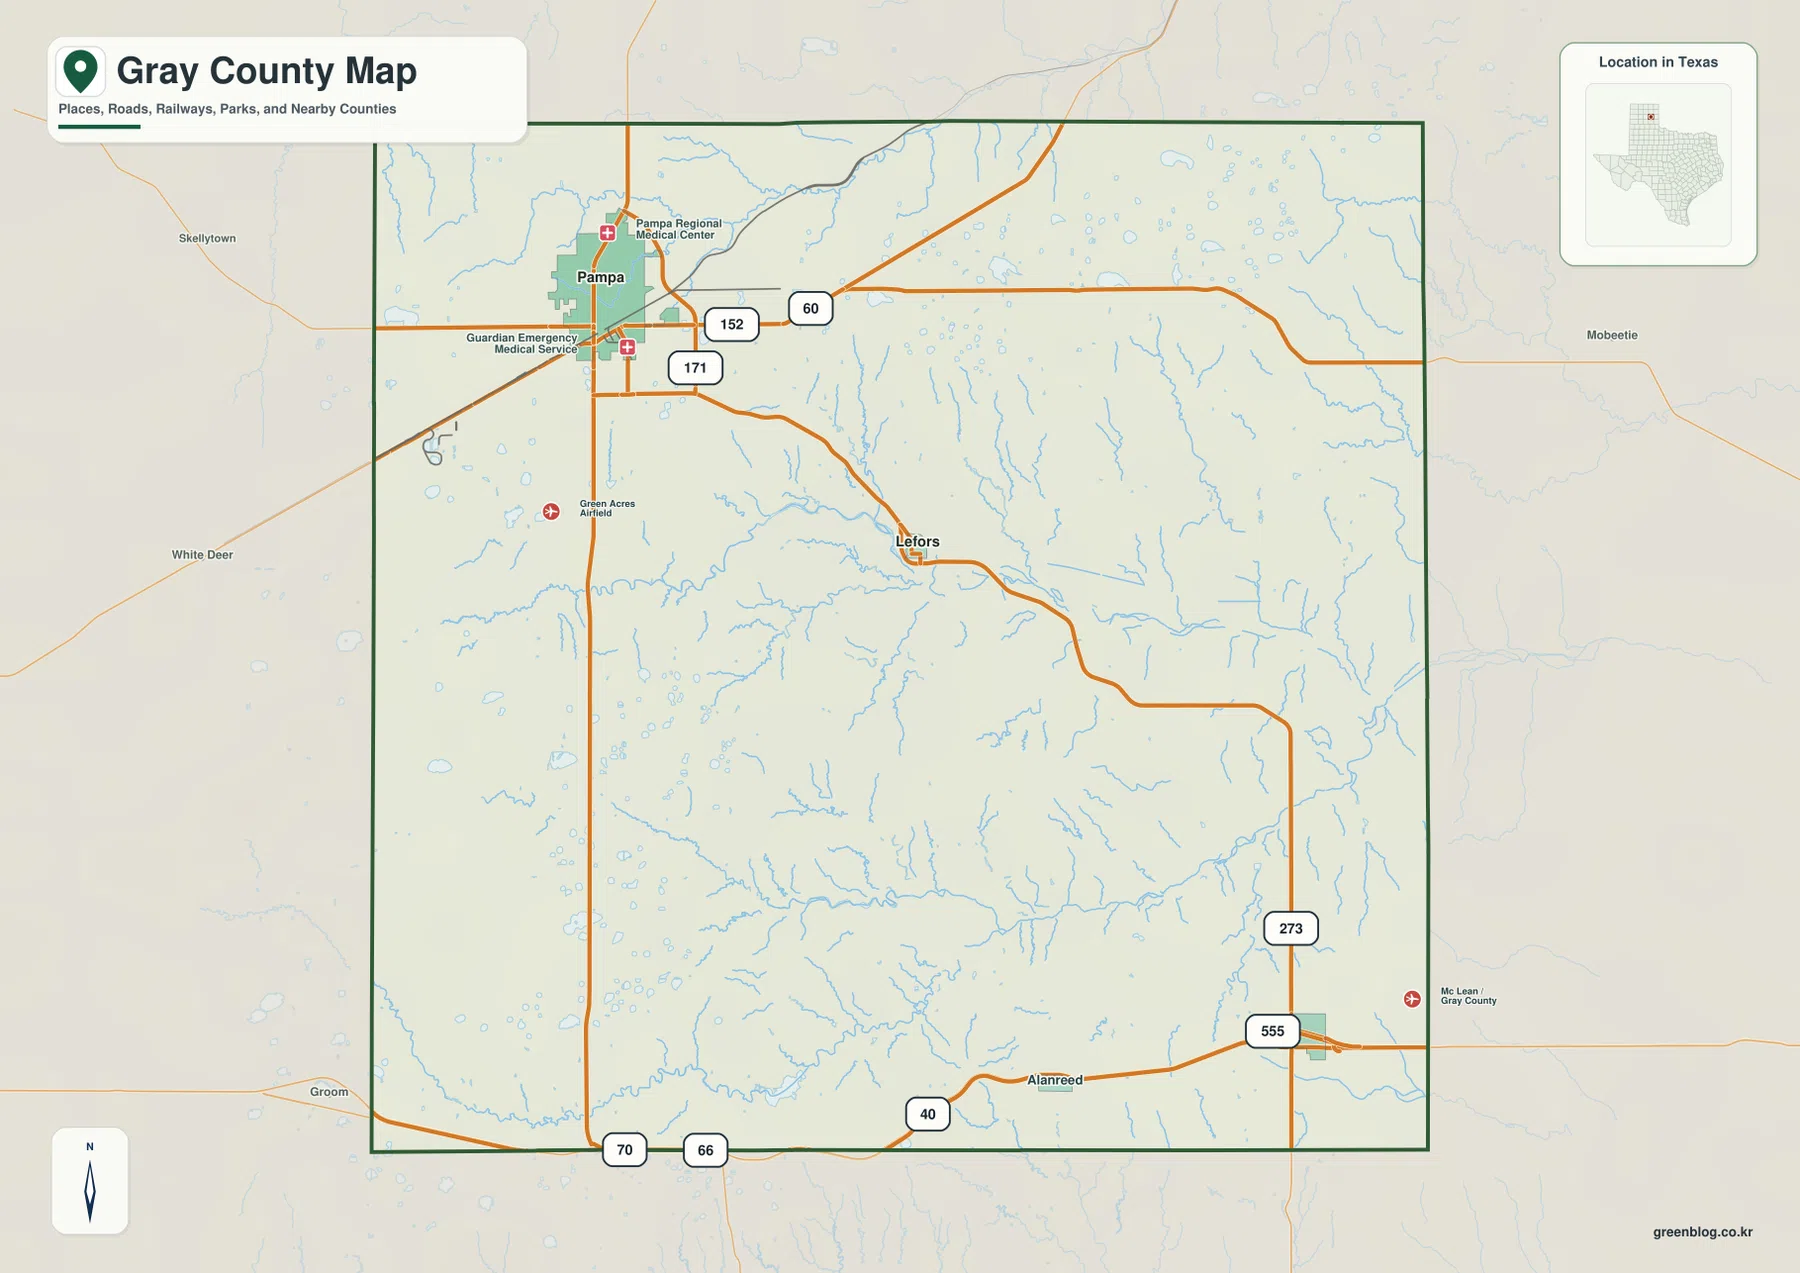
The southern road pattern is different. Interstate 40 crosses the lower part of Gray County, with Alanreed shown along the corridor and McLean close to the southeastern edge. That means Pampa and McLean are best understood as two different orientation points rather than as communities along one obvious local route. Pampa belongs to the northwestern network of U.S. 60 and state highways, while McLean is much more naturally associated with the east-west Interstate 40 corridor.
Lefors provides a useful middle reference. It is southeast of Pampa and much closer to the river-cut center of the county. On the general map, the road from the Pampa area toward Lefors enters a part of Gray County where streams and ravines become increasingly noticeable. Comparing the same location on the water and elevation maps helps explain why the central county has a different visual character from the broad surface around Pampa.
Labels outside the county include Roberts County, Carson County, Wheeler County, Donley County, Armstrong County, Collingsworth County, and Hemphill County. They are useful as regional reference names when locating Gray County within the Panhandle, even when the reader does not need a detailed boundary comparison. For a first look at the county, this map is therefore the most practical single image because it combines communities, major roads, the county outline, and enough hydrography to keep the towns tied to their physical setting.
Pampa, Lefors, and McLean without the extra map clutter
The city-connections map strips away most secondary detail and concentrates on three places. Pampa is the hub, Lefors is plotted southeast of it, and McLean is farther toward the southeastern boundary. The labels show about 12 miles from Pampa to Lefors and about 30 miles from Pampa to McLean. These figures are straight-line distances, not driving distances, so they are best used for a quick sense of scale rather than route planning.
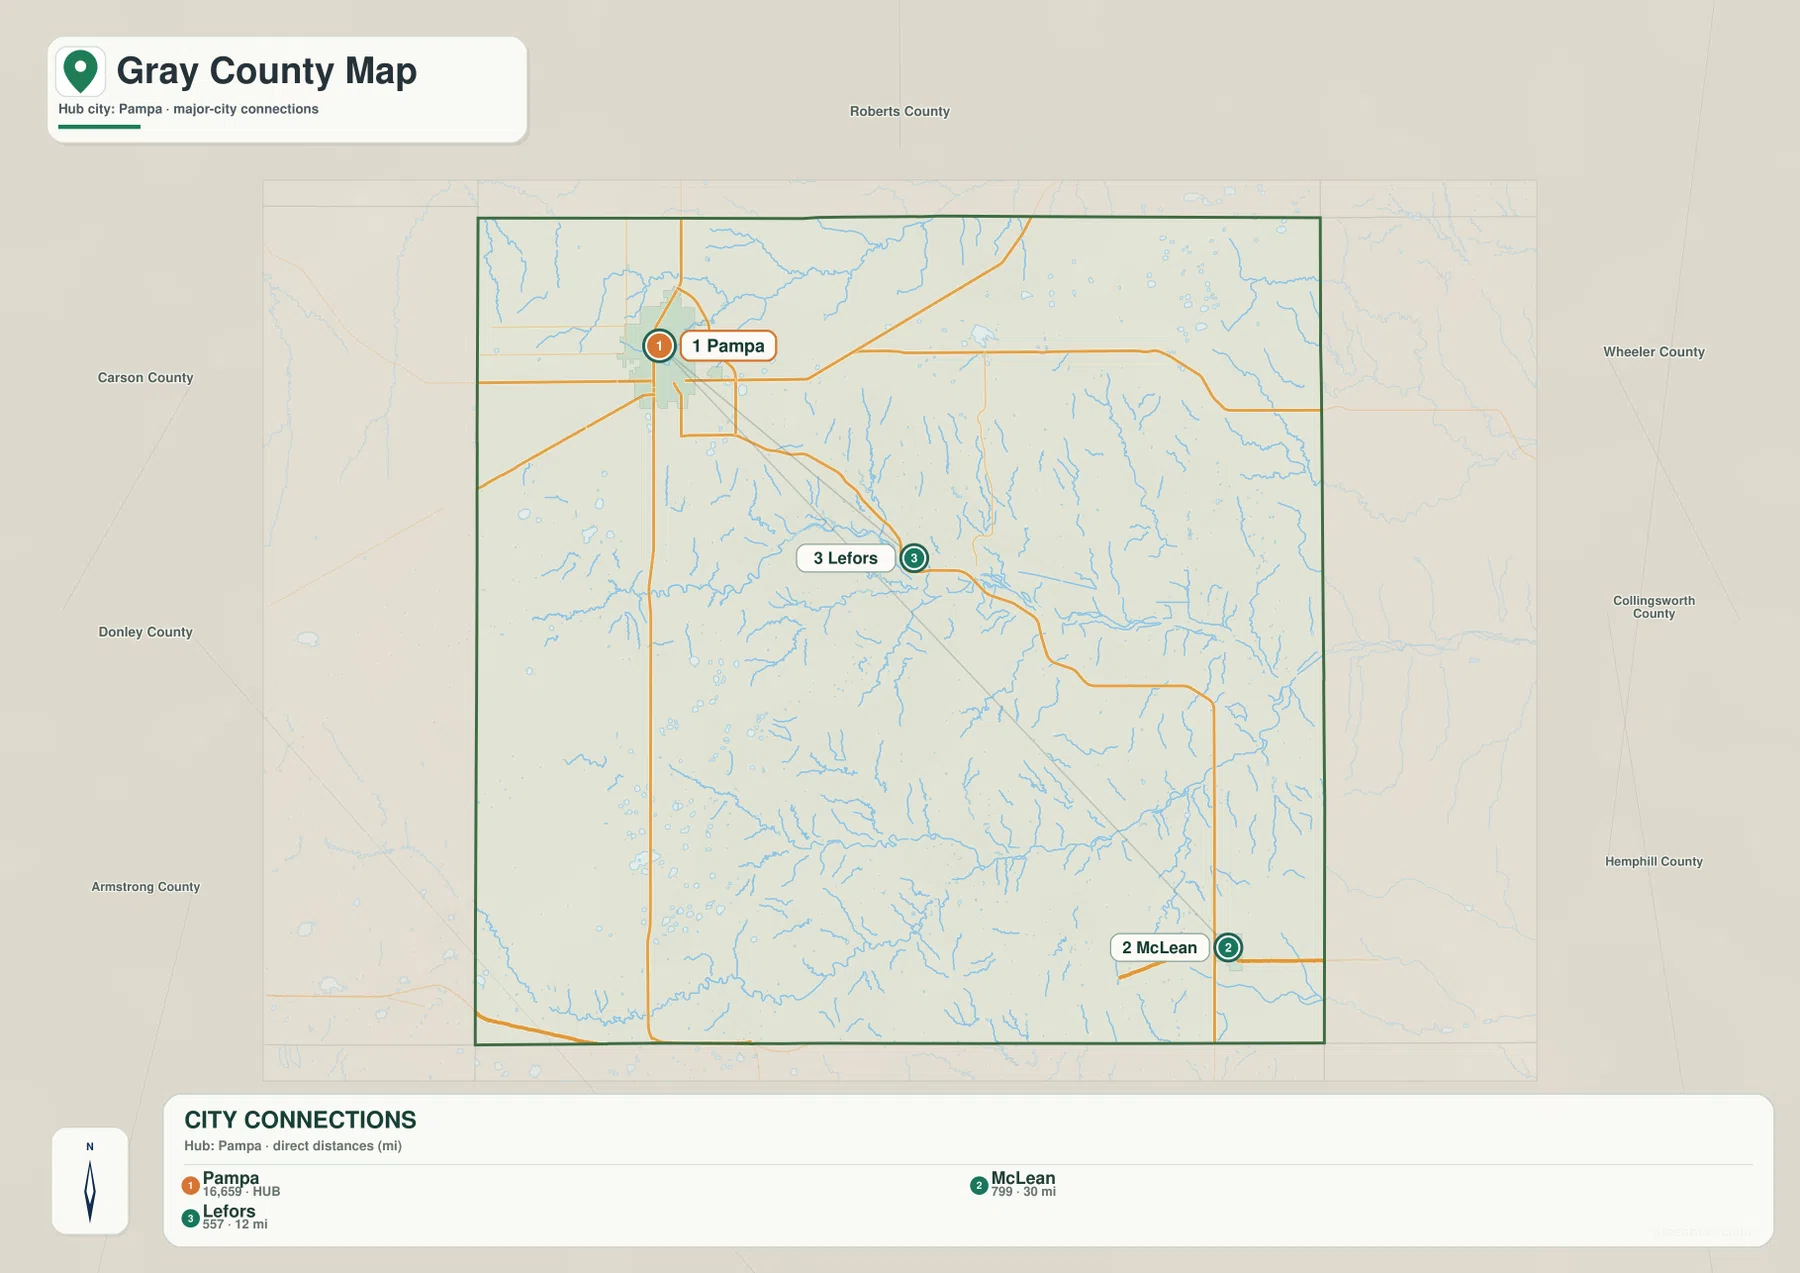
This simplified view corrects a common mental shortcut: Pampa is not close to the county’s center. It sits noticeably northwest of Lefors, and McLean is farther away again. When the three communities are shown alone, their spacing makes the county feel larger and more directional. Someone approaching from the south on Interstate 40 is dealing with a very different part of Gray County from someone starting in Pampa.
The map is also helpful when the surrounding terrain would otherwise distract from the settlement pattern. Lefors appears near the transition into the heavily drained central landscape, while Pampa remains on the broader northwestern surface. McLean is positioned near the southeastern edge and close to the southern highway corridor. Those geographic differences become more meaningful after looking at the water and elevation views, but the city map is the quickest way to establish the basic directions first.
For a classroom handout, a simple regional overview, or a slide where the goal is to compare town positions, the city-connections map can be easier to read than the general map. It should not replace a current road-routing service, because the connector lines do not represent the exact roads a driver would follow. Use it to answer “where are the towns relative to Pampa?” and return to the general county map when highway numbers, nearby places, or boundaries matter.
North Fork Red River and the drainage country across the center
The terrain and water map changes the emphasis from transportation to physical geography. The North Fork Red River becomes the dominant central feature, with numerous short tributaries descending toward it from both sides. The density of those lines is important. Areas that looked relatively empty on the road map are actually cut by many small valleys, especially through the central and eastern portions of Gray County.
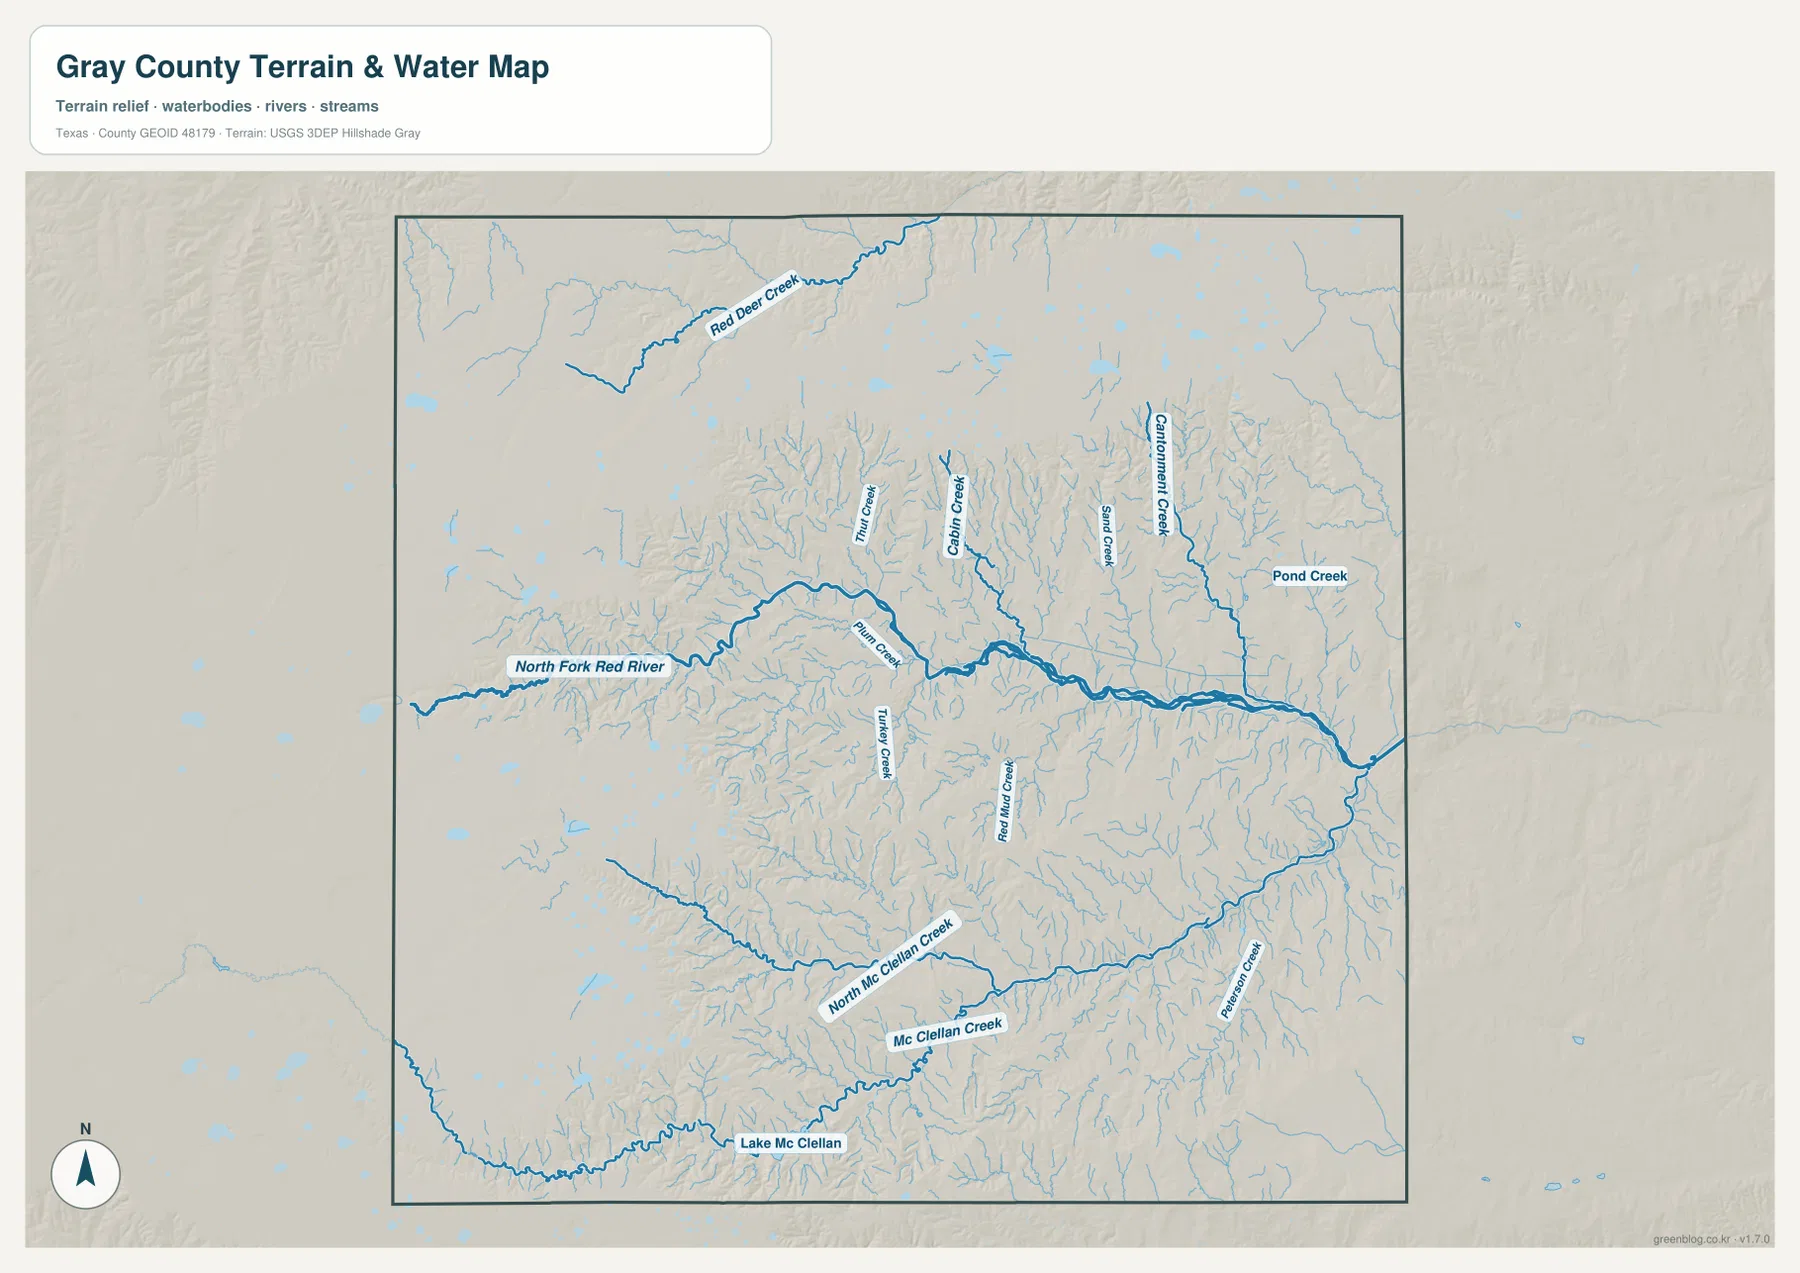
Red Deer Creek is labeled in the northern part of the map. Farther east, Cantonment Creek and Pond Creek help identify additional branches in the drainage network. The most useful observation is not simply the list of creek names but how quickly smaller channels multiply around the main river. That branching arrangement explains the deeply textured surface seen in the eastern half of the county and prepares the reader for the green, lower corridors that appear in the elevation view.
Southern Gray County has its own recognizable water features. North McClellan Creek and McClellan Creek extend across the lower part of the map, and Lake McClellan is labeled near the southern edge. These features show that the area below the North Fork Red River is not just the space between Pampa and Interstate 40. It contains another set of valleys that can be followed across the county and compared with the lower elevation zones on the relief map.
This image is a county-scale water and terrain reference, not a flood-hazard map, parcel map, or navigation chart. A stream line does not establish a regulated floodplain or a legal water boundary, and small channels may require more detailed local data for site-specific work. The map is most useful for seeing where the main waterways run, where tributaries are concentrated, and how the drainage system helps shape the county’s rougher central and eastern terrain.
From the higher western surface to lower stream valleys
The elevation map gives the clearest explanation for the contrast between the northwest and the river-break landscape. Browns and oranges cover much of the west and northwest, marking higher ground. Yellows and greens become more common through the center and toward the east, especially along the North Fork Red River and its tributaries. The county does not simply tilt downward in one smooth direction; lower valleys repeatedly cut back into broad areas of higher ground.
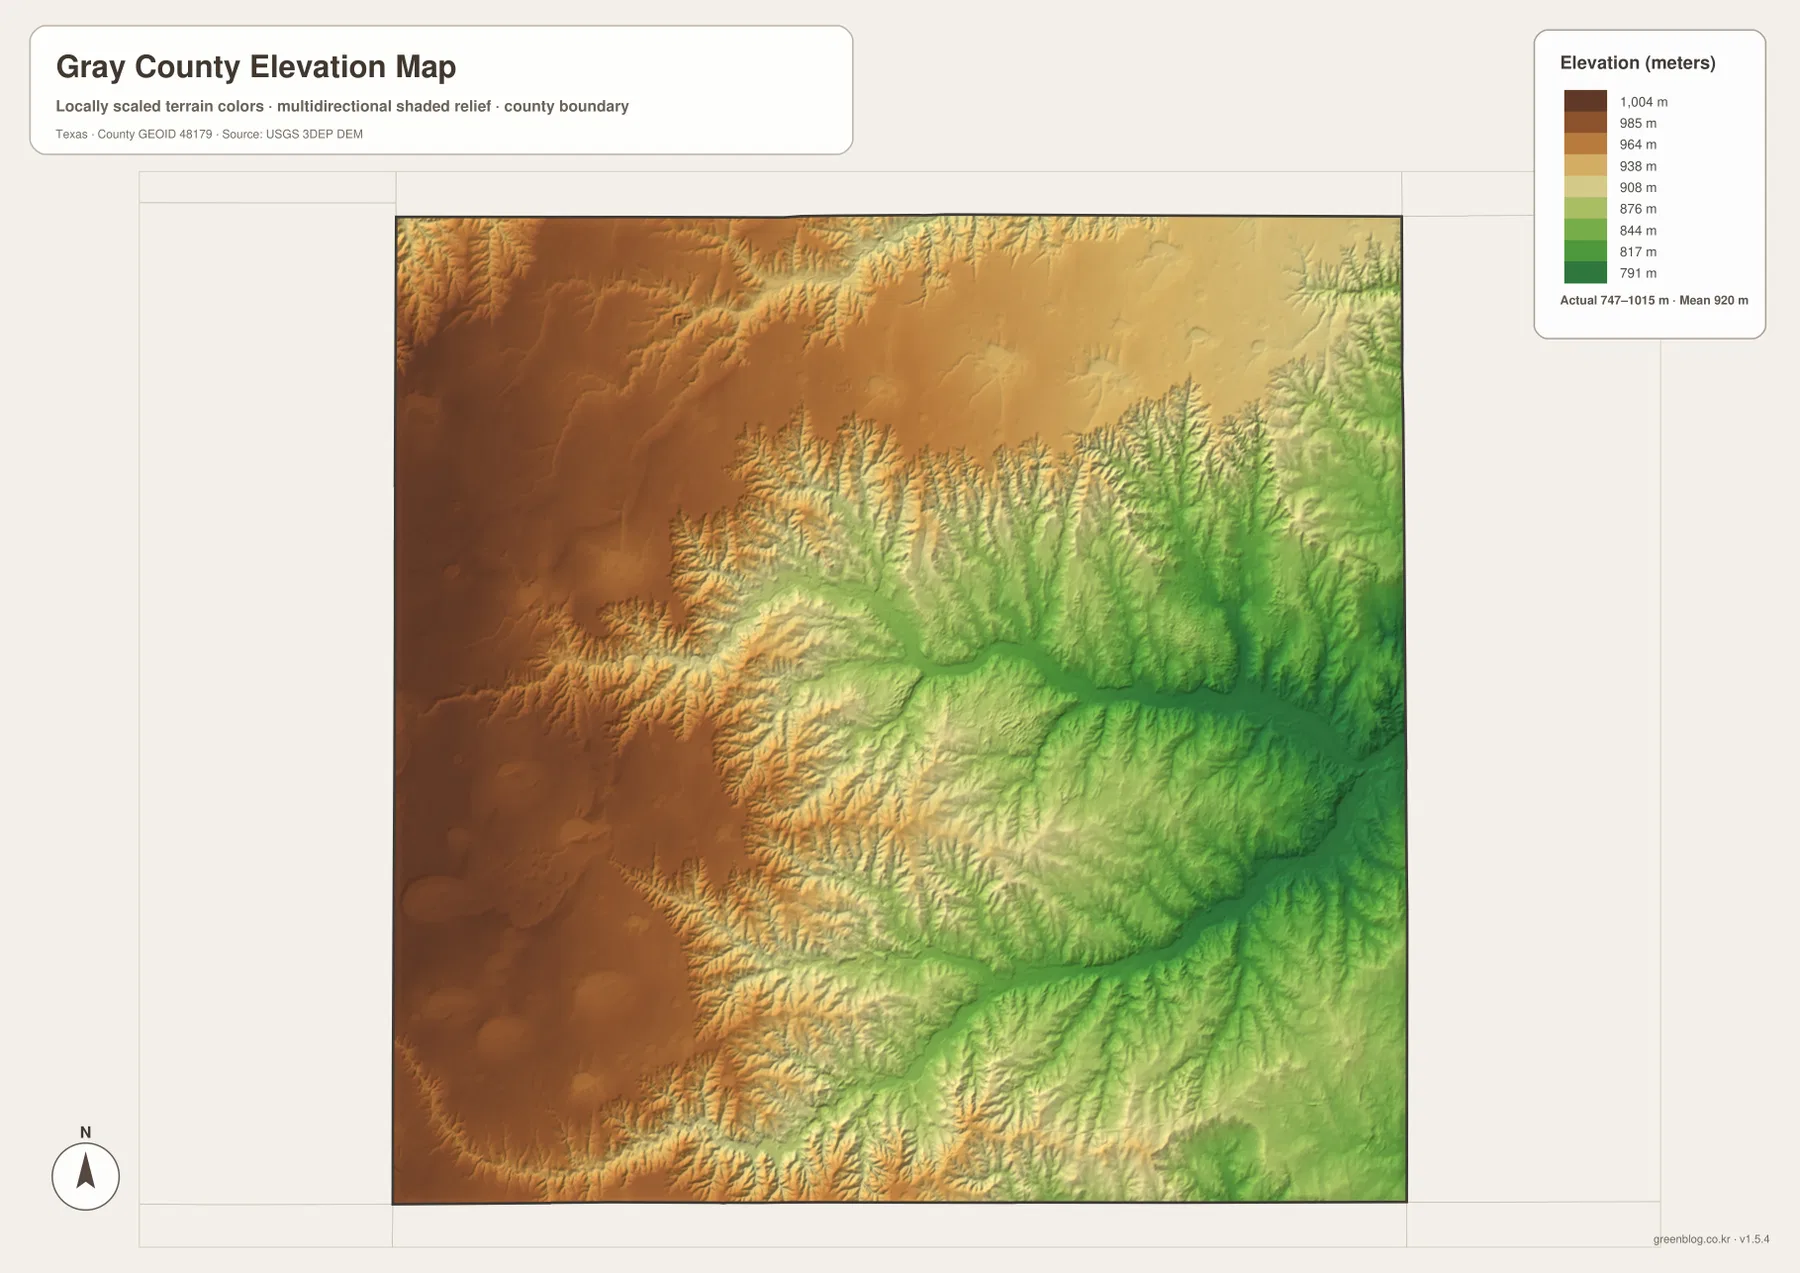
The legend reports an actual elevation range of roughly 747 to 1,015 meters, with a mean around 920 meters. Those numbers provide useful scale, but the arrangement of the colors tells more of the geographic story. Higher terrain forms a wide block on the western side. Lower terrain enters it in long, narrow fingers where streams have cut valleys, producing the intricate relief that is especially obvious across the central and eastern sections.
Comparing the elevation and water maps makes the relationship easy to see. The North Fork Red River corresponds to one of the longest continuous low corridors. Many of its tributaries line up with smaller green branches, and the McClellan Creek system in the south also follows lower terrain. Pampa, by contrast, sits on a broader high surface in the northwest. This does not mean every street in Pampa is level; it places the city within the county’s larger topographic setting.
The rendered elevation surface is appropriate for county-scale comparison, not for surveying or engineering calculations. Exact site elevation, road grade, drainage design, and construction decisions require the original elevation dataset and professional methods. For a general reader, however, the map does its job well: it shows where the land remains broadly high, where valleys descend, and why the eastern half of Gray County appears much more dissected than the Pampa area.
Choosing and downloading the right Gray County map
Start with the general county map when the main task is orientation. It is the best place to find Pampa, Lefors, McLean, Alanreed, the major highway corridors, and the county outline in one view. Choose the city-connections map when the extra labels are unnecessary and the only question is how the principal communities are arranged relative to Pampa. Remember that its 12-mile and 30-mile labels are straight-line measurements rather than road mileage.
For physical geography, the water and elevation maps work best as a pair. The water map names the North Fork Red River, Red Deer Creek, the McClellan Creek system, and other drainage features. The elevation map then shows that many of those same corridors occupy lower ground. A report or lesson about the river breaks can use both images, while a simple location page about Pampa may need only the general map.
The download archive contains four high-resolution JPG files corresponding to the four maps shown here. Each JPG is 3638×2572 pixels, giving the user more room to zoom or print than the web-sized WebP versions displayed in the article. The files can be used separately or combined in a document when both settlement geography and physical terrain need to be explained.
Keep the purpose of each map in mind when reusing the files. The county and city views are orientation tools, the water map is a hydrographic reference, and the elevation image shows generalized relief. None of them replaces a legal survey, an official flood determination, or site-specific engineering data. For work that depends on precise boundaries or measurements, consult the current official datasets and local authorities after using these maps for the broader county context.
Frequently Asked Questions
Where are Pampa and McLean within Gray County?
Pampa is in the northwestern part of Gray County, while McLean is near the southeastern edge. Pampa is associated with U.S. Highway 60 and several state routes, whereas McLean lies close to the Interstate 40 corridor in the south. Thinking of them as two separate orientation points makes the county’s road pattern easier to understand.
Are the city-map distances driving distances?
No. The city-connections map shows approximately 12 miles from Pampa to Lefors and approximately 30 miles from Pampa to McLean as straight-line distances. Actual driving mileage and travel time depend on the road route, so a current routing service should be used for trip planning.
What does the elevation map show about Gray County?
It shows a broad area of higher ground across the west and northwest and lower stream-cut valleys through the center and east. The North Fork Red River forms the most continuous low corridor, with smaller tributary valleys branching away from it. The map legend gives an actual county range of about 747 to 1,015 meters and a mean elevation of about 920 meters.
Map File Information
Download the high-resolution JPG versions of the general county map, city-connections map, terrain and water map, and elevation map of Gray County in one ZIP archive.
- Printable Size: 3638×2572 pixels
- File Type: JPG
Related Maps
Sources and references
For additional county background and the source families used for boundaries, hydrography, and elevation, the following references provide authoritative information and data documentation.
- Texas State Historical Association – Gray County
- U.S. Census Bureau – TIGER/Line Shapefiles
- U.S. Geological Survey – National Hydrography
- U.S. Geological Survey – 3D Elevation Program
Green Map creates custom-edited map images using open geographic data sources such as geoBoundaries, Natural Earth, OpenStreetMap, and government open data.
These maps are edited visual materials, not raw data files, and are provided for education, documents, presentations, and graphic reference.