Yuma County sits on Colorado’s eastern High Plains, and its 2025 land-cover pattern is overwhelmingly open and agricultural. Grassland accounts for 61.16% of the county and agriculture for 34.86%, so those two classes cover more than 96% of the mapped area. The main map shows broad grassland broken by rectangular crop blocks, while the developed class is concentrated in small clusters around the cities of Yuma and Wray. Thin wetland and water corridors cut across parts of this otherwise dry-looking plains landscape.
This page provides four views of the same county: current land cover, forest and farmland, impervious surface and developed land, and a 1985–2025 class-change comparison. The four original JPG maps are available together in one ZIP download. Keeping the set together is useful when you want to separate questions about crop patterns, town footprints, stream corridors, or long-term classification differences instead of asking one image to show everything.
Table of Contents
A High Plains county where grassland still outweighs cropland
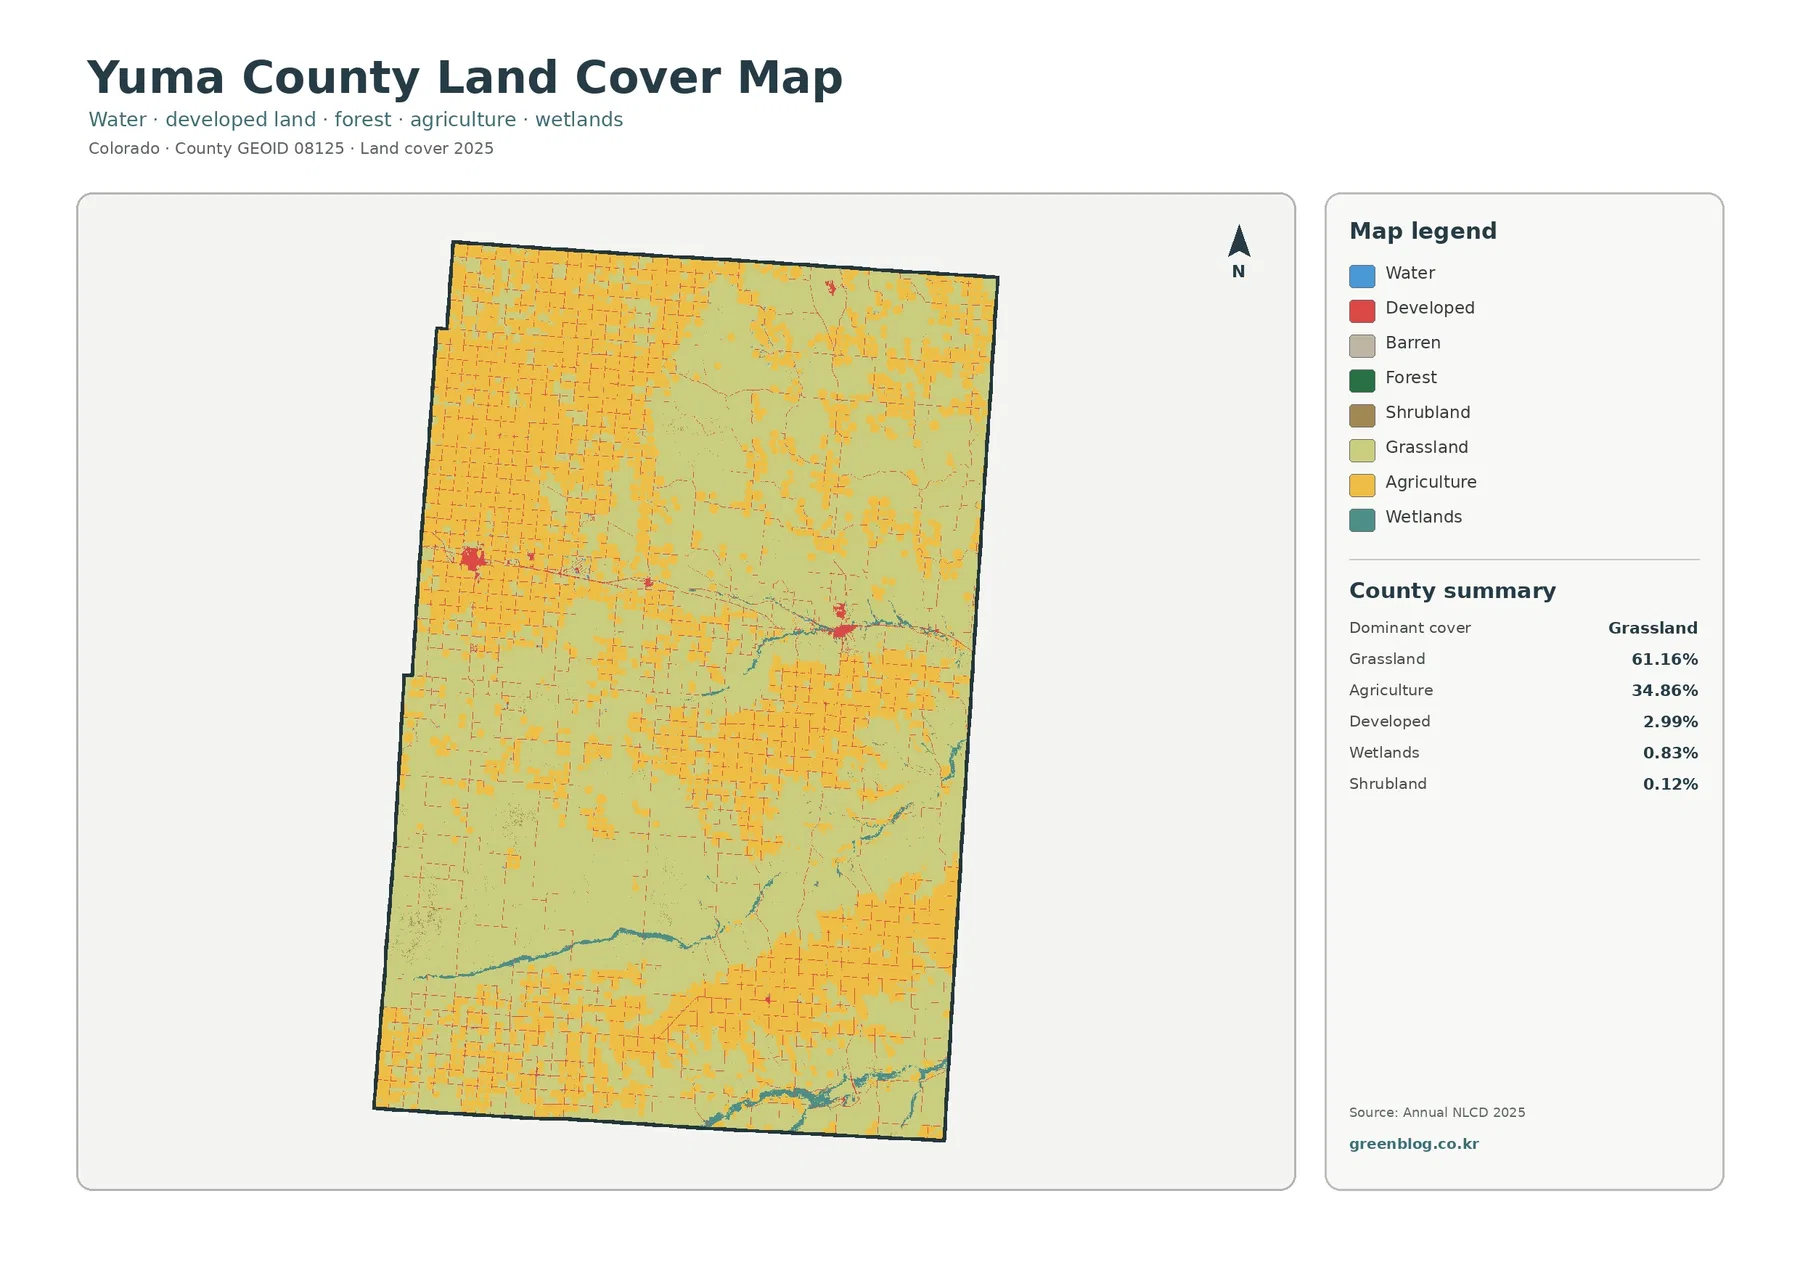
The countywide percentages tell an important story before any local details are added. Grassland is the dominant 2025 class at 61.16%, followed by agriculture at 34.86%. Developed cover is 2.99%, wetlands are 0.83%, and shrubland is 0.12%. Water and forest are much smaller in the simplified forest-and-farmland summary. This is not a county where one large urban area or one forest block determines the visual character. Instead, the map is built from a large pale grassland background and a patchwork of cultivated fields.
Crop blocks are not distributed with the same density everywhere. The western side and much of the south contain extensive rectangular agricultural patches, and the northwest also has many closely spaced fields. Across the center and toward the northeast, larger areas of grassland remain between the yellow agricultural shapes. That variation is worth noticing because a county average of 34.86% agriculture can hide the difference between a field-dense township and a broad stretch of open grass.
Published USGS work describes Yuma County as part of the High Plains section of the Great Plains. It is generally a nearly level plain, although river valleys and local sand-hill areas break that surface. That physical setting fits the broad visual organization in the land-cover image: there are no mountain-scale forest belts, and the strongest shapes are field grids, open grassland, towns, and narrow drainage corridors. The land-cover map does not measure elevation, but its patchwork is consistent with a plains county rather than a mountain county.
Developed cover occupies only 2.99% of Yuma County. Even so, two red concentrations stand out because they are surrounded by so much open land. The larger western-central cluster corresponds to the City of Yuma, while the eastern-central cluster corresponds to Wray. Yuma County’s official Land Use contact page lists both municipalities, along with smaller communities such as Eckley. On the countywide map, however, development outside the two main city clusters is sparse and often appears as small dots or narrow lines.
Field blocks are broad, but the narrow water corridors explain another side of the county
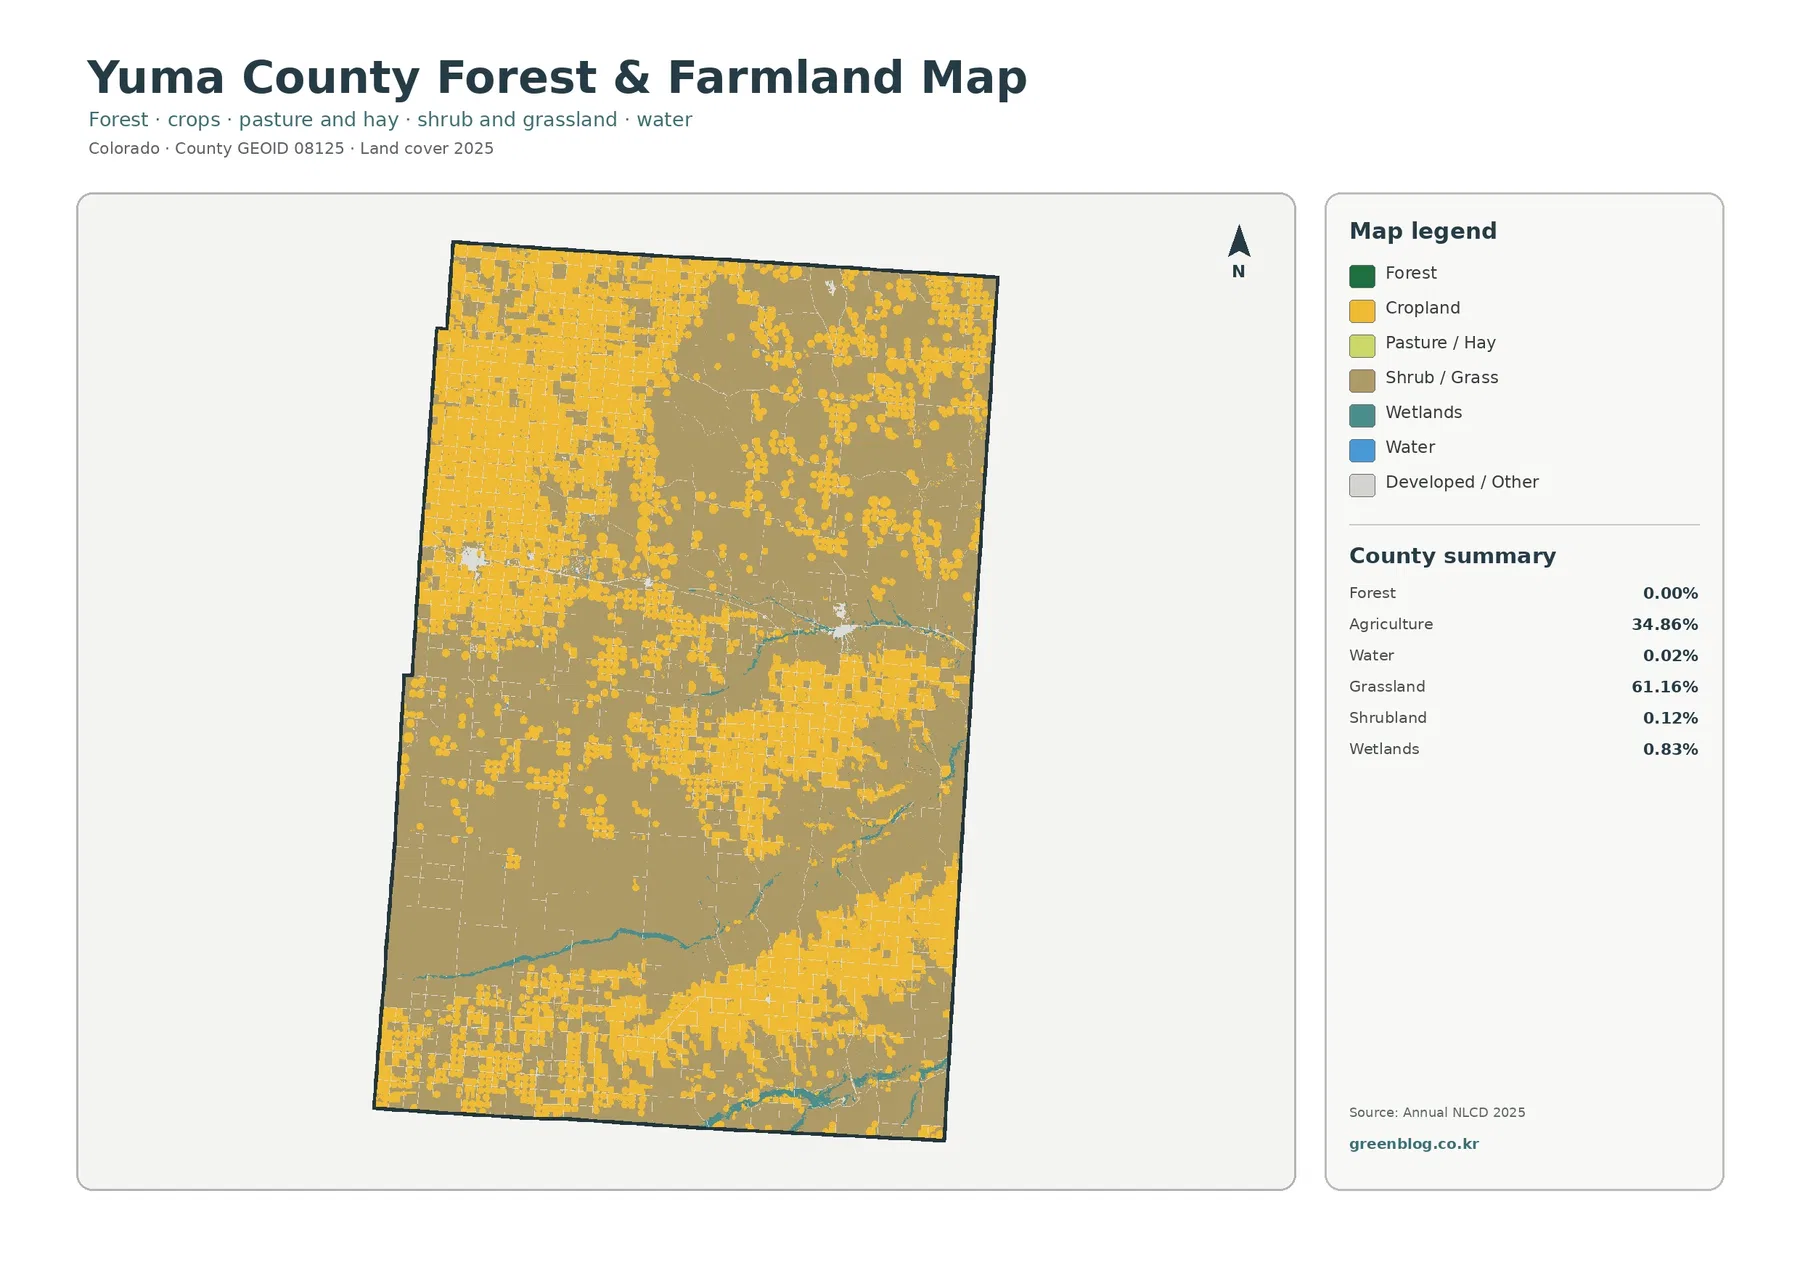
The forest-and-farmland view simplifies the palette and makes the agricultural pattern easier to follow. Yellow crop blocks are especially conspicuous along the west, across much of the south, and in parts of the northwest. In other areas, fields are separated by larger expanses of grassland. Because both classes dominate the county, this map is more useful for comparing their arrangement than for searching for forest. The county summary reports forest at 0.00% after rounding, while grassland remains 61.16% and agriculture 34.86%.
A 0.00% forest summary should not be read as a claim that no trees exist in Yuma County. Annual NLCD uses a roughly 30-meter raster grid, so narrow shelterbelts, farmstead trees, riparian vegetation, or small mixed patches may be absorbed into another dominant class. The number means the countywide area assigned to the forest class rounds to 0.00% in this summary. For this particular map, crop blocks, grassland, wetlands, and water are much more useful county-scale features.
Wetlands account for 0.83% and water for only 0.02%, but those small percentages form long linear features on the map. The most recognizable example is near Wray, where a wetland-and-water corridor passes the city and continues toward the eastern county line. USGS maintains a stream-monitoring location on the North Fork Republican River near Wray, confirming the named river context for that part of the county. Farther south, additional drainage and wetland lines cross the agricultural and grassland matrix.
USGS geographic descriptions identify the North Fork Republican River, Arikaree River, and South Fork Republican River as important drainage systems in Yuma County. The supplied land-cover image does not label each stream, so it is better to use those names as verified regional context rather than assign every blue or teal line to a specific river by appearance alone. If exact channel names, floodplain boundaries, or water rights matter, a hydrography or local GIS layer should be consulted alongside these land-cover maps.
Impervious cover is tiny countywide and strongly concentrated in two towns
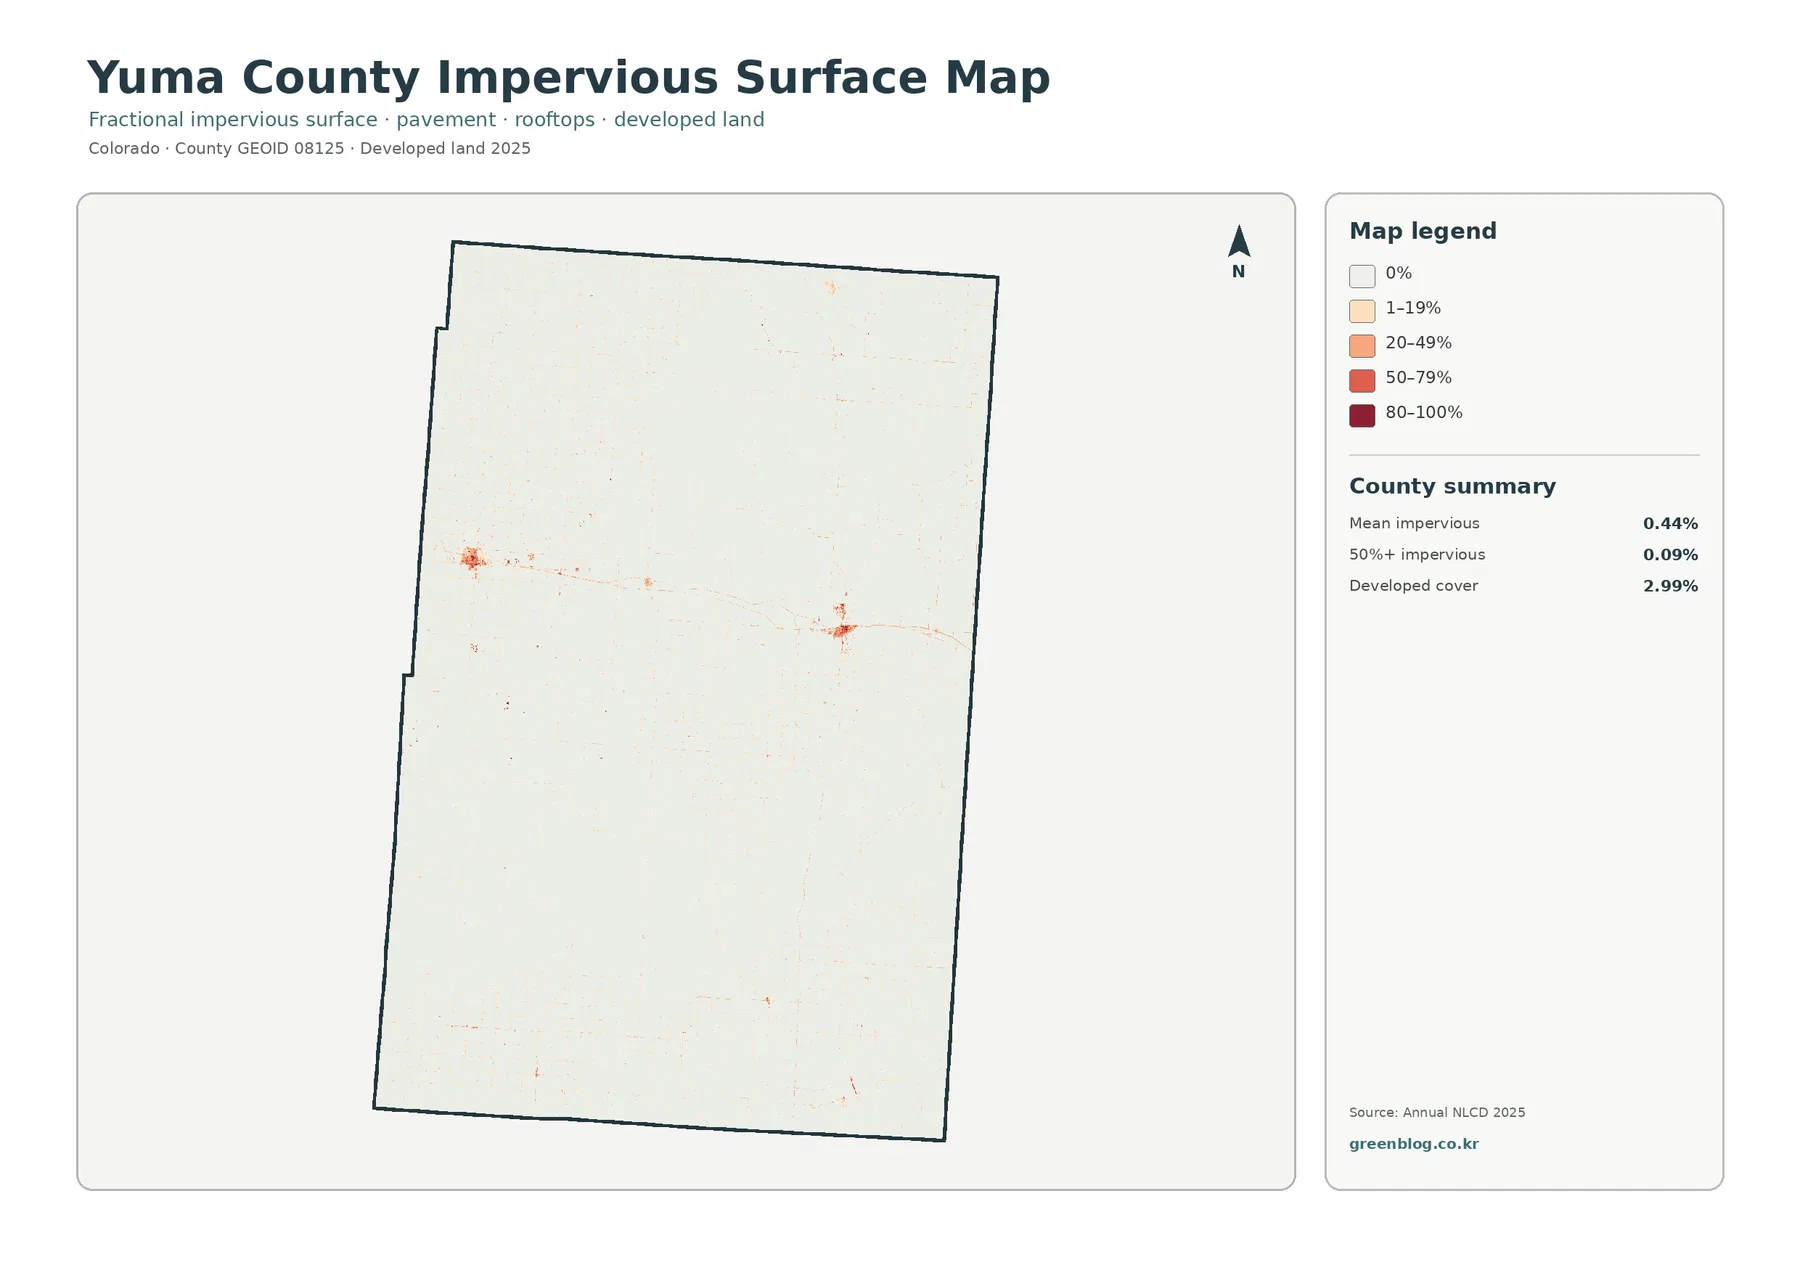
Mean impervious surface in Yuma County is just 0.44%. Only 0.09% of the county is mapped at 50% or greater imperviousness. Those figures make sense when the image is viewed at county scale: almost the entire interior is near white, while the two most obvious orange-red clusters sit around Yuma and Wray. Compared with a metropolitan county, the developed footprint is compact and widely separated by agricultural and grassland terrain.
Impervious surface and developed land are related, but they are not the same measurement. The current land-cover summary gives developed cover as 2.99%, much higher than the 0.44% mean impervious value. A developed raster cell can contain lawns, soil, trees, and other surfaces that still absorb water. The impervious product focuses on the fraction of a cell covered by harder surfaces such as rooftops and pavement. That distinction is especially useful in small towns where built features are mixed with yards and open ground.
Outside the two town centers, faint lines and isolated specks of impervious cover appear across the plains. Some may resemble roads or rural facilities, but the image is not a transportation map and should not be used to identify specific road names. Yuma County’s official GIS department maintains separate geographic resources, including address centerlines and municipal boundaries. Those local layers are the better source when a project requires road geometry, parcel context, or an exact city boundary.
The strongest comparison is made by switching between this image and the current land-cover map. The impervious view isolates the hard-surface cores of Yuma and Wray; the general land-cover view then shows how those cores sit inside broader developed pixels and immediately meet cropland or grassland. This makes it clear that the county’s towns are important local centers without occupying a large share of the county’s total area.
The 1985–2025 comparison is dominated by agricultural class differences
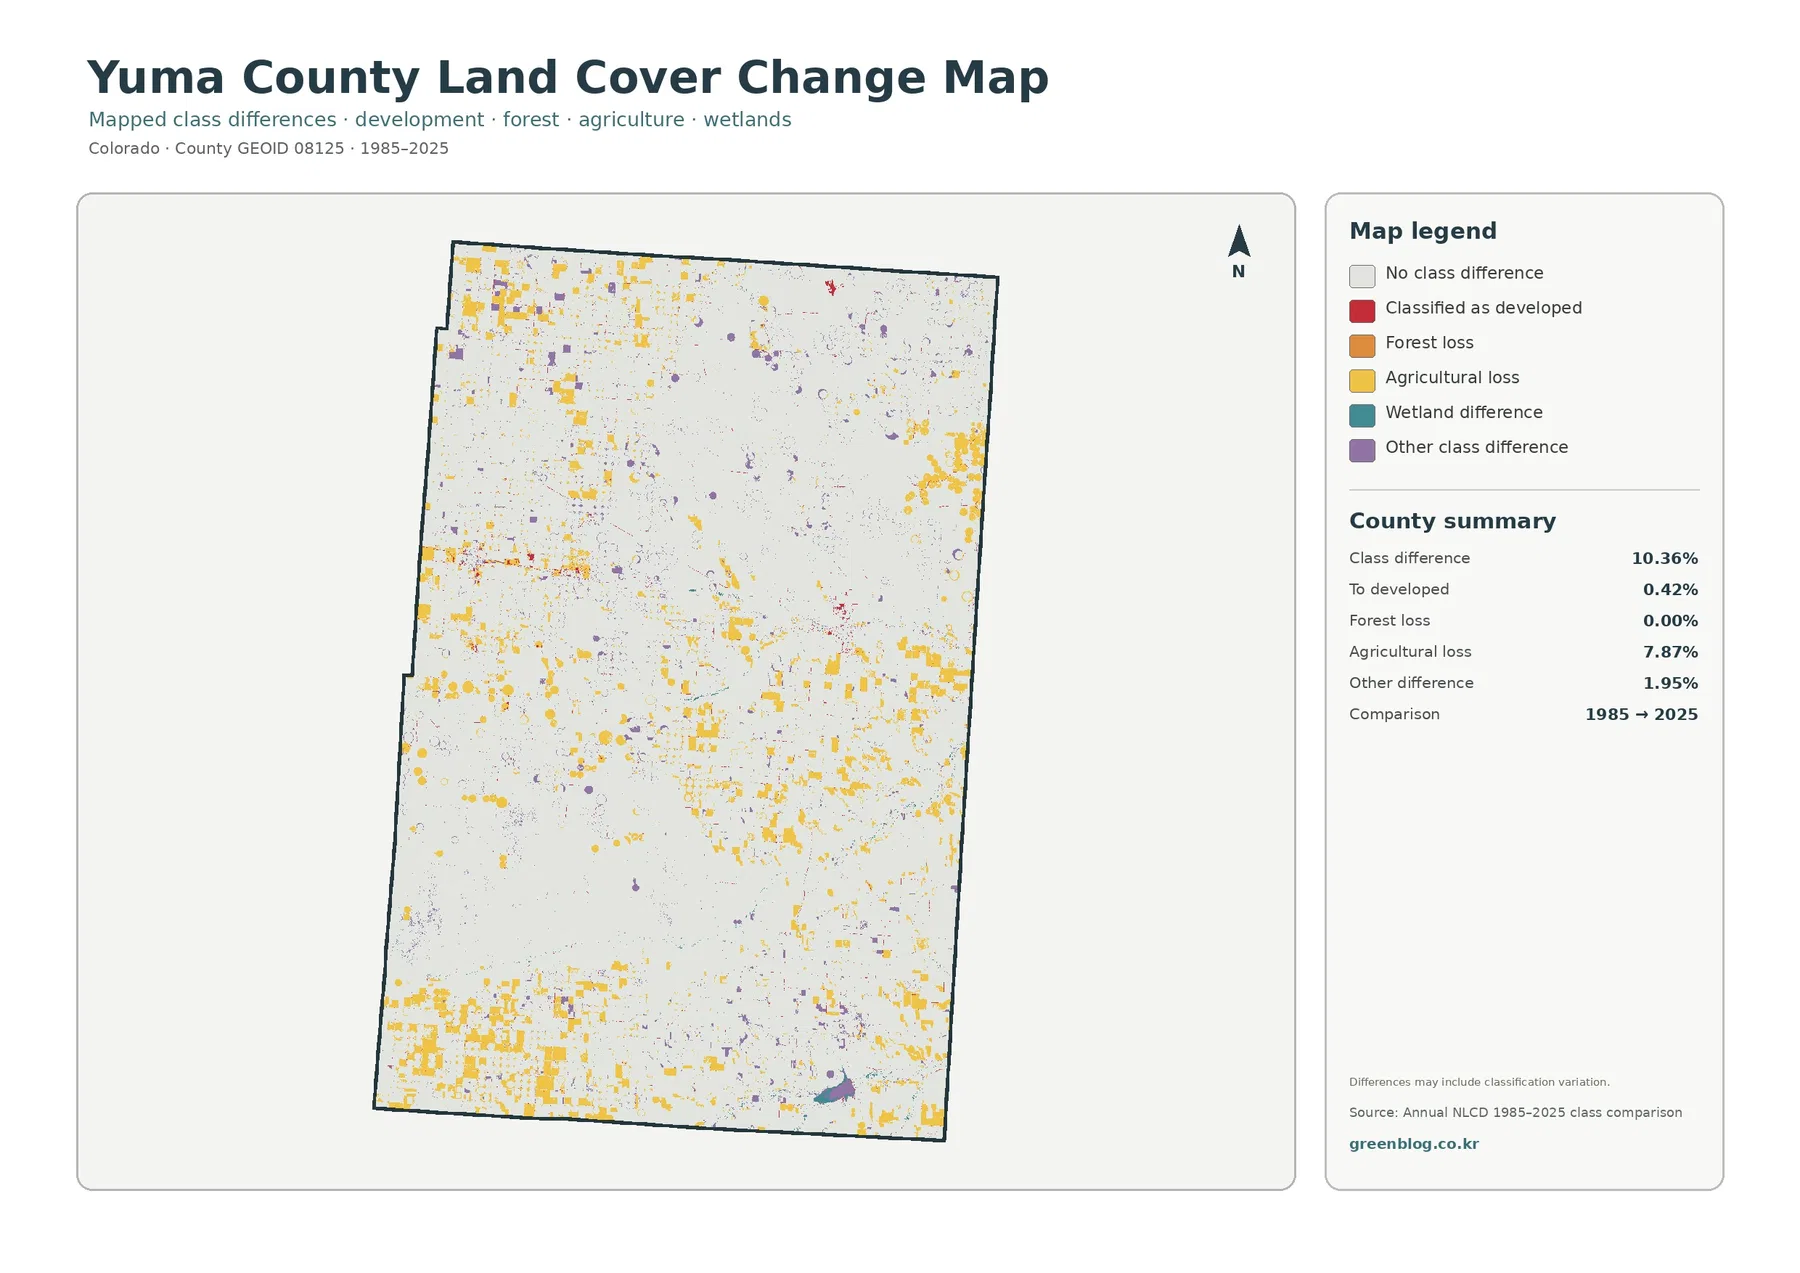
The change map compares classifications at two dates rather than showing the current surface alone. Across Yuma County, 10.36% of the area is mapped with a class difference between 1985 and 2025. Agricultural loss is the largest named category at 7.87%. Other class difference accounts for 1.95%, change to developed cover is 0.42%, and forest loss is 0.00%. These percentages describe the two-date comparison and should not be combined with the current 34.86% agriculture value as though they were parts of the same total.
The yellow agricultural-loss cells occur in many separated patches rather than one continuous zone. They are visible in the northwest, along sections of the west, near the eastern edge, and across parts of the south and southwest. That scattered pattern matters. It indicates a dispersed set of class differences across the agricultural landscape, not a single county sector that can simply be labeled as former farmland.
Red change-to-developed cells are much less extensive, which matches the low countywide value of 0.42%. Small red concentrations occur around the same general town areas that stand out on the 2025 impervious map. Comparing the two products helps separate two ideas: the change image asks where the assigned land-cover class differs between 1985 and 2025, while the impervious map asks where hard surfaces are concentrated in 2025.
The 7.87% agricultural-loss category should not be described as proof that 7.87% of Yuma County’s farmland was permanently removed. The map itself notes that differences may include classification variation. Crop condition, image timing, temporary cover, mixed pixels, and changes in the classification process can affect a two-date comparison. A reliable explanation of the cause and timing of change would require intermediate Annual NLCD years, aerial imagery, agricultural records, or local planning documents.
Choose the map by question, not by which image looks most detailed
A county overview works best with the current land-cover map because it places grassland, agriculture, developed cover, wetlands, water, and shrubland in one frame. The forest-and-farmland version becomes more useful when field shape and open-land balance are the main topic. By reducing some of the visual competition from other classes, it makes the rectangular crop pattern and narrow wetland corridors easier to compare across the county.
For a discussion of settlement, the impervious map is the better starting point. Yuma and Wray appear immediately because the rest of the county is so lightly covered by hard surfaces. Once those town centers are located, the general map can show how quickly their developed areas transition into cropland or grassland. The change map can then be added if the goal includes historical class differences rather than current settlement alone.
The water and wetland features are a good example of why percentages and maps should be read together. Water is only 0.02% and wetlands are 0.83%, but a long stream corridor can be more important for orienting a reader than its small area would suggest. Near Wray, the North Fork Republican River provides a verified geographic anchor. In the southern half of the county, the additional stream-and-wetland lines help break up the otherwise broad grassland and crop mosaic.
For classroom or presentation use, the four images can also be placed in a logical sequence. Start with current cover to establish the countywide pattern. Use the farm-focused image to discuss the grassland-cropland balance, then move to impervious surface to show how compact the two main town footprints are. End with the 1985–2025 comparison and explain that a mapped class difference is not automatically the same as a permanent land-use conversion.
Land cover is not zoning, ownership, or a parcel survey
Land cover describes what the surface is classified as from remotely sensed data: grassland, agriculture, developed land, water, wetlands, and related categories. It does not state who owns the land, what zoning applies, what a parcel is worth, or whether development is legally allowed. A cell shown as agriculture is a mapped surface class, not a legal agricultural designation. A developed cell does not establish a building permit or municipal boundary.
Scale also matters. Annual NLCD is a raster dataset at roughly 30-meter resolution. A single cell can contain a farm lane, field edge, shelterbelt, small structure, and bare soil at the same time, but the final product represents that area with a generalized classification. This is one reason tiny ponds, narrow tree belts, and small built features can be underrepresented in a countywide summary.
The maps also represent specific dates. The current land-cover and impervious products describe 2025, and the change image compares 1985 with 2025. They do not show every crop rotation, short-term fallow period, construction event, or vegetation change that occurred between those dates. If a decision depends on an individual parcel or a precise year, local GIS records, aerial photography, and intermediate data should be used instead.
Download the four JPG maps and keep the measurements in context
The key 2025 values are 61.16% grassland, 34.86% agriculture, 2.99% developed cover, 0.83% wetlands, and 0.12% shrubland. The forest-and-farmland summary also lists 0.02% water and 0.00% forest. Mean impervious surface is 0.44%, with 0.09% of the county at 50% or greater imperviousness. The historical comparison reports 10.36% total class difference, 7.87% agricultural loss, 1.95% other difference, and 0.42% change to developed cover. Each group measures a different aspect of the county, so the percentages should remain attached to the map that produced them.
Downloading the complete set is useful when you want to switch between those questions without losing the countywide frame. The current map is the strongest general reference; the farm-focused map clarifies the crop-and-grassland mosaic; the impervious image isolates town-scale hard surfaces; and the change map adds a historical comparison. Together they provide a more complete view of Yuma County than any single image can provide on its own.
The supplied asset manifest lists each original JPG at 2480 × 1754 pixels. It does not certify the files as meeting an A3 high-resolution reference, so check legend text and fine boundaries at the intended print size before making a large-format print. For screen use and normal documents, the original JPG set is a convenient way to keep all four Yuma County views together.
Frequently Asked Questions
What is the largest land-cover class in Yuma County?
Grassland is the largest 2025 class at 61.16%, followed by agriculture at 34.86%. The countywide totals are only part of the story: crop blocks are denser in several western and southern areas, while larger continuous grassland zones appear through much of the center and northeast.
Why do Yuma and Wray stand out when mean impervious surface is only 0.44%?
Impervious cover is highly concentrated rather than evenly spread across the county. Most of Yuma County is very lightly impervious, while the two main city centers contain compact areas of rooftops, pavement, and other hard surfaces. Their contrast against the surrounding agricultural and grassland landscape makes them easy to see even though the countywide mean is low.
Does 7.87% agricultural loss mean that 7.87% of farmland was permanently lost?
No. It is a two-date class-comparison category between 1985 and 2025. The value does not identify the cause, exact timing, or permanence of each difference, and the map notes that classification variation may be included. Intermediate Annual NLCD years, aerial imagery, agricultural records, and local land-use information are needed for a specific trend or parcel conclusion.
Map File Information
Download the four original Yuma County JPG maps together in one ZIP archive for offline reference.
- Included Files: Use only the versions confirmed in the article and supplied images
- File Type: Use the confirmed download contents
- Intended Use: Printing, education, presentations, and map-based projects
Related Maps
- Adams County Colorado Land Cover Map
- Alamosa County Colorado Land Cover Map
- Arapahoe County Colorado Land Cover Map
Sources and References
- MRLC Annual NLCD Data – land-cover and impervious-surface data access
- USGS Annual NLCD Land Cover Classification – class definitions and interpretation guidance
- U.S. Census Bureau TIGER/Line Shapefiles – county boundary and geographic reference data
- Yuma County Geographic Information System – official local GIS and mapping resources
- USGS North Fork Republican River near Wray – official stream-monitoring location in Yuma County
Green Map creates custom-edited map images using open geographic data sources such as geoBoundaries, Natural Earth, OpenStreetMap, and government open data.
These maps are edited visual materials, not raw data files, and are provided for education, documents, presentations, and graphic reference.