Teller County sits on the western side of the Pikes Peak region in central Colorado, where wooded mountain slopes, shrub-covered uplands, open grassland, small reservoirs, and compact towns share a relatively small county. The 2025 land-cover summary is dominated by forest at 57.40%, followed by shrubland at 26.66% and grassland at 8.37%. Developed land accounts for 3.85%, while agriculture is only 0.03%. This page compares four map views of the county and provides the original JPG versions together in one downloadable ZIP file.
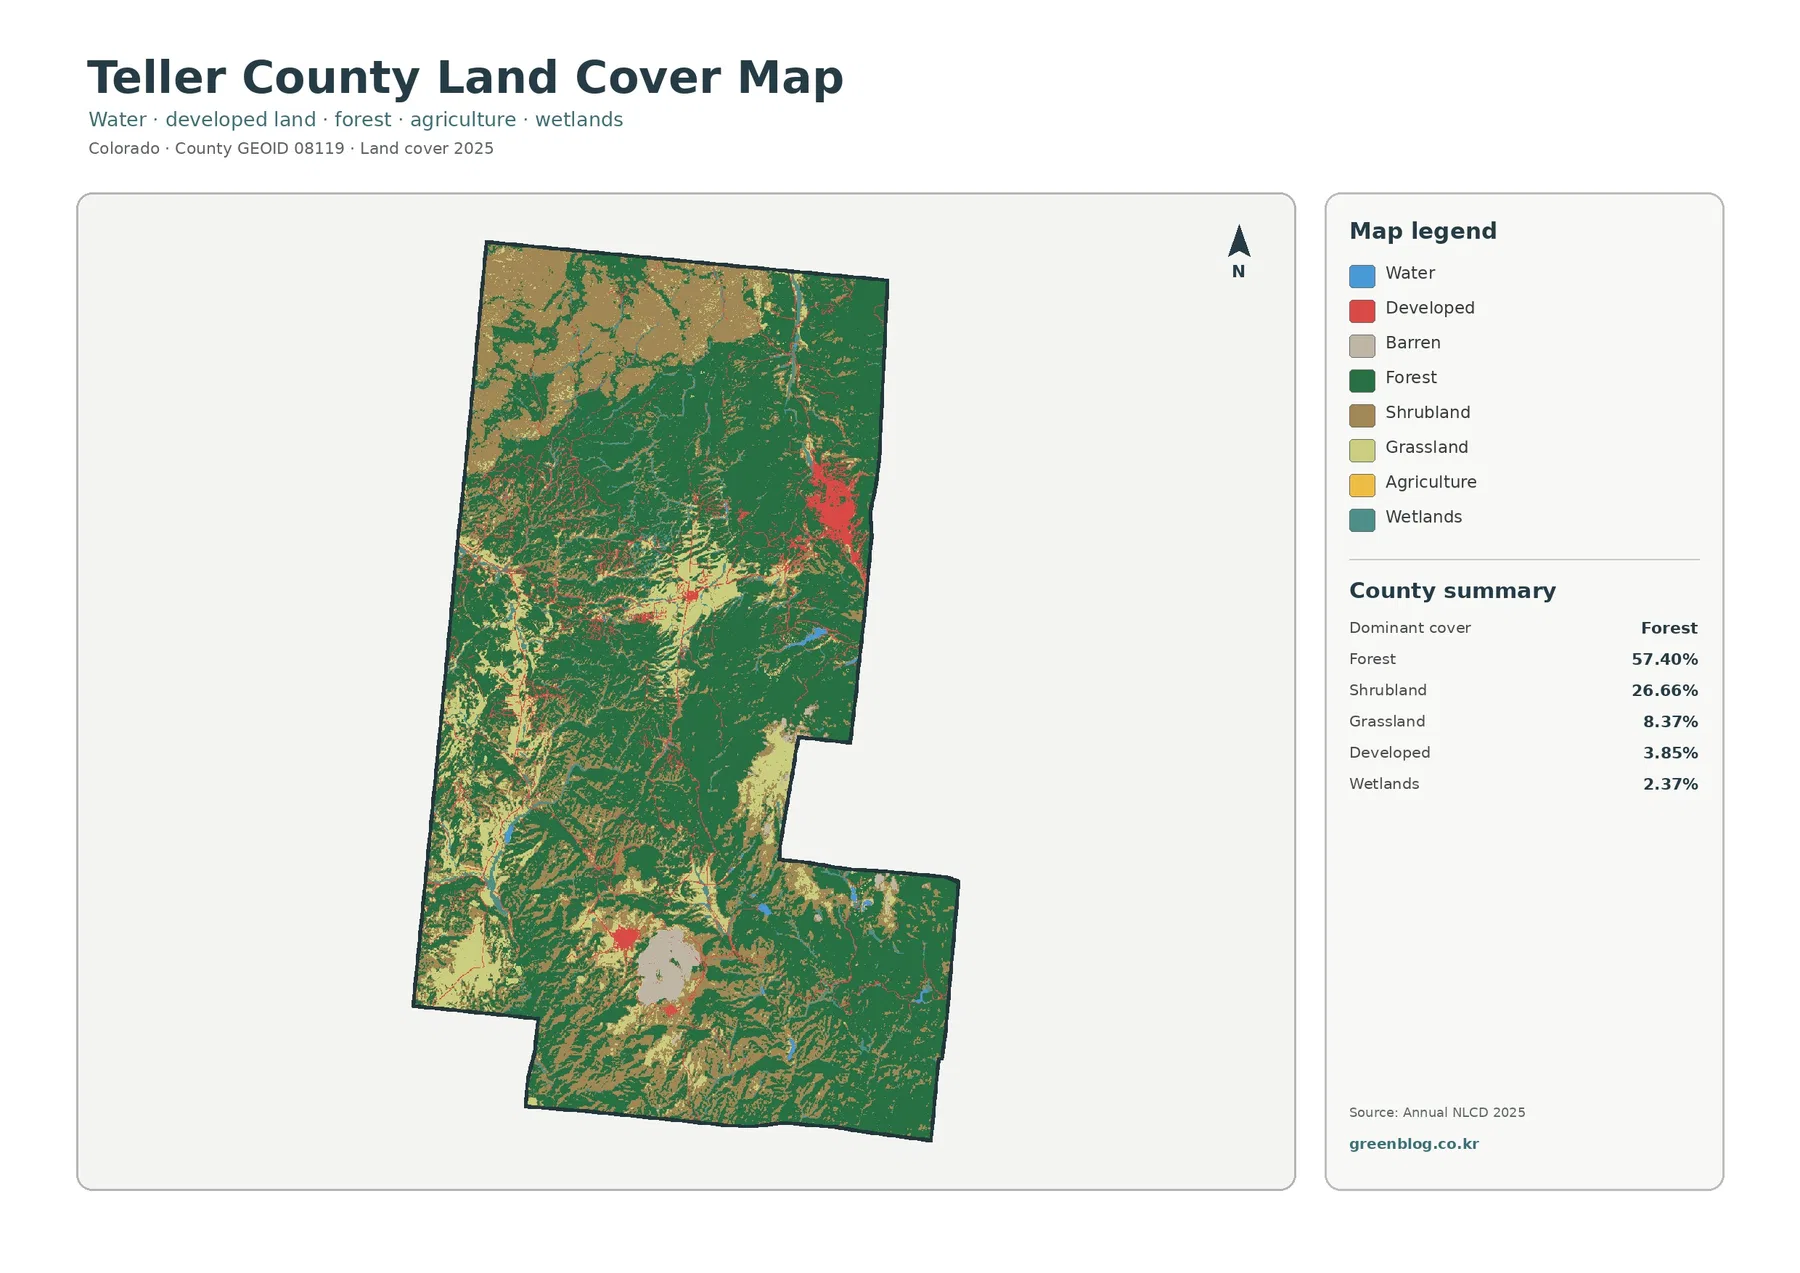
The broad pattern is easy to recognize before looking at any percentages. Forest covers much of the center, east, and south, while larger patches of shrubland spread across the western and northwestern parts of the county. Development is not evenly scattered through that natural cover. The largest concentration appears around Woodland Park in the northeast, with another smaller cluster around the Cripple Creek and Victor area to the south. Wetlands and water occupy much smaller shares, but their narrow shapes help identify drainage corridors and reservoirs within the mountain landscape.
Table of Contents
A county where forest is the starting point
Forest is the largest 2025 land-cover class in Teller County at 57.40%. On the map, dark green fills broad areas rather than appearing as a few isolated stands. The forest is interrupted by shrubland, grassland, developed areas, wetlands, and small bodies of water, so the county is not one continuous block of trees. The transitions are especially noticeable toward the west and northwest, where shrubland becomes much more prominent, and around settlements where developed classes cut into the surrounding natural cover.
Teller County’s own geographic descriptions help explain why these land-cover types appear together. The county lies on the western slopes of Pikes Peak and spans a large elevation range, from roughly 8,000 feet around Woodland Park to terrain above 14,000 feet on the back side of Pikes Peak. Forested ridges and mountain slopes therefore sit close to open meadows, shrub-covered ground, rocky areas, and drainage bottoms. The map does not assign causes to those patterns, but the county’s steep terrain and elevation differences provide useful context for understanding why one land-cover class does not dominate every slope and valley in the same way.
Shrubland is the second-largest class at 26.66%. It forms substantial patches in the northwest and west and also appears between forested areas elsewhere in the county. Grassland covers 8.37%, often showing up as lighter open areas mixed with forest and shrubland. Developed land is much smaller at 3.85%, yet it stands out because it is concentrated in recognizable clusters instead of being spread evenly over the county.
Land cover should not be confused with zoning, ownership, or legal land use. Annual NLCD products classify the surface into raster cells, meaning a grid of small areas derived from satellite data. A cell may contain trees, a road, lawns, and buildings but still receive one dominant classification. For that reason, the map is most useful for county-scale patterns and comparisons. It should not be treated as a parcel survey or as evidence that a particular property is legally forest, residential land, protected open space, or developable land.
Forest, shrubland, and grassland across the Pikes Peak side of the county
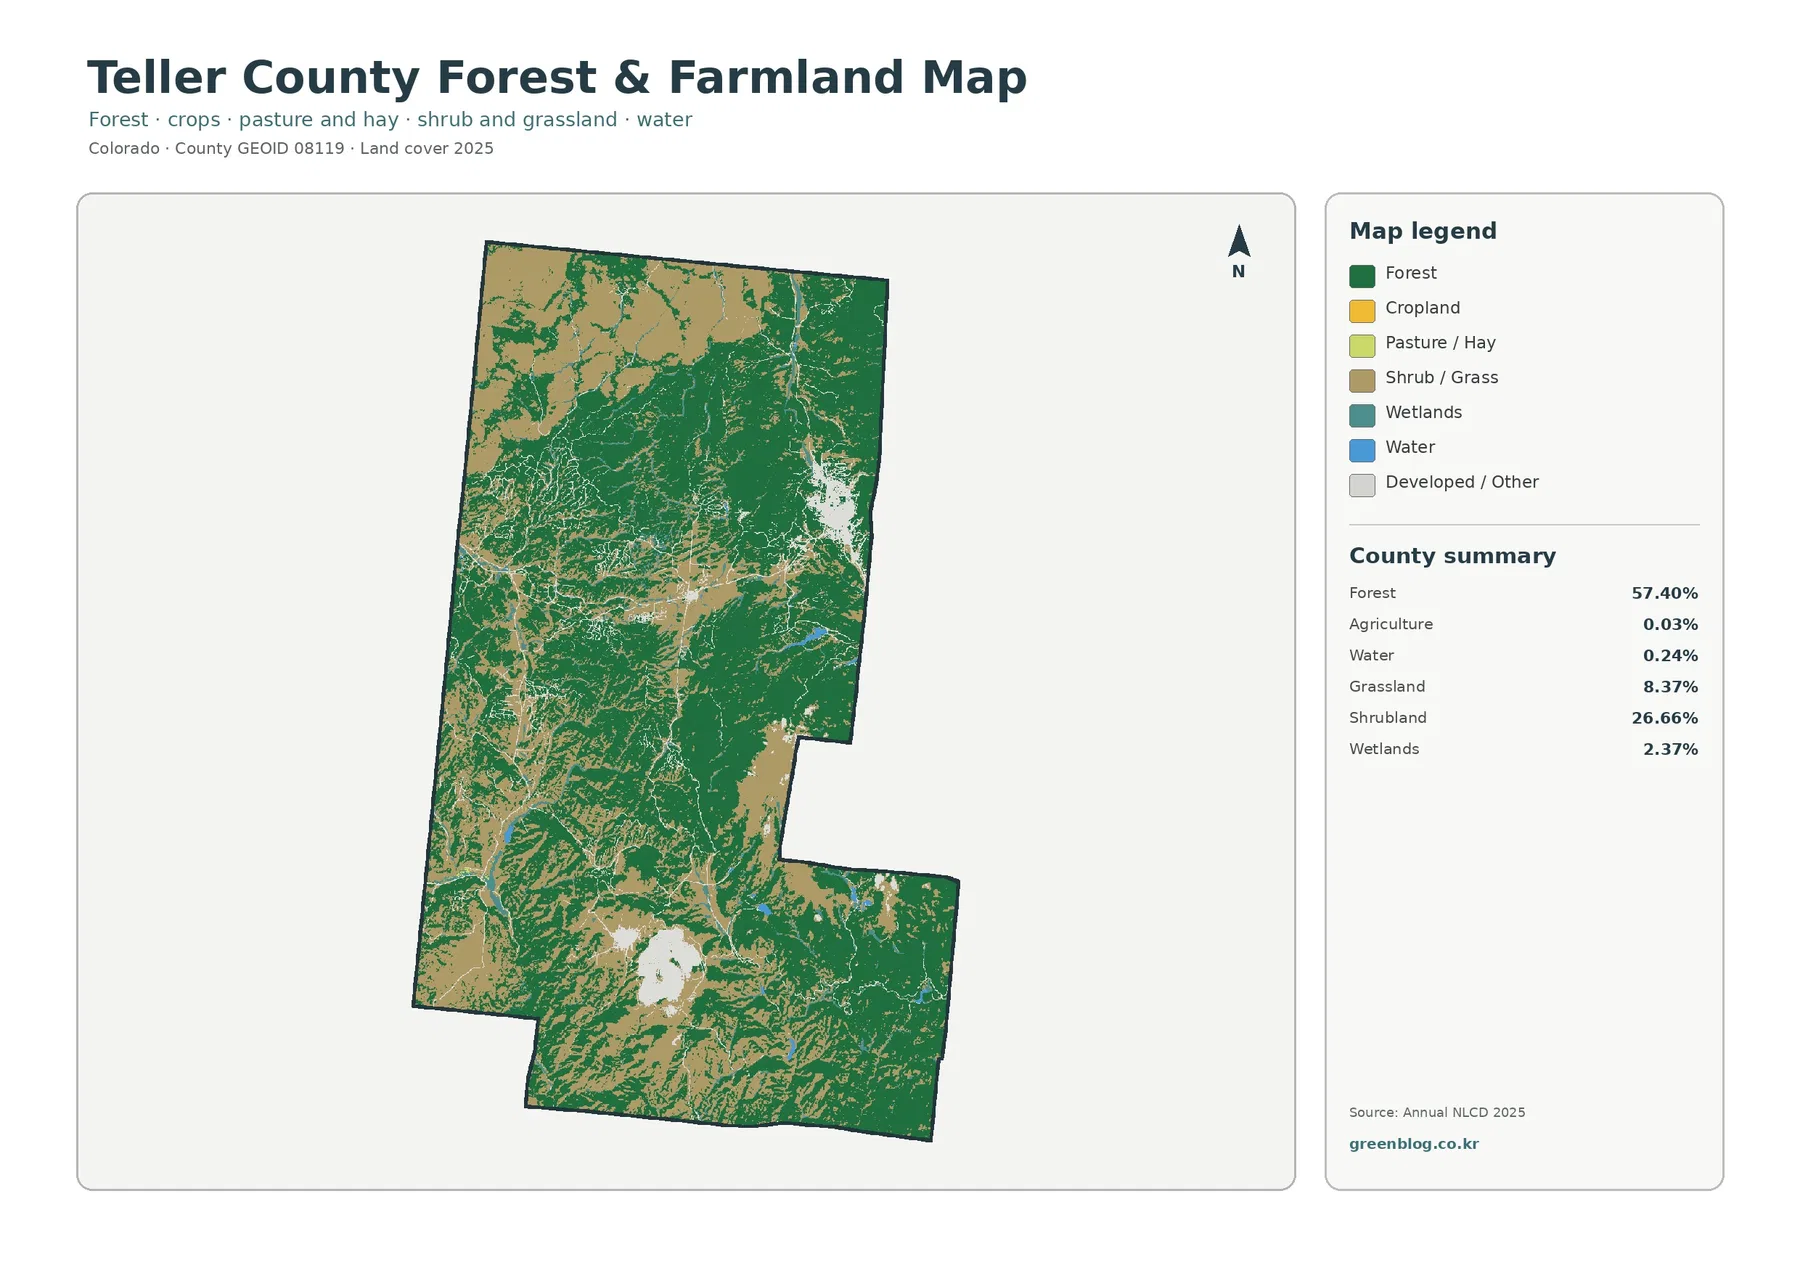
The forest-and-farmland view simplifies the legend so the natural-cover pattern is easier to compare. Agriculture is only 0.03%, so the map does not show the large blocks of cropland that characterize many eastern Colorado counties. Instead, the visual balance is between forest, shrub and grass cover, wetlands, water, and the relatively small developed or other category. This makes the map particularly useful for seeing where wooded slopes give way to more open mountain ground.
Large forested areas run through the middle and eastern portions of Teller County, while the western side contains broader shrub and grass patches. In the south, forest remains extensive but is broken by open areas around the Cripple Creek and Victor region. The boundaries between these classes are irregular rather than straight. They follow the complex shape of mountain ridges, valleys, and open slopes instead of administrative lines, which is one reason the forest edge looks detailed even at a county scale.
The county’s Community Wildfire Protection Plan describes forested slopes, ridges, and open meadows across the lower elevations and places Teller County in a transition between the High Plains grasslands and the eastern Rocky Mountain Front Range. It also notes extensive public lands managed by federal, state, and local agencies, including portions of Pike National Forest. That background supports the broad forest-and-open-land character visible in the map, although the land-cover colors themselves do not identify ownership, forest type, or management jurisdiction.
Wetlands account for 2.37% and water for 0.24%. Those shares are small compared with forest and shrubland, but the blue and teal features are useful reference points. Teller County intersects several watersheds, and numerous creeks and reservoirs occupy the mountain valleys. Narrow wet areas may appear as short or broken strips because a 30-meter raster cell is larger than many stream channels. The map is therefore useful for regional context but not for tracing an exact streambank or regulated wetland boundary.
Development stands out because it is concentrated
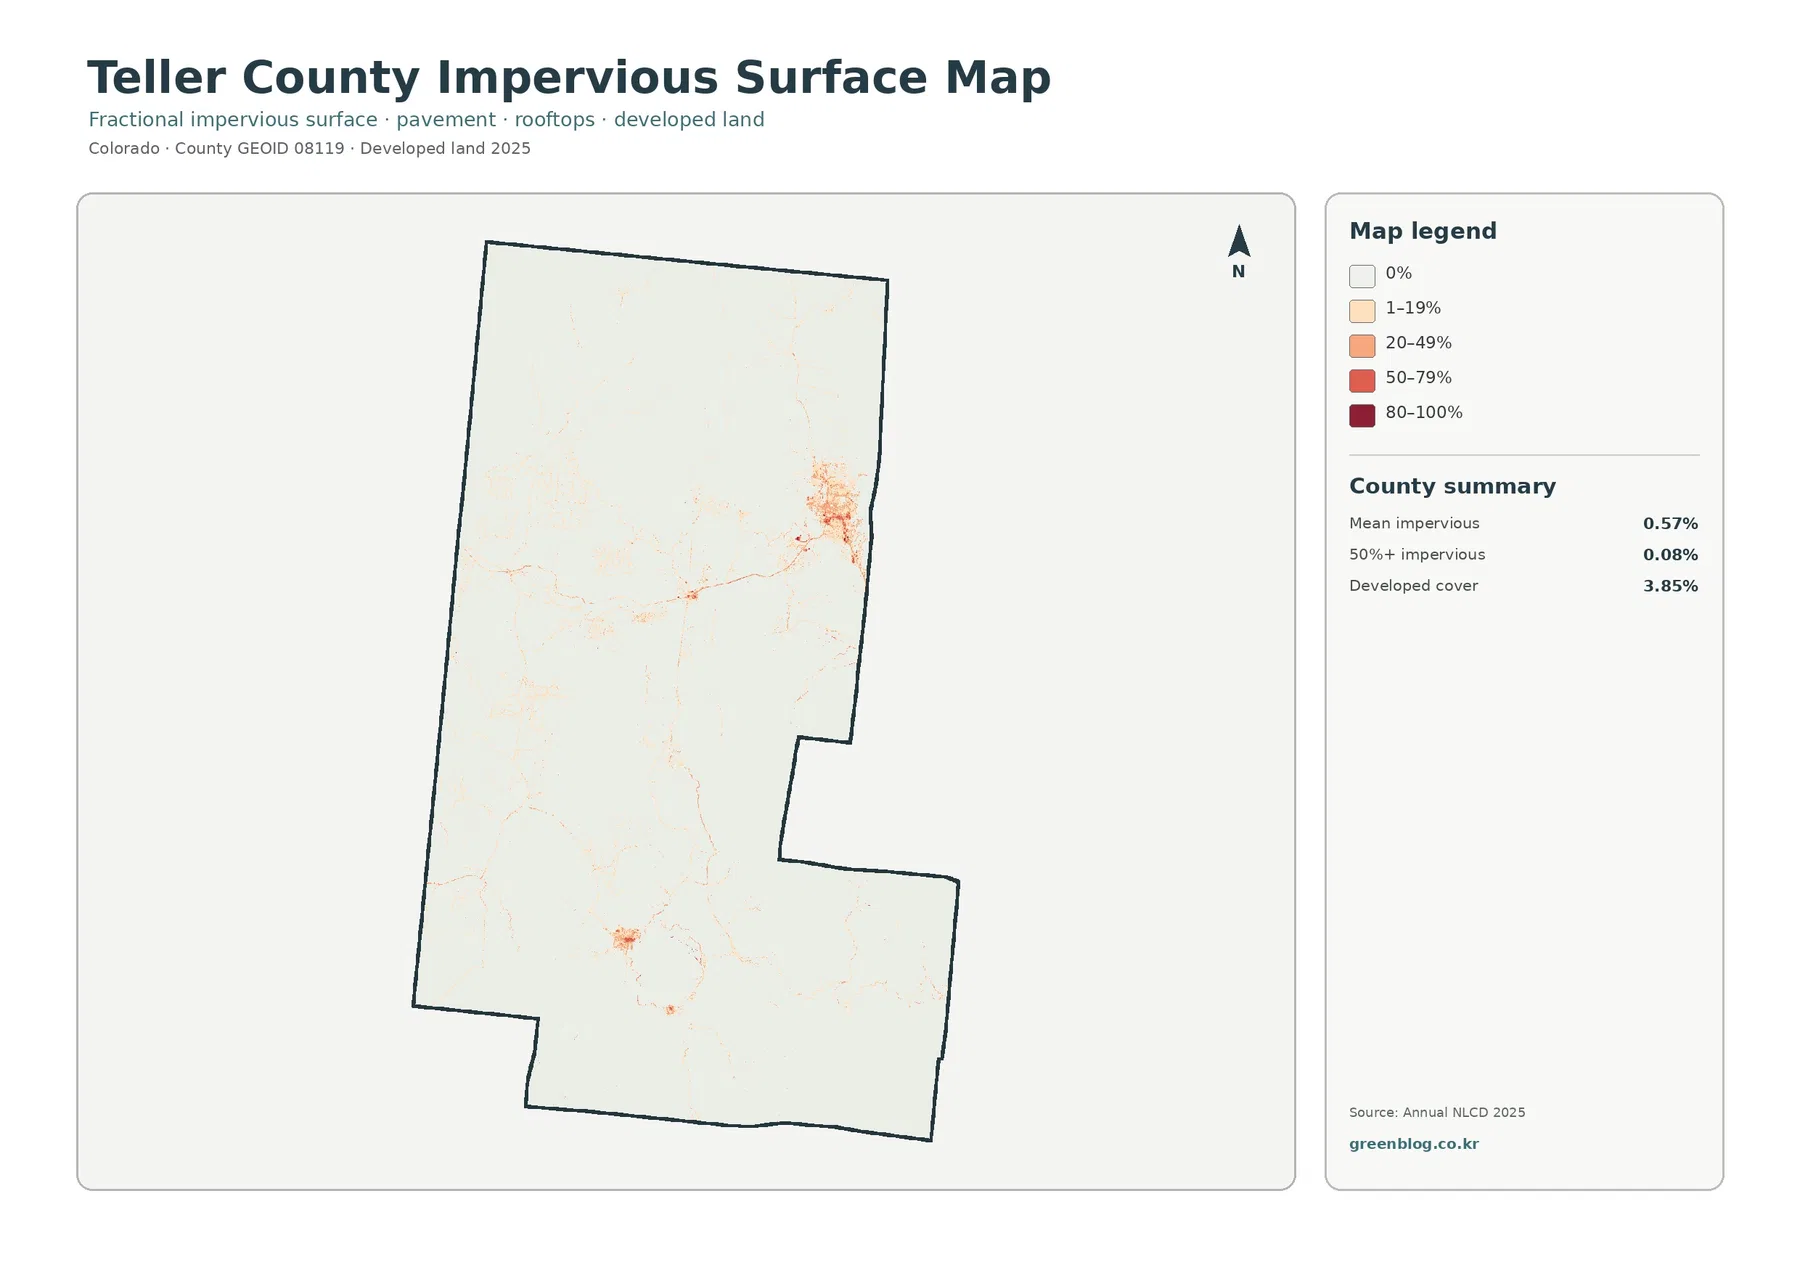
Developed land covers 3.85% of Teller County. That number is modest, but the map makes development easy to find because it forms compact clusters against a much larger forested background. The strongest concentration is in the northeast around Woodland Park. A second, smaller concentration appears in the south around Cripple Creek and Victor. Between those areas, natural cover remains dominant, with only thin linear traces of human-built surfaces connecting or extending from the main settlements.
The impervious-surface map adds another layer of detail. Impervious surface means pavement, rooftops, parking areas, and other surfaces that allow little water to soak directly into the ground. Teller County’s mean impervious value is 0.57%, and only 0.08% of the county is mapped at 50% impervious or higher. Most mountain land therefore appears very light on this map, while warmer colors cluster around the same developed communities seen in the general land-cover map.
The 3.85% developed-cover figure and the 0.57% mean impervious figure measure different things. A developed land-cover class can include lawns, trees, open ground, and buildings within the same cell, especially where development is low intensity. Imperviousness instead estimates how much of a cell is covered by hard surfaces. Comparing the two maps helps separate the broader developed footprint from the more heavily paved or built portions within that footprint.
A few thin lines extend away from the principal development clusters and likely correspond to transportation and settlement corridors. The map alone should not be used to assign a specific road name to every line or to claim that a road caused nearby development. What the data can show directly is concentration: hard surfaces and developed classes occur together more often around established communities and corridors than on the surrounding forested slopes.
What the 1985–2025 comparison highlights
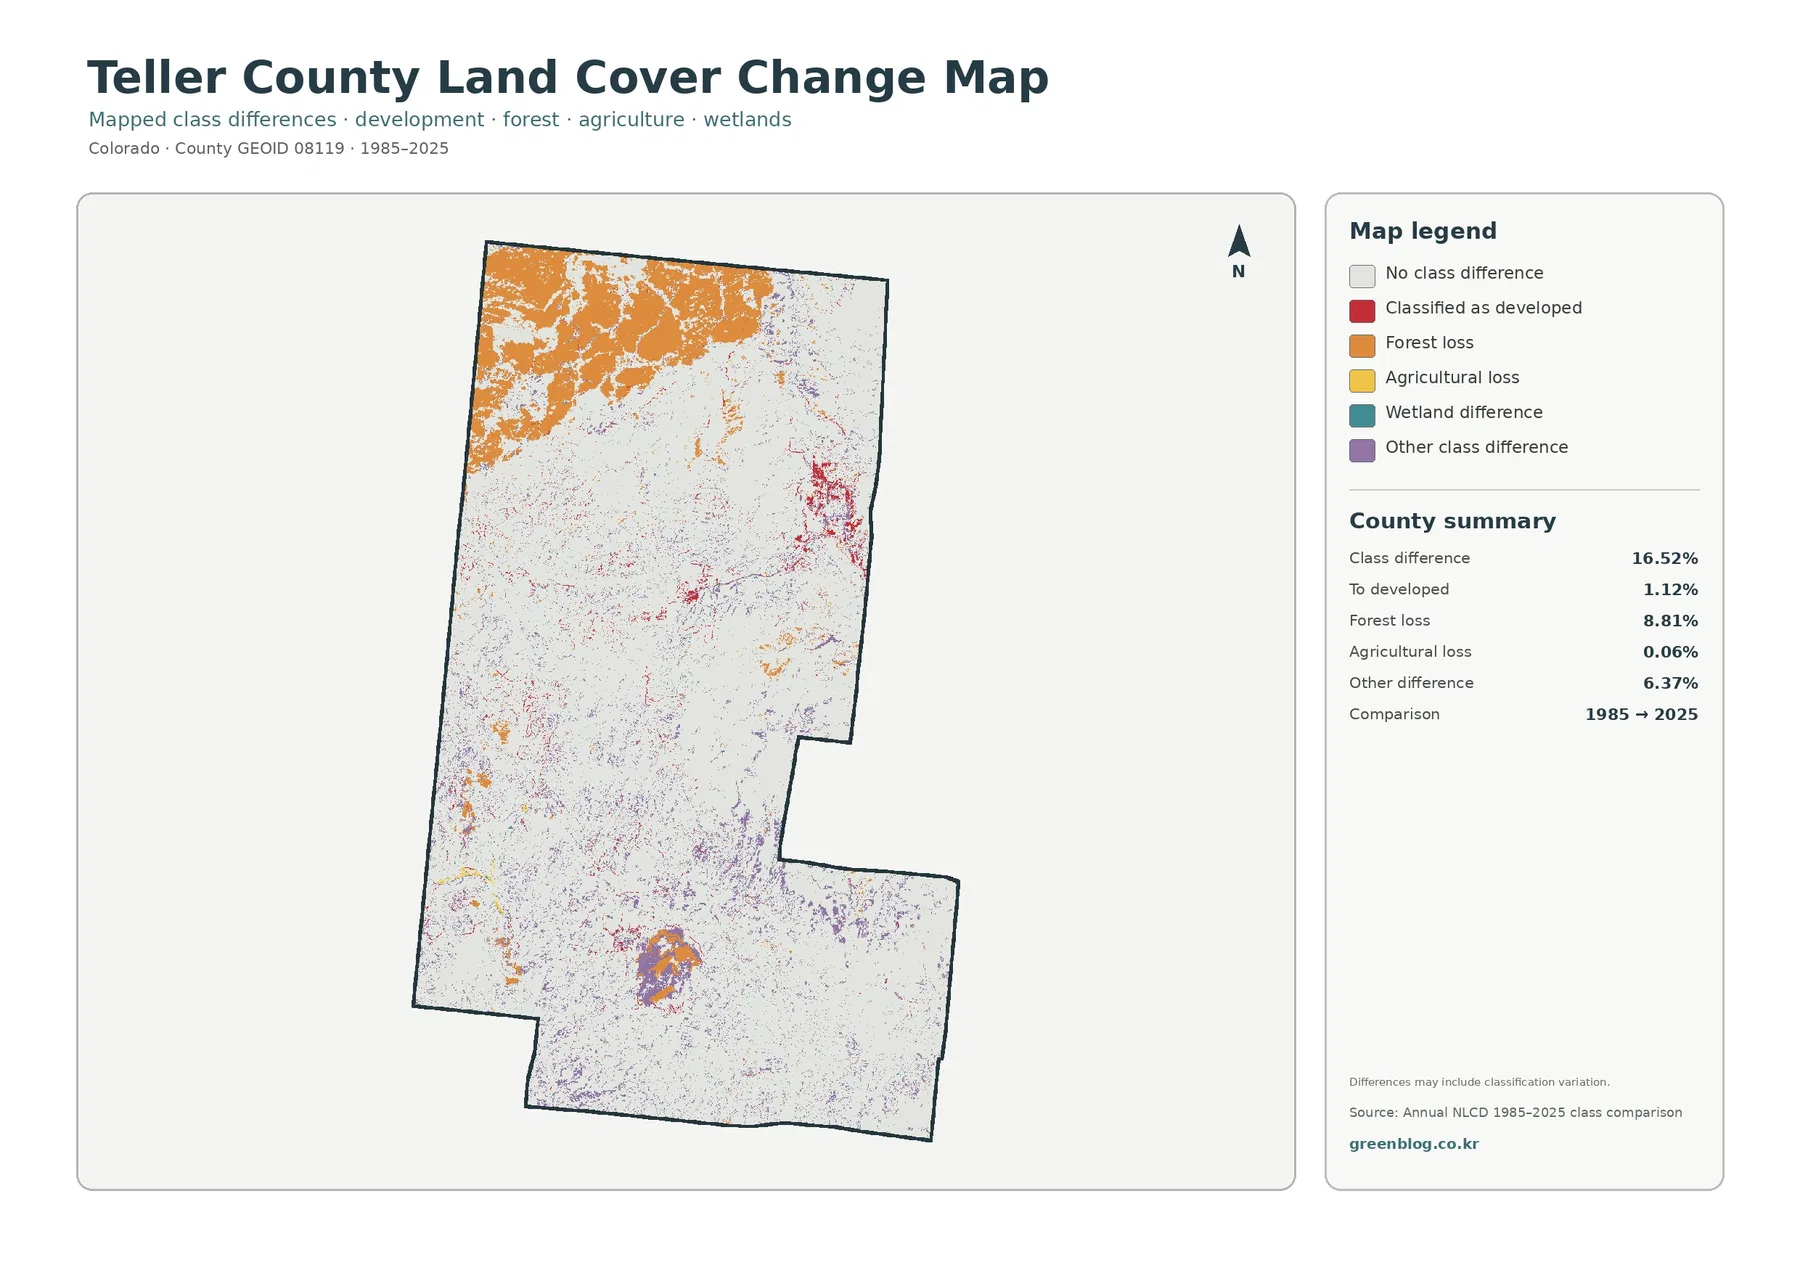
The change map compares land-cover classifications from 1985 and 2025 rather than showing the current landscape by itself. Across Teller County, 16.52% of the area is mapped with a class difference between the two dates. Forest loss is the largest named category at 8.81%. Areas classified as changing to developed land account for 1.12%, agricultural loss for 0.06%, and other class differences for 6.37%.
Orange forest-loss areas are especially prominent across the northern and northwestern parts of the county, with smaller patches scattered farther south. Red areas classified as a change to developed land are most visible around Woodland Park and appear in smaller amounts near southern settlements. Purple and other difference colors are more dispersed. The map therefore does not describe one single change process. It shows several types of class differences occurring in different parts of the county.
The 8.81% forest-loss category should not be read as a direct measurement of logging, wildfire, beetle damage, or development. This product compares mapped classes at two dates; it does not record the cause of every changed pixel. A place may move from forest to another class for many reasons, and the map itself warns that classification variation can be included. Identifying the cause of a particular patch requires additional evidence such as fire-history data, forest-management records, aerial photography, or a sequence of annual land-cover maps.
Mountain environments also create classification challenges. Steep slopes can produce shadows, seasonal snow cover changes from year to year, and mixed pixels can include both trees and open ground. A 30-meter cell that receives one class in 1985 and another in 2025 may reflect a real surface change, a gradual ecological transition, or a classification difference. The change map is best used to identify areas worth closer examination rather than to make a final statement about cause.
Small water areas still help explain the mountain landscape
Water covers only 0.24% of Teller County, but reservoirs and drainage corridors are useful landmarks when reading the maps. County planning documents place Teller County at the intersection of the Upper South Platte River, South Platte River Headwaters, Fountain Creek, and Upper Arkansas River watershed areas. They also identify smaller streams including Twin, Beaver, Cripple, Four Mile, Rule, and Wilson creeks, along with reservoirs such as Catamount and Skaguay.
Wetlands are more extensive than open water at 2.37%. They appear as narrow or irregular features within the larger forest and shrubland pattern rather than as broad continuous areas. On the simplified forest-and-farmland map, these wet features are easier to distinguish from surrounding vegetation. They can help with watershed lessons, habitat comparisons, and regional environmental context, especially when paired with a separate hydrography layer.
The scale of the source data is important here. Many mountain streams are narrower than one 30-meter raster cell, and the margins of reservoirs can shift with water level and season. A wet meadow containing trees, grass, and standing water can also be generalized to one dominant class. For exact stream geometry, wetland regulation, or property-level decisions, a dedicated water or wetlands dataset is more appropriate.
Choosing the map that matches the question
For a quick overview, the 2025 land-cover map is the best place to start. It puts forest, shrubland, grassland, developed land, wetlands, water, and other relevant classes in one view. The county’s strongest traits become apparent immediately: extensive forest, broad shrubland in parts of the west and northwest, very little agriculture, and development concentrated around a small number of communities.
The forest-and-farmland map is useful when natural cover matters more than urban detail. Because agriculture is nearly absent, this version functions mainly as a clear comparison of forest, shrub and grass cover, wetlands, and water. It can work well in classroom materials, habitat discussions, or county-to-county comparisons where a simpler legend makes the broad landscape easier to explain.
Use the impervious map when the question is about built surfaces rather than total developed land. The overall county average is low, yet the map clearly identifies where roads, rooftops, and other hard surfaces are concentrated. That makes it useful for watershed context, runoff discussions, settlement comparisons, and presentations showing how compact development sits within a much larger mountain landscape.
The change map answers a different question again. It highlights where 1985 and 2025 classifications differ. It does not replace the current land-cover map, and it should not be used alone to explain why a particular place changed. A good comparison is to locate a forest-loss patch on the change map and then check what class occupies that location in the 2025 map. Development-change areas can be compared with the impervious map in the same way.
Scale, date, and interpretation limits
Annual NLCD is designed for consistent regional mapping rather than parcel-level surveying. At roughly 30-meter raster resolution, small roads, narrow wetlands, individual houses, tiny forest openings, and mixed vegetation patches may be generalized. Edges can look blocky because the map represents square cells instead of precise field boundaries. Those limitations are normal for a dataset intended to compare large areas across the United States.
The current land-cover view is labeled 2025. Any construction, fire, vegetation recovery, forest treatment, or water-level change after the observation period may not appear. The 1985–2025 comparison also compresses four decades into two endpoints. It tells you where the classifications differ, but not when an intermediate change occurred or whether a location changed more than once during that period.
For planning context, environmental education, watershed study, habitat comparison, or presentation graphics, the maps provide a useful county-wide reference. For zoning, ownership, permits, parcel boundaries, regulatory wetlands, or legal development rights, use current Teller County GIS and agency records instead. A land-cover class describes what the surface appears to be covered by; it does not establish what a parcel may legally be used for.
Key numbers to remember
In the 2025 summary, forest accounts for 57.40% of Teller County and shrubland for 26.66%. Together they cover more than four-fifths of the county. Grassland adds 8.37%, developed land 3.85%, wetlands 2.37%, water 0.24%, and agriculture only 0.03%. Those figures reinforce what is visible on the map: Teller County is overwhelmingly a forest-and-shrub mountain landscape rather than an agricultural county.
The impervious dataset gives a mean value of 0.57%, with 0.08% of the county at 50% impervious or higher. The change comparison reports a 16.52% class difference, including 8.81% in the forest-loss category, 1.12% changing to developed land, 0.06% agricultural loss, and 6.37% other difference. These statistics answer different questions, so they should not be added together or treated as parts of the same 2025 land-cover total.
Each original JPG is 2480×1754 pixels. The package manifest does not certify these files as meeting an A3 high-resolution reference, so large-format printing should be checked at the intended output size first. For normal document use, screen viewing, and many presentation layouts, the original JPGs make the legend and small map features easier to inspect than a screenshot.
Frequently Asked Questions
What is the largest land-cover class in Teller County?
Forest is the largest 2025 class at 57.40%, followed by shrubland at 26.66%. Grassland adds another 8.37%, so most of the county is mapped as forest, shrub, or grass cover rather than agriculture or dense development.
Where is developed land most visible?
The strongest concentration is around Woodland Park in the northeast. A separate smaller cluster appears around Cripple Creek and Victor in the south. The impervious-surface map shows the same general concentration of harder built surfaces in those settlement areas.
Does the 8.81% forest-loss category mean that exact amount of forest was destroyed?
No. It means 8.81% of the county was placed in the forest-loss category when the 1985 and 2025 classifications were compared. The map does not identify the cause, so fire records, forest data, aerial imagery, or additional annual land-cover layers are needed to explain a particular location.
Map File Information
Use the ZIP below to save the original JPG versions of the Teller County maps. It contains all four map types discussed on this page.
- Included Files: Use only the versions confirmed in the article and supplied images
- File Type: Use the confirmed download contents
- Intended Use: Printing, education, presentations, and map-based projects
Related Maps
- Adams County Colorado Land Cover Map
- Alamosa County Colorado Land Cover Map
- Arapahoe County Colorado Land Cover Map
Sources and References
- MRLC Annual NLCD Data — land-cover and impervious-surface data
- USGS Annual NLCD Land Cover Classification — classification definitions and dataset context
- Teller County Community Wildfire Protection Plan — county geography, forests, watersheds, and public-land context
- Teller County History — location on the western slopes of Pikes Peak and local elevation context
- U.S. Census Bureau TIGER/Line Shapefiles — county boundary data
Green Map creates custom-edited map images using open geographic data sources such as geoBoundaries, Natural Earth, OpenStreetMap, and government open data.
These maps are edited visual materials, not raw data files, and are provided for education, documents, presentations, and graphic reference.