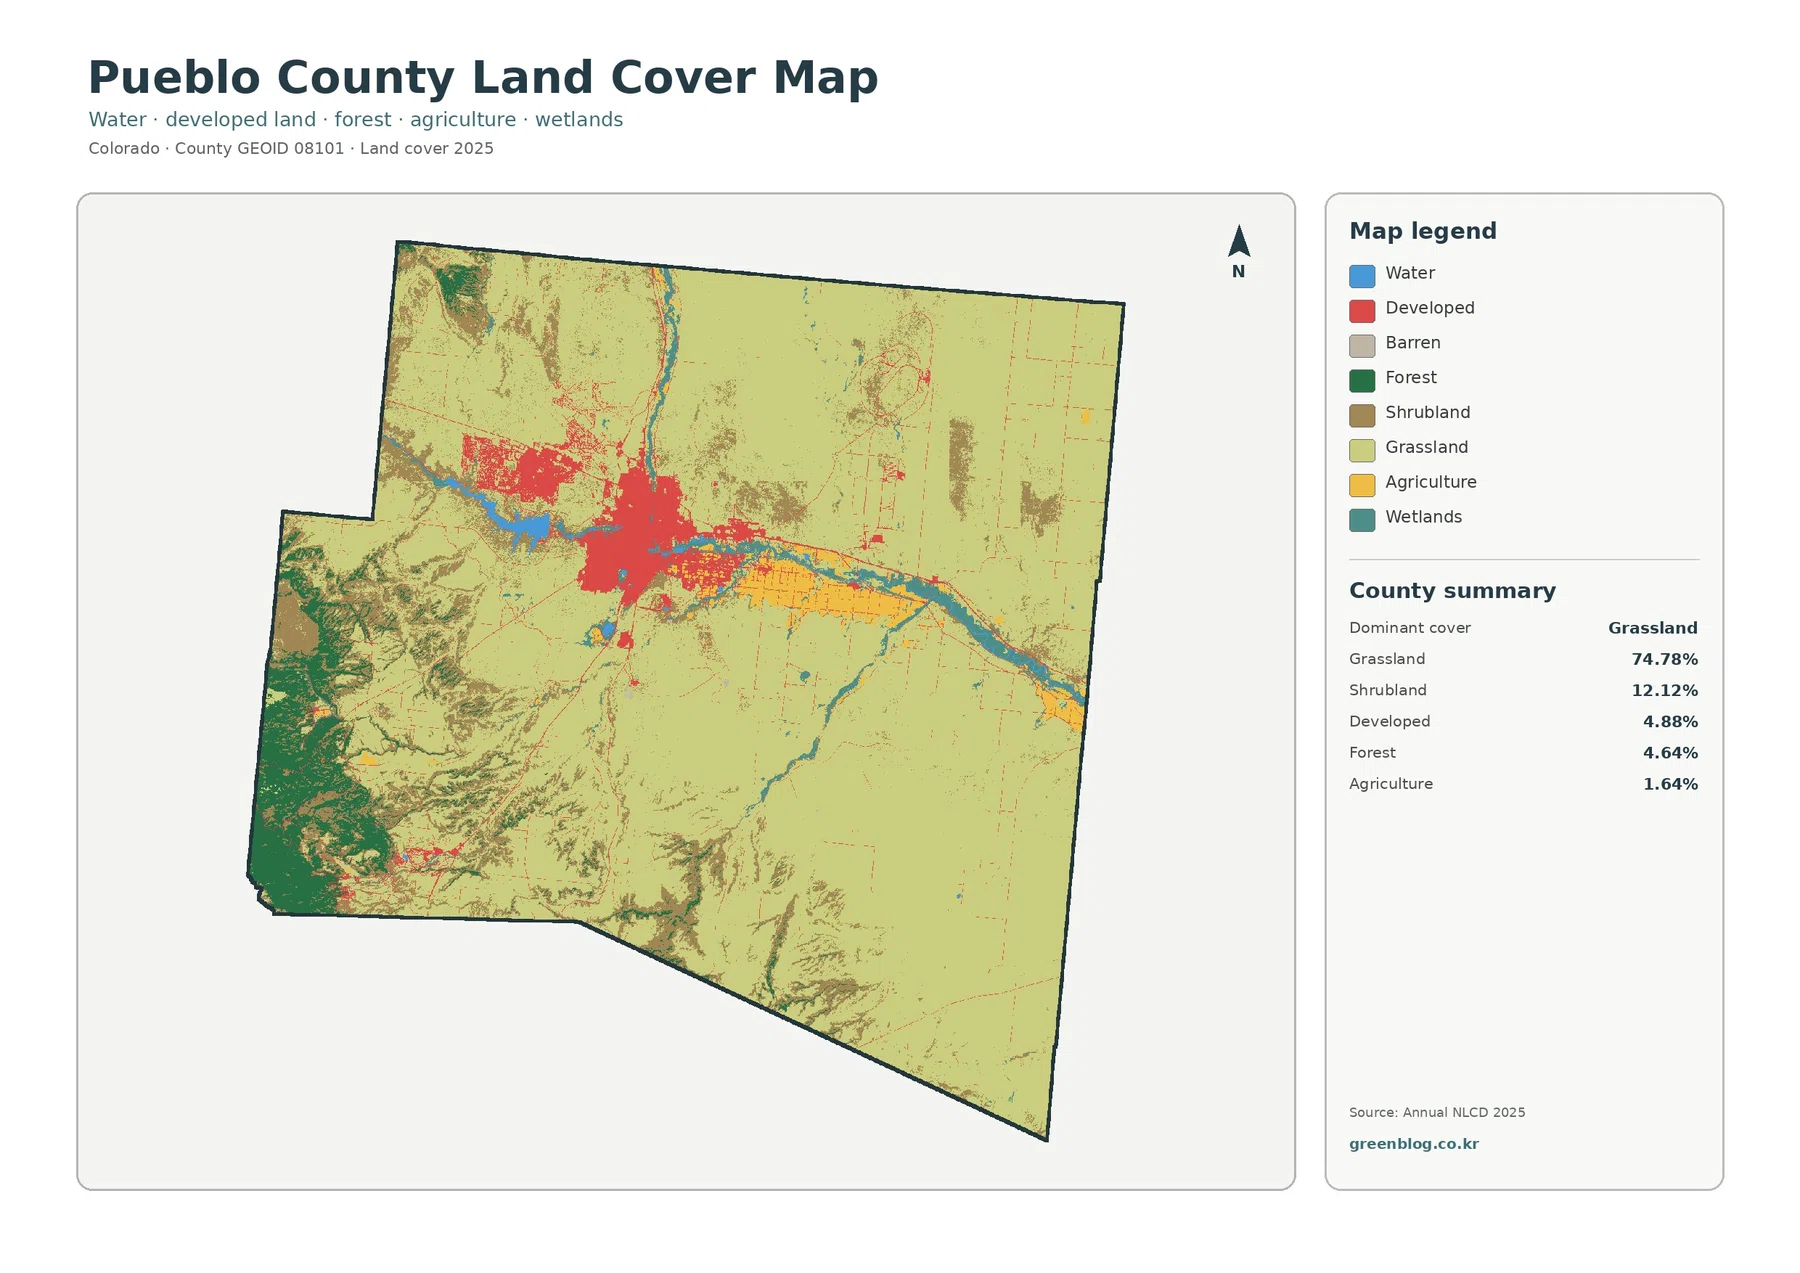
Pueblo County combines a broad grassland plain with one of southern Colorado’s largest urban concentrations, a major reservoir, and a forested southwestern edge. The 2025 land-cover summary is led by grassland at 74.78%, followed by shrubland at 12.12%, developed land at 4.88%, forest at 4.64%, and agriculture at 1.64%. Those percentages describe the county as a whole, but the map is more varied than the numbers suggest: water and wetlands trace the Arkansas River, Pueblo and Pueblo West form distinct developed clusters, and forest becomes much more visible toward the southwest.
The page includes four views of the same county: current land cover, forest and farmland, impervious surface and developed land, and mapped class differences between 1985 and 2025. All four original JPG maps are available in one ZIP download, so the reservoir, river corridor, urban area, agricultural patches, and open grassland can be compared without switching between separate pages.
Table of Contents
A grassland county with a strong west-to-east contrast
Grassland is the defining cover across most of Pueblo County. Large continuous areas extend through the north, east, and southeast, giving the general map a relatively uniform appearance away from the main settlements and waterways. The western side is more complicated. Shrubland becomes common, forest appears in the southwest, and Pueblo Reservoir creates a large blue feature immediately west of the main urban area.
Shrubland accounts for 12.12% of the 2025 classification, making it the second-largest class. It is especially useful for understanding the transition between the open plains and the rougher western landscape. Shrub-covered cells mix with grassland and forest rather than forming one isolated block, so this part of the county looks more varied than the eastern plain.
Forest covers 4.64% of the county. That is a modest countywide share, yet its location is highly concentrated and visually important. The green forest class becomes much more common along the southwestern and western margins, while the broad eastern half has very little mapped forest. The map therefore separates two landscape settings that a single percentage cannot describe: open plains across most of the county and forested uplands near the southwest edge.
Water represents 0.43% and wetlands 1.47%. These are small shares, but they are not evenly scattered. Pueblo Reservoir forms the largest water body, and narrower water and wetland classes continue east along the Arkansas River. Their linear shape makes them easy to recognize even though they occupy much less area than grassland or shrubland.
Agriculture is a small county share but a clear river-side pattern
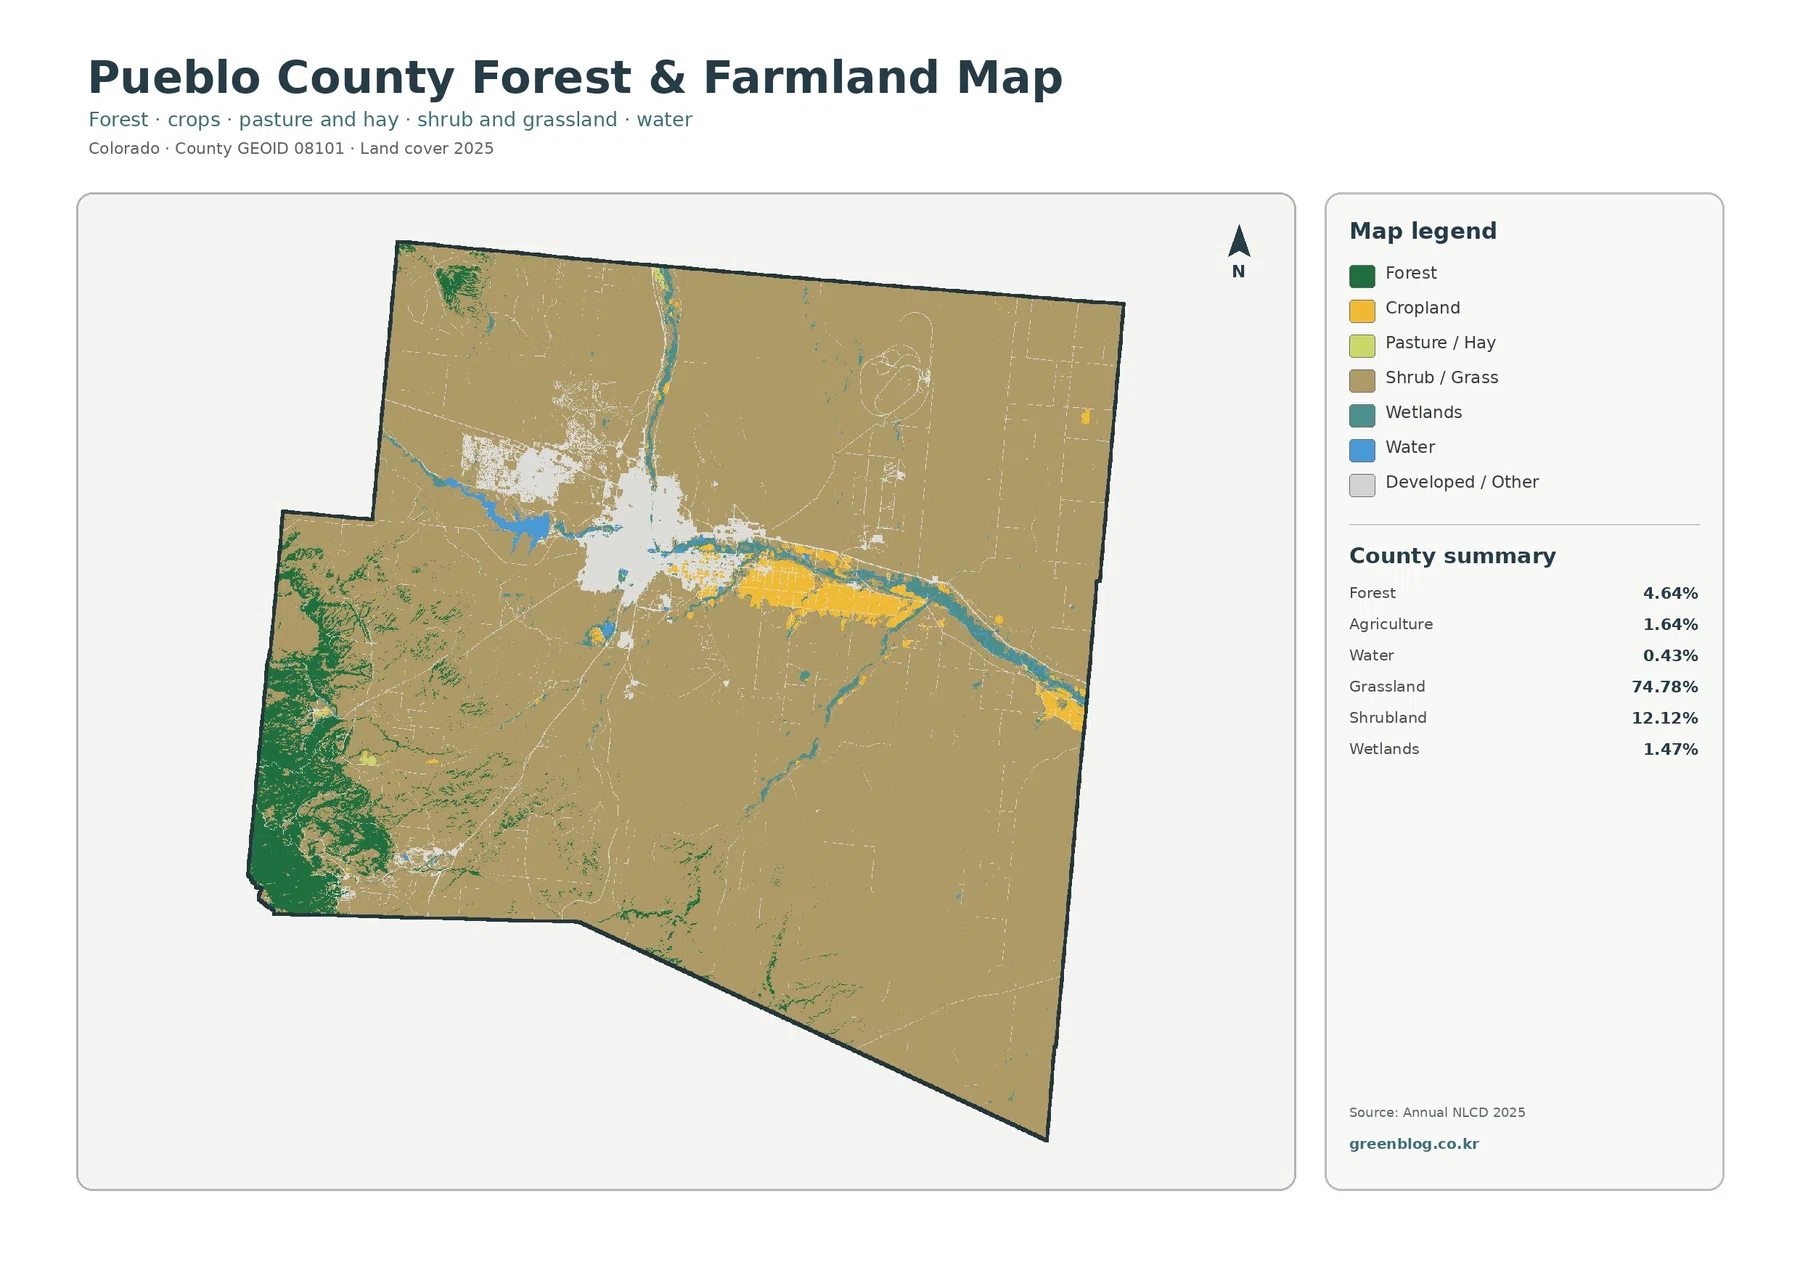
The forest-and-farmland view simplifies the legend and makes the agricultural pattern easier to isolate. Agriculture is only 1.64% of the countywide classification, yet yellow cropland patches stand out east of Pueblo and along sections of the Arkansas River corridor. They are not spread uniformly across the plains. Instead, they appear in a more limited band surrounded by much larger areas of grass and shrub cover.
The river corridor also places several land-cover types close together. Water and wetland cells follow the low corridor, agricultural fields appear nearby, and developed cover becomes strong around Pueblo. Farther from the river, the map quickly returns to broad grassland. This concentration makes the river a useful reference when comparing the four maps because it passes through the county’s most varied mix of cover.
The southwestern part of the county looks very different from the agricultural east. Forest patches become much more prominent near the county edge, while shrub and grass cover remain extensive between the forested areas and the urban center. That contrast helps explain why agriculture can be locally conspicuous while still representing a small percentage of the county as a whole.
Land cover is not the same as legal land use. A cell classified as agriculture does not define a parcel boundary, farm ownership, zoning district, or permanent agricultural status. Fields can also look different from year to year because of crop cycles, fallow conditions, or moisture. Parcel questions should be checked against local planning, assessor, or other detailed GIS records.
Impervious cover concentrates sharply around Pueblo
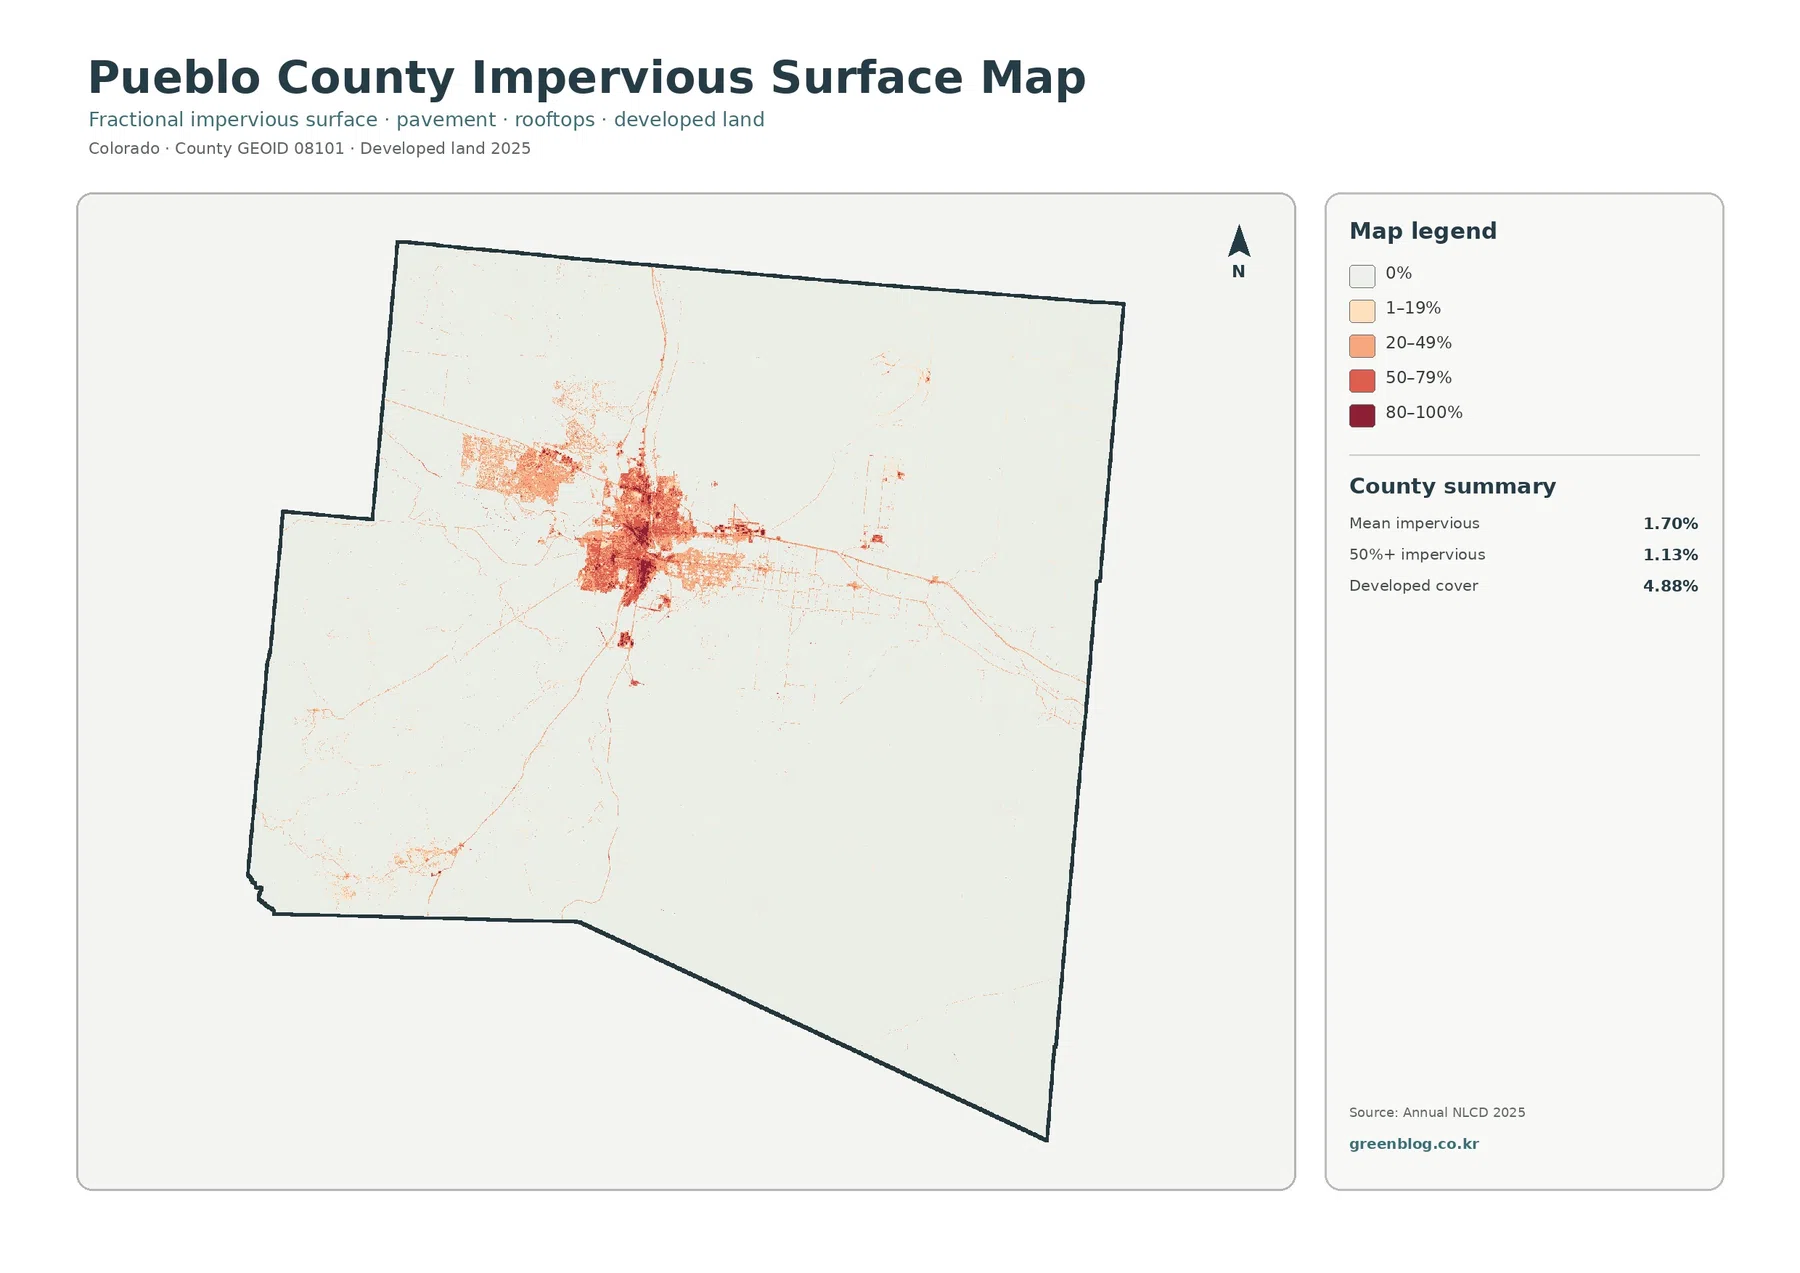
Impervious surface means pavement, rooftops, and other hard surfaces that allow little water to soak into the ground. Pueblo County has a mean impervious value of 1.70%, while land with at least 50% impervious cover accounts for 1.13%. Most of the county is therefore very light on this map, but the Pueblo urban area forms a large dark concentration that is impossible to miss.
Pueblo West creates another developed concentration west of the main city. It is less intense than central Pueblo but extends across a noticeable area. Smaller lines and patches continue away from the two main clusters, while the south and east remain overwhelmingly low in impervious cover. This pattern gives a direct visual measure of how concentrated the county’s hard surfaces are.
Developed land represents 4.88% of the general land-cover classification, which is larger than the 1.70% mean impervious value. The two statistics measure different things. Developed classes can include low-density neighborhoods where vegetation and soil remain between roads and buildings, while the impervious layer estimates the fraction of hard surface within each raster cell.
The layer is useful for comparing urban and rural cover, identifying where hard surfaces are concentrated, and adding context to runoff or watershed discussions. It is not a drainage model, flood map, building-footprint layer, or road inventory. A dark cell indicates a high share of impervious surface, but it does not identify the specific building, road type, or construction date.
The 10.50% class-difference value needs context
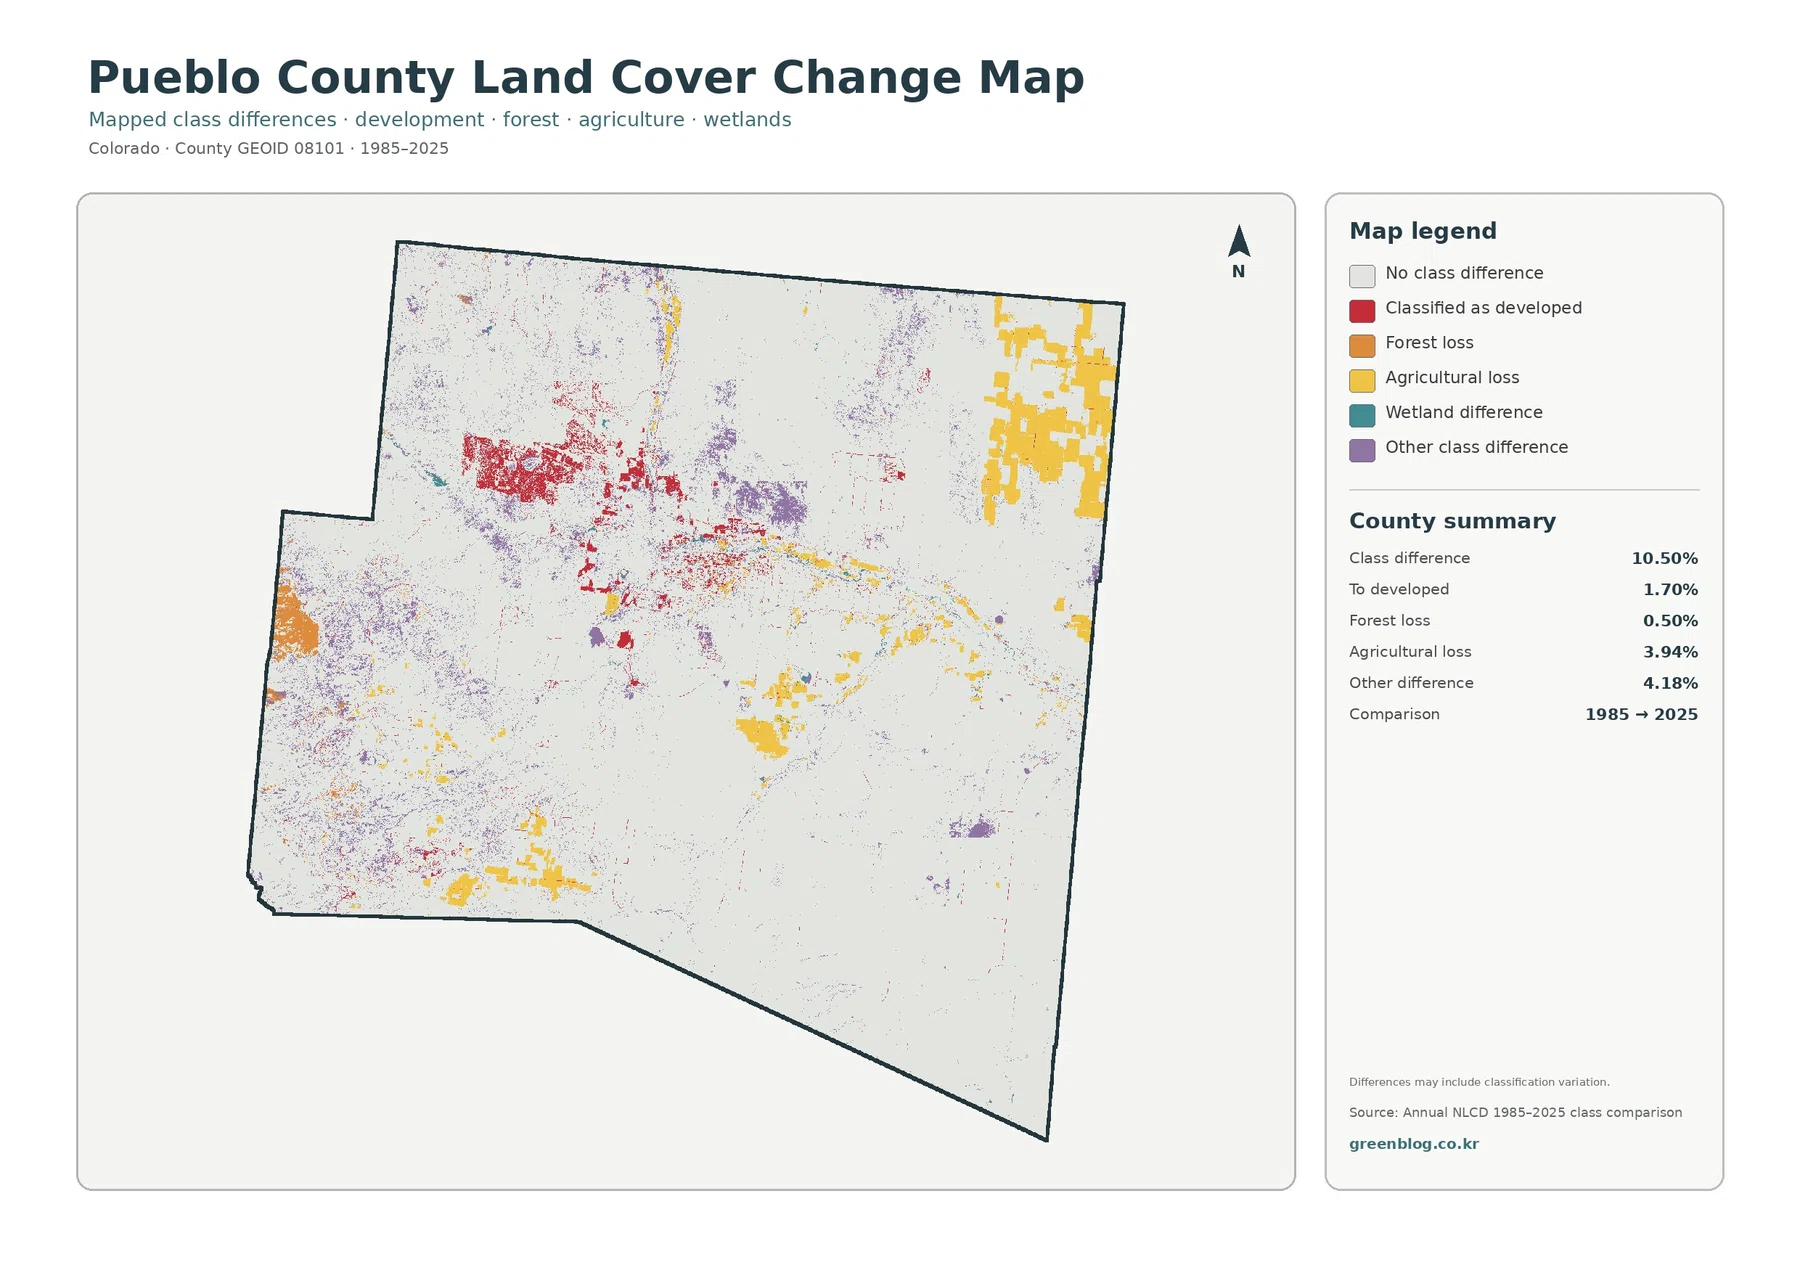
The 1985–2025 comparison marks class differences across 10.50% of Pueblo County. The summary identifies 1.70% classified to developed land, 0.50% forest loss, 3.94% agricultural loss, and 4.18% other class difference. Red development-related cells are concentrated around Pueblo and nearby settled areas, while yellow agricultural-loss cells appear more broadly in the east and in smaller patches elsewhere.
That 10.50% figure should not be read as a damage rate. It is the share of raster cells assigned to different land-cover classes in the two comparison years. Real development, vegetation change, or shifts in cultivation can contribute, but the result can also reflect image timing, moisture, crop conditions, sensor differences, and changes in classification methods. The supplied map itself warns that the differences may include classification variation.
The 3.94% agricultural-loss category deserves the same caution. It does not demonstrate that 3.94% of Pueblo County permanently stopped being farmland. A field can move between agricultural and grass-related classes depending on whether it was planted, harvested, fallow, or unusually dry when observed. A stronger land-use conclusion would require intermediate Annual NLCD years, aerial imagery, agricultural statistics, and local records.
The change map works best as a screening tool. Development-related red cells can be compared with the current impervious layer around Pueblo, while agricultural differences in the east can be checked against the current farmland view. Areas that remain unclear can then be investigated with additional years or more detailed local data.
Pueblo Reservoir is a useful anchor for comparing the maps
Pueblo Reservoir is the county’s most prominent mapped water feature. Colorado Parks and Wildlife describes Lake Pueblo as having more than 4,600 surface acres of water, and the reservoir appears as a large blue shape immediately west of the urban area. From there, the Arkansas River continues east through Pueblo and across the county.
Using the reservoir and river as reference points makes the four layers easier to compare. The general map shows water, wetlands, development, and nearby agriculture together. The farmland layer emphasizes agricultural patches farther east. The impervious map shifts attention to the built-up Pueblo and Pueblo West areas, while the change layer shows where the 1985 and 2025 classifications differ along the same broad corridor.
Pueblo County’s Planning and Zoning Division lists county planning resources that include wetland potential conservation areas, a survey of critical biological resources, agricultural material, and comprehensive planning documents. Those resources are important for questions that go beyond surface cover. The maps on this page describe what the ground is classified as being covered by; they do not determine zoning, ownership, development rights, or conservation restrictions.
Choosing the right map for the question
- Start with the 2025 general land-cover map when you need the countywide relationship among grassland, shrubland, forest, water, agriculture, wetlands, and development.
- Use the forest-and-farmland map when the main question is where agriculture near the Arkansas River sits relative to the southwestern forest and the open plains.
- Use the impervious-surface map to isolate pavement and rooftops in Pueblo and Pueblo West from the much less built-up remainder of the county.
- Use the 1985–2025 change map to locate classification differences before checking intermediate years, imagery, or local records for an explanation.
These maps use generalized raster cells rather than parcel polygons. A raster divides the landscape into small grid cells and assigns a representative class or impervious value to each one. Narrow streams, roads, small wetlands, shelterbelts, and individual buildings can be mixed with surrounding cover, so the maps are best used for county-scale patterns rather than property-level decisions.
The set works well for environmental education, watershed context, comparisons of urban and rural cover, presentation graphics, and preliminary review of long-term change. Pueblo County is particularly useful for this kind of comparison because one map frame contains an urban center, a large reservoir, a river corridor, extensive plains, localized agriculture, and a forested southwestern edge.
Download the four Pueblo County JPG maps
The ZIP below contains the four original JPG maps discussed on this page. Each image is 2480×1754 pixels. They are convenient for documents, classroom materials, presentations, and regional comparisons, but the supplied asset manifest does not mark them as meeting the A3 high-resolution reference. For large-format production or detailed GIS work, use the underlying Annual NLCD data.
Frequently Asked Questions
What is the dominant land cover in Pueblo County?
Grassland is the largest 2025 class at 74.78%. Shrubland follows at 12.12%, while developed land is 4.88%, forest 4.64%, and agriculture 1.64%.
Which map is best for comparing Pueblo and Pueblo West with the surrounding plains?
Use the impervious surface map to isolate pavement and rooftops in Pueblo and Pueblo West. Pair it with the general land cover map to compare those developed areas with the much broader grassland and shrubland around them.
Does the 10.50% class difference mean 10.50% of Pueblo County was damaged?
No. It is the share of raster cells assigned to different land-cover classes in 1985 and 2025. Real change may be included, but classification, moisture, crop conditions, and image timing can also affect the comparison.
Map File Information
The ZIP contains four JPG maps: 2025 land cover, forest and farmland, impervious surface and developed land, and the 1985–2025 class-difference map.
- Included Files: Use only the versions confirmed in the article and supplied images
- File Type: Use the confirmed download contents
- Intended Use: Printing, education, presentations, and map-based projects
Related Maps
- Adams County Colorado Land Cover Map
- Alamosa County Colorado Land Cover Map
- Arapahoe County Colorado Land Cover Map
Sources and References
Percentages and 1985–2025 class-difference values come from the supplied Annual NLCD-based Pueblo County map assets. Pueblo Reservoir and county planning context were checked against Colorado Parks and Wildlife and Pueblo County official material. Land cover describes the physical surface and should not be substituted for zoning, ownership, legal land use, or parcel boundaries.
- MRLC Annual NLCD Data
- USGS Annual NLCD Land Cover Classification
- U.S. Census Bureau TIGER/Line Shapefiles
- Pueblo County Planning & Zoning Division
- Colorado Parks and Wildlife – Lake Pueblo State Park
Green Map creates custom-edited map images using open geographic data sources such as geoBoundaries, Natural Earth, OpenStreetMap, and government open data.
These maps are edited visual materials, not raw data files, and are provided for education, documents, presentations, and graphic reference.