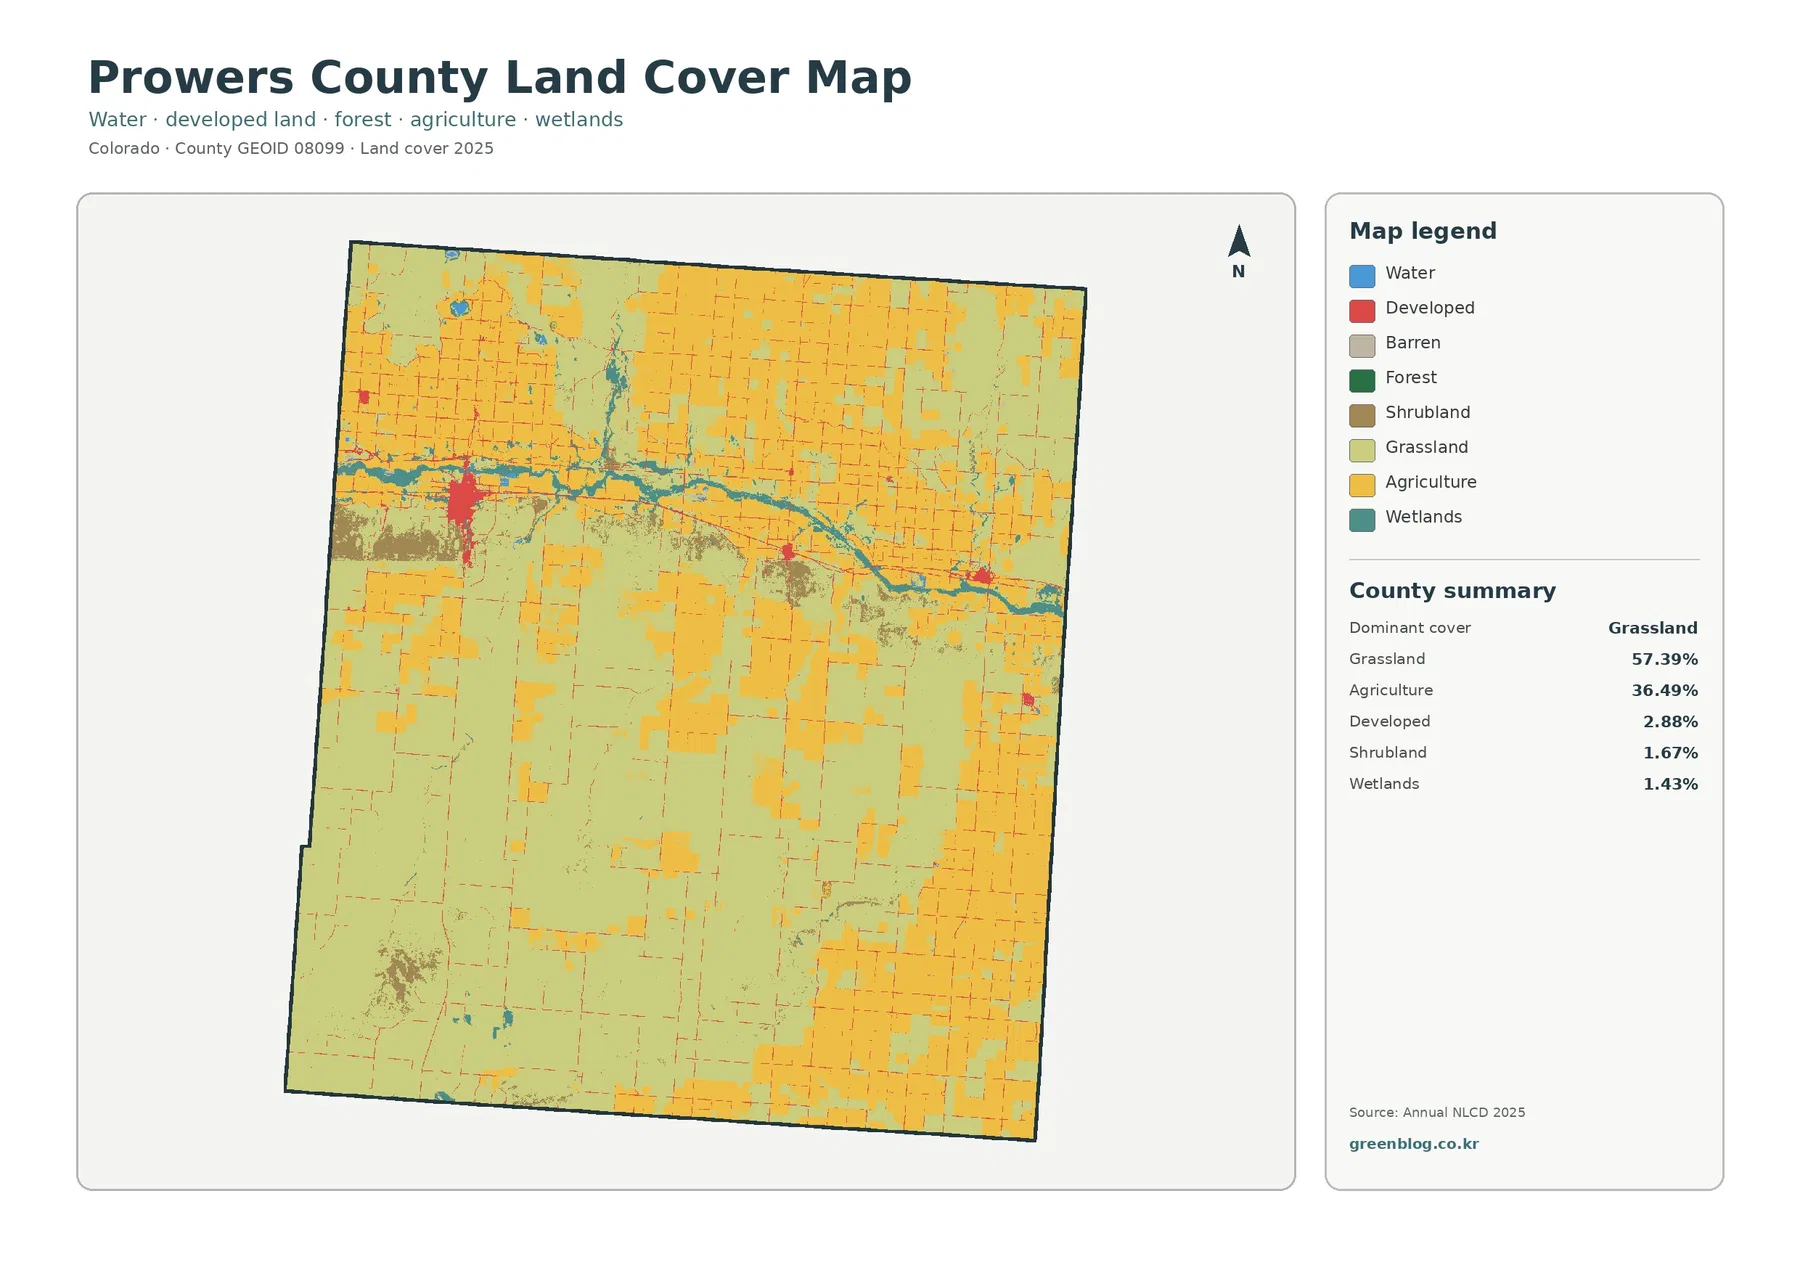
Prowers County sits on Colorado’s southeastern plains, and its 2025 land-cover summary is dominated by two classes: grassland at 57.39% and agriculture at 36.49%. The broad southern half is mostly grassland, while cropland becomes much more common toward the Arkansas River corridor in the north. Developed land is only 2.88% of the county, but Lamar forms a clear concentration that stands out against the surrounding farms and open plains.
This page brings together four views of the same county: current land cover, forest and farmland, impervious surface and developed land, and mapped class differences from 1985 to 2025. The four original JPG maps are available in one download, making it easy to compare Lamar, the river corridor, agricultural blocks, wetlands, and the extensive grassland farther south.
Table of Contents
The Arkansas River corridor is the county’s most varied strip
The northern part of the county contains the most complicated mix of colors on the general land-cover map. Agriculture is common on both sides of the Arkansas River, wetlands trace narrow sections of the corridor, and developed patches mark Lamar and smaller communities farther east. This band contrasts sharply with the larger, simpler grassland areas that extend across much of central and southern Prowers County.
Water accounts for only 0.10% of the county and wetlands for 1.43%, yet both classes are geographically important because they are concentrated rather than evenly scattered. Blue and teal cells follow the river and related low areas across the north. Their narrow shape is easy to miss in a percentage table but obvious on the map, which is why area share and location should be read together.
Prowers County’s official community background identifies the Arkansas River as one of the county’s notable physical features. The same county source lists Lamar as the county seat and largest community, along with Wiley, Granada, Hartman, and Holly. Those facts provide useful place context for the developed patches visible along the northern part of the map, without implying that the land-cover raster contains municipal boundaries or road labels.
The county summary also reports shrubland at 1.67% and forest at 0.00%. A 0.00% county value should not be read as proof that no trees exist anywhere. It means the mapped forest class rounds to 0.00% at this county scale. Small tree stands, shelterbelts, and narrow riparian vegetation can be too small or too mixed with neighboring cover types to appear as a separate dominant raster class.
Farm blocks become denser toward the north and east
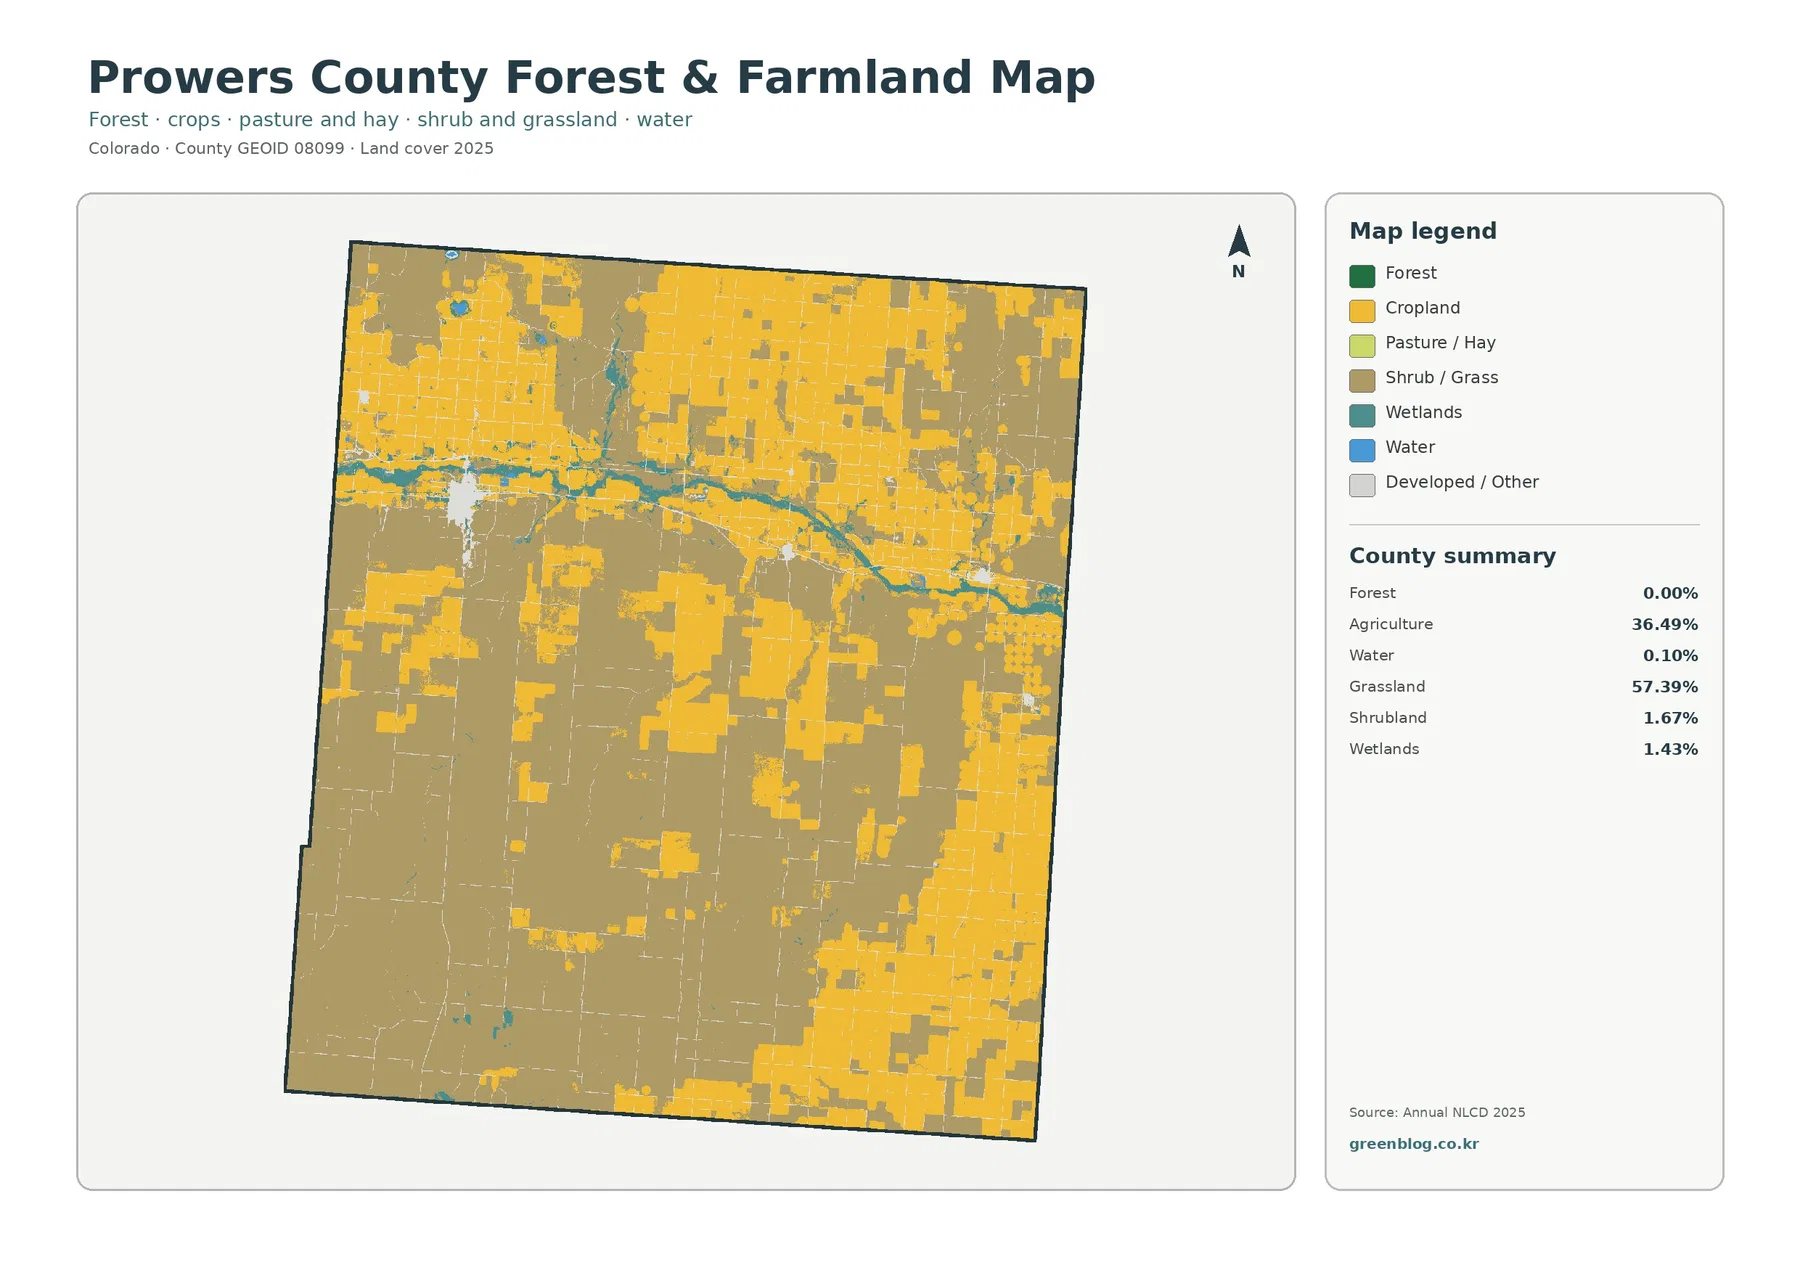
The forest-and-farmland view removes some of the smaller classes and makes the agricultural pattern easier to follow. Cropland forms broad blocks across the north and east, while shrub and grass cover occupies much of the south and southwest. The boundary between these broad land-cover groups is not a single straight line. Farm fields extend southward in scattered rectangles, and grassland reaches northward between cultivated areas.
Agriculture represents 36.49% of the 2025 land-cover classification. Prowers County’s own background material describes a long history of farming and ranching and says agriculture remains important to the local economy. The map supports the visual part of that description by showing how much of the county is classified as agricultural cover, but it does not measure farm income, ownership, livestock numbers, or the number of active operations.
Grassland remains the larger class at 57.39%. In the southern half, the agricultural blocks are more widely separated and large areas remain in grass or shrub cover. That pattern makes the map useful for comparing two different plains landscapes within one county: a more intensively cultivated northern zone and a more open southern zone. It can also be used in classroom graphics or regional presentations where the exact parcel boundaries are not required.
Land cover should not be confused with legal land use. A cell classified as agriculture does not automatically define a farm parcel, zoning category, conservation status, or ownership. Seasonal crop conditions and fallow fields can also influence how a location is classified in a particular observation year. Parcel-level questions need county land-use records or other detailed GIS layers.
Lamar creates the clearest impervious-surface cluster
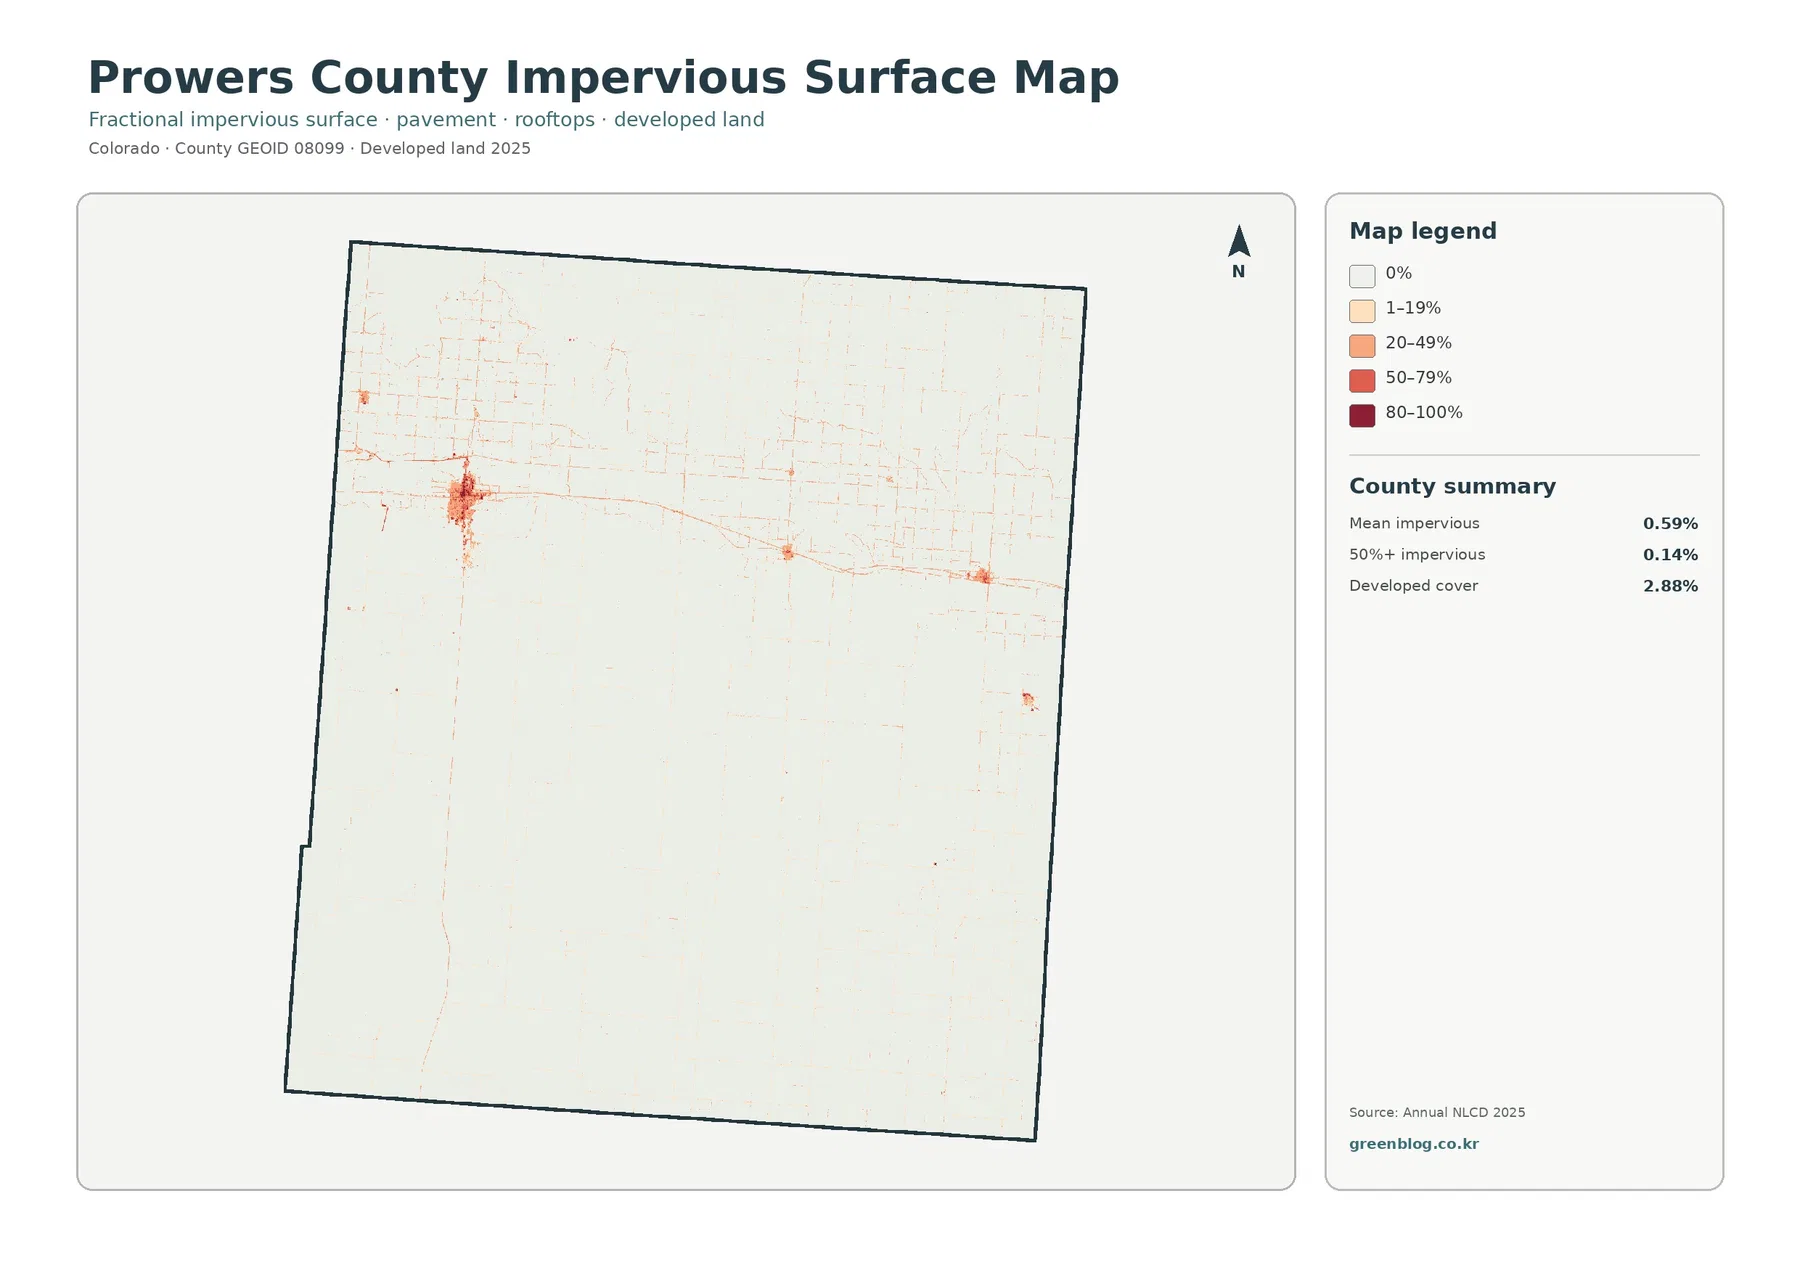
Impervious surface means hard cover such as pavement and rooftops that allows little water to soak into the ground. The countywide mean is only 0.59%, and land with at least 50% impervious cover accounts for 0.14%. Most of the county therefore appears nearly white on this map, especially across large agricultural and grassland areas.
Lamar is the exception. The strongest reds form a compact cluster in the northwestern part of the county, with thin lines and smaller concentrations extending eastward through the settled river corridor. Prowers County’s official background notes that US Highway 50 and US Highway 287 cross in the county. That helps explain the regional setting around Lamar, although the raster map by itself does not identify individual streets, highway classes, traffic volumes, or development dates.
Developed land covers 2.88%, a larger share than the 0.59% mean impervious value. Those two statistics describe different things. Developed land can include low-density areas with vegetation between buildings and roads, while the impervious layer measures the fraction of hard surface inside each raster cell. Reading both together gives a better sense of where settlement exists and where the most paved portions are concentrated.
This layer is useful for broad discussions of runoff, settlement concentration, transportation corridors, or urban-versus-rural land cover. It is not a substitute for drainage engineering, floodplain mapping, building footprints, or property data. A dark cell tells you that hard surfaces are concentrated there, not what type of building or road occupies the location.
Why the 18.98% change value needs careful interpretation
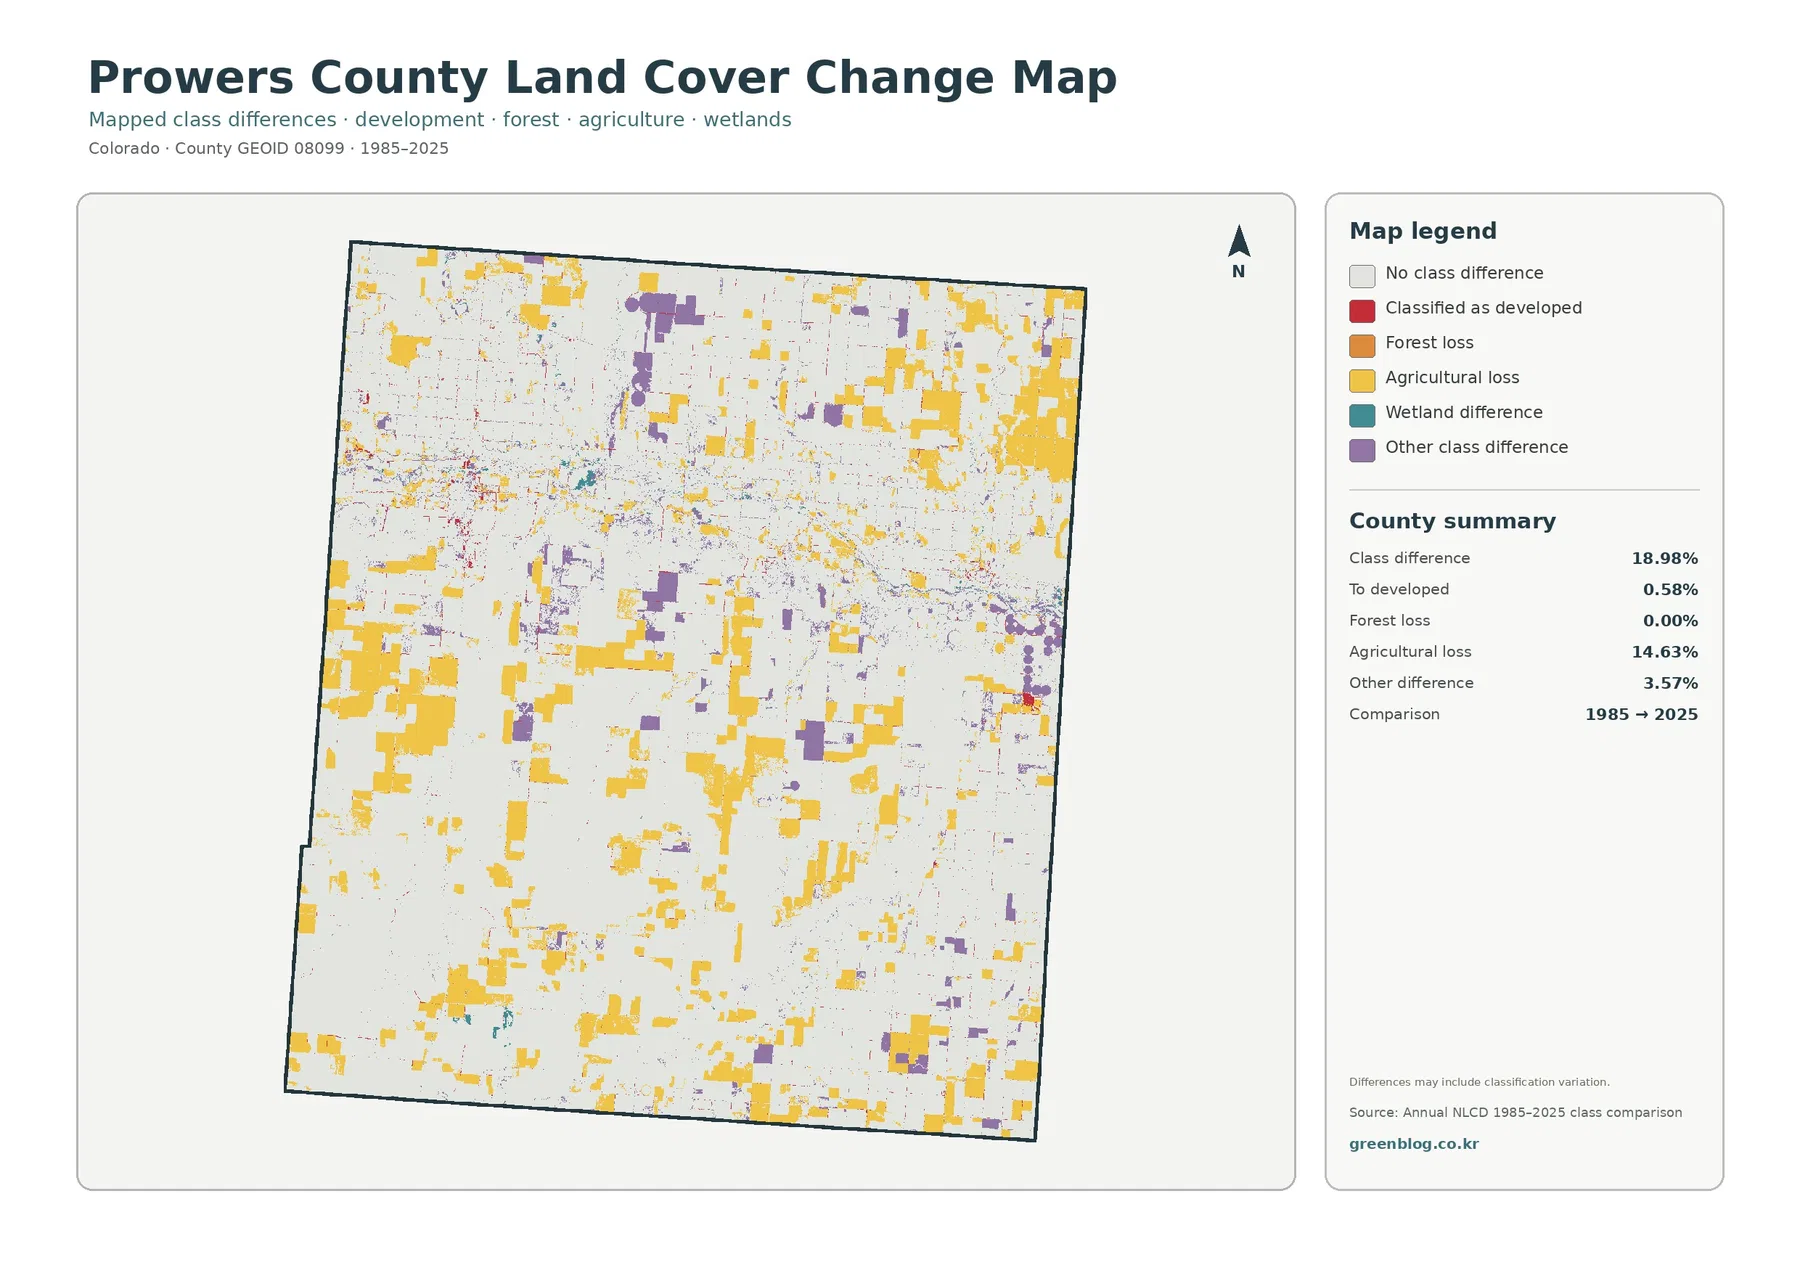
The 1985–2025 comparison reports class differences across 18.98% of the county. The largest labeled component is agricultural loss at 14.63%. The summary also lists 0.58% classified to developed land, 0.00% forest loss, and 3.57% other class difference. Yellow agricultural-loss patches appear across much of the map, while red development-related changes are smaller and more concentrated near settled areas.
That 18.98% figure is not a damage rate. It is the share of raster cells that received a different land-cover class in the two comparison years. Real changes in cultivation or settlement can contribute, but classification can also respond to crop rotation, fallow fields, drought, moisture, image timing, sensor differences, and the methods used to assign classes. The map itself notes that differences may include classification variation.
The 14.63% agricultural-loss class deserves the same caution. It does not automatically mean that 14.63% of Prowers County permanently stopped being farmland. In a dryland agricultural landscape, a field may look very different depending on whether it was actively cropped, fallow, or covered by grasses during the observation period. A stronger land-use conclusion would require intermediate Annual NLCD years, agricultural census data, aerial imagery, and local records.
The change map works best as a screening layer. It can identify places where the 1985 and 2025 classifications disagree, after which other sources can be used to ask why. Comparing its red developed-change cells with the current impervious map is especially helpful around Lamar, while large yellow patches can be compared with the current farmland map to see what class occupies those areas today.
Reading the four maps together
Each map becomes more useful when it answers a specific question. The general land-cover map is the best starting point because it shows the full mixture of grassland, agriculture, wetlands, water, developed land, and shrubland. The simplified farmland view makes the north–south contrast easier to see. The impervious layer isolates hard surfaces, and the change layer shows where the classification differs between two distant years.
- Use the 2025 general land-cover map for the countywide mix of grassland, agriculture, wetlands, water, and development.
- Use the forest-and-farmland map to emphasize farm blocks near the Arkansas River and broader grass cover farther south.
- Use the impervious-surface map to isolate Lamar and other small concentrations of pavement and rooftops.
- Use the 1985–2025 change map to locate classification differences before checking intermediate years or local records.
These maps are suitable for regional context, environmental education, watershed discussions, agricultural-landscape comparisons, and presentation graphics. Because they use generalized raster cells, they should not be treated as parcel surveys. Narrow streams, roads, shelterbelts, and small wetlands can be mixed with neighboring cover types, and conditions can change after the mapped year.
Download the four Prowers County JPG maps
The ZIP below contains the four original JPG maps described on this page. Each image is 2480×1754 pixels. They are convenient for documents, classroom materials, and presentations, but the asset manifest does not mark them as meeting the A3 high-resolution reference. For large-format printing or detailed GIS analysis, use the underlying Annual NLCD data instead.
Frequently Asked Questions
What is the dominant land cover in Prowers County?
Grassland is the largest 2025 class at 57.39%, followed by agriculture at 36.49%. Developed land is 2.88%, wetlands are 1.43%, and mapped forest rounds to 0.00%.
Which map is best for comparing Lamar with the Arkansas River corridor?
Use the impervious surface map to see hard-surface concentration in Lamar. Use the general land cover and forest-and-farmland maps to compare that development with agriculture, wetlands, water, and grassland along the Arkansas River corridor.
Does the 18.98% class difference mean 18.98% of the county was damaged?
No. It is the share of raster cells assigned to different land-cover classes in 1985 and 2025. The 14.63% agricultural-loss category also should not be treated as a direct permanent farmland-loss estimate without additional years and local data.
Map File Information
The ZIP contains four JPG maps: 2025 land cover, forest and farmland, impervious surface and developed land, and the 1985–2025 class-difference map.
- Included Files: Use only the versions confirmed in the article and supplied images
- File Type: Use the confirmed download contents
- Intended Use: Printing, education, presentations, and map-based projects
Related Maps
- Adams County Colorado Land Cover Map
- Alamosa County Colorado Land Cover Map
- Arapahoe County Colorado Land Cover Map
Sources and References
Percentages and mapped change values come from the supplied Annual NLCD-based Prowers County map assets. County-specific context for the Arkansas River, agriculture, communities, and major transportation corridors comes from official Prowers County material. Land cover describes the physical surface and should not be substituted for zoning, ownership, legal land use, or parcel boundaries.
- MRLC Annual NLCD Data
- USGS Annual NLCD Land Cover Classification
- U.S. Census Bureau TIGER/Line Shapefiles
- Prowers County Official Website
- Prowers County Community Background and Agriculture
Green Map creates custom-edited map images using open geographic data sources such as geoBoundaries, Natural Earth, OpenStreetMap, and government open data.
These maps are edited visual materials, not raw data files, and are provided for education, documents, presentations, and graphic reference.