Montrose County sits on Colorado’s Western Slope, but its land cover is not dominated by one simple landscape. In the 2025 summary, forest accounts for 45.14% and shrubland for 43.85%, leaving much smaller shares for agriculture at 6.42%, developed land at 3.08%, wetlands at 0.78%, grassland at 0.56%, and water at 0.07%. The maps make that contrast easy to see: broad uplands are mostly natural cover, while farming and built surfaces concentrate in a few valleys and communities.
This page brings together four views of the same county: current land cover, forest and farmland, impervious surface and developed land, and mapped class differences from 1985 to 2025. The WebP images are intended for quick viewing on the page. The four original JPG maps are available together in one download below for classroom work, reports, presentations, and side-by-side county comparisons.
Table of Contents
Montrose County is best understood as several landscapes rather than one continuous pattern
The county’s official planning material describes a mix of mountainous terrain, valleys, and the Uncompahgre Plateau. It also separates the Montrose–Olathe side of the county from the rural West End around Nucla and Naturita. That framework is useful when looking at the maps because the largest farm and development cluster lies in the eastern valley, while a smaller cluster appears farther west. Between and around those settled areas, forest and shrubland cover most of the county.
The county’s general land-cover map emphasizes this split without showing roads, parcel lines, or planning districts. Forest occupies large central and southern uplands, while shrubland is extensive in drier western areas and around parts of the eastern section. Agriculture and development form narrower patches instead of broad countywide blankets. This pattern explains why the countywide percentages can look overwhelmingly natural even though the Montrose area itself contains a visibly stronger human footprint.
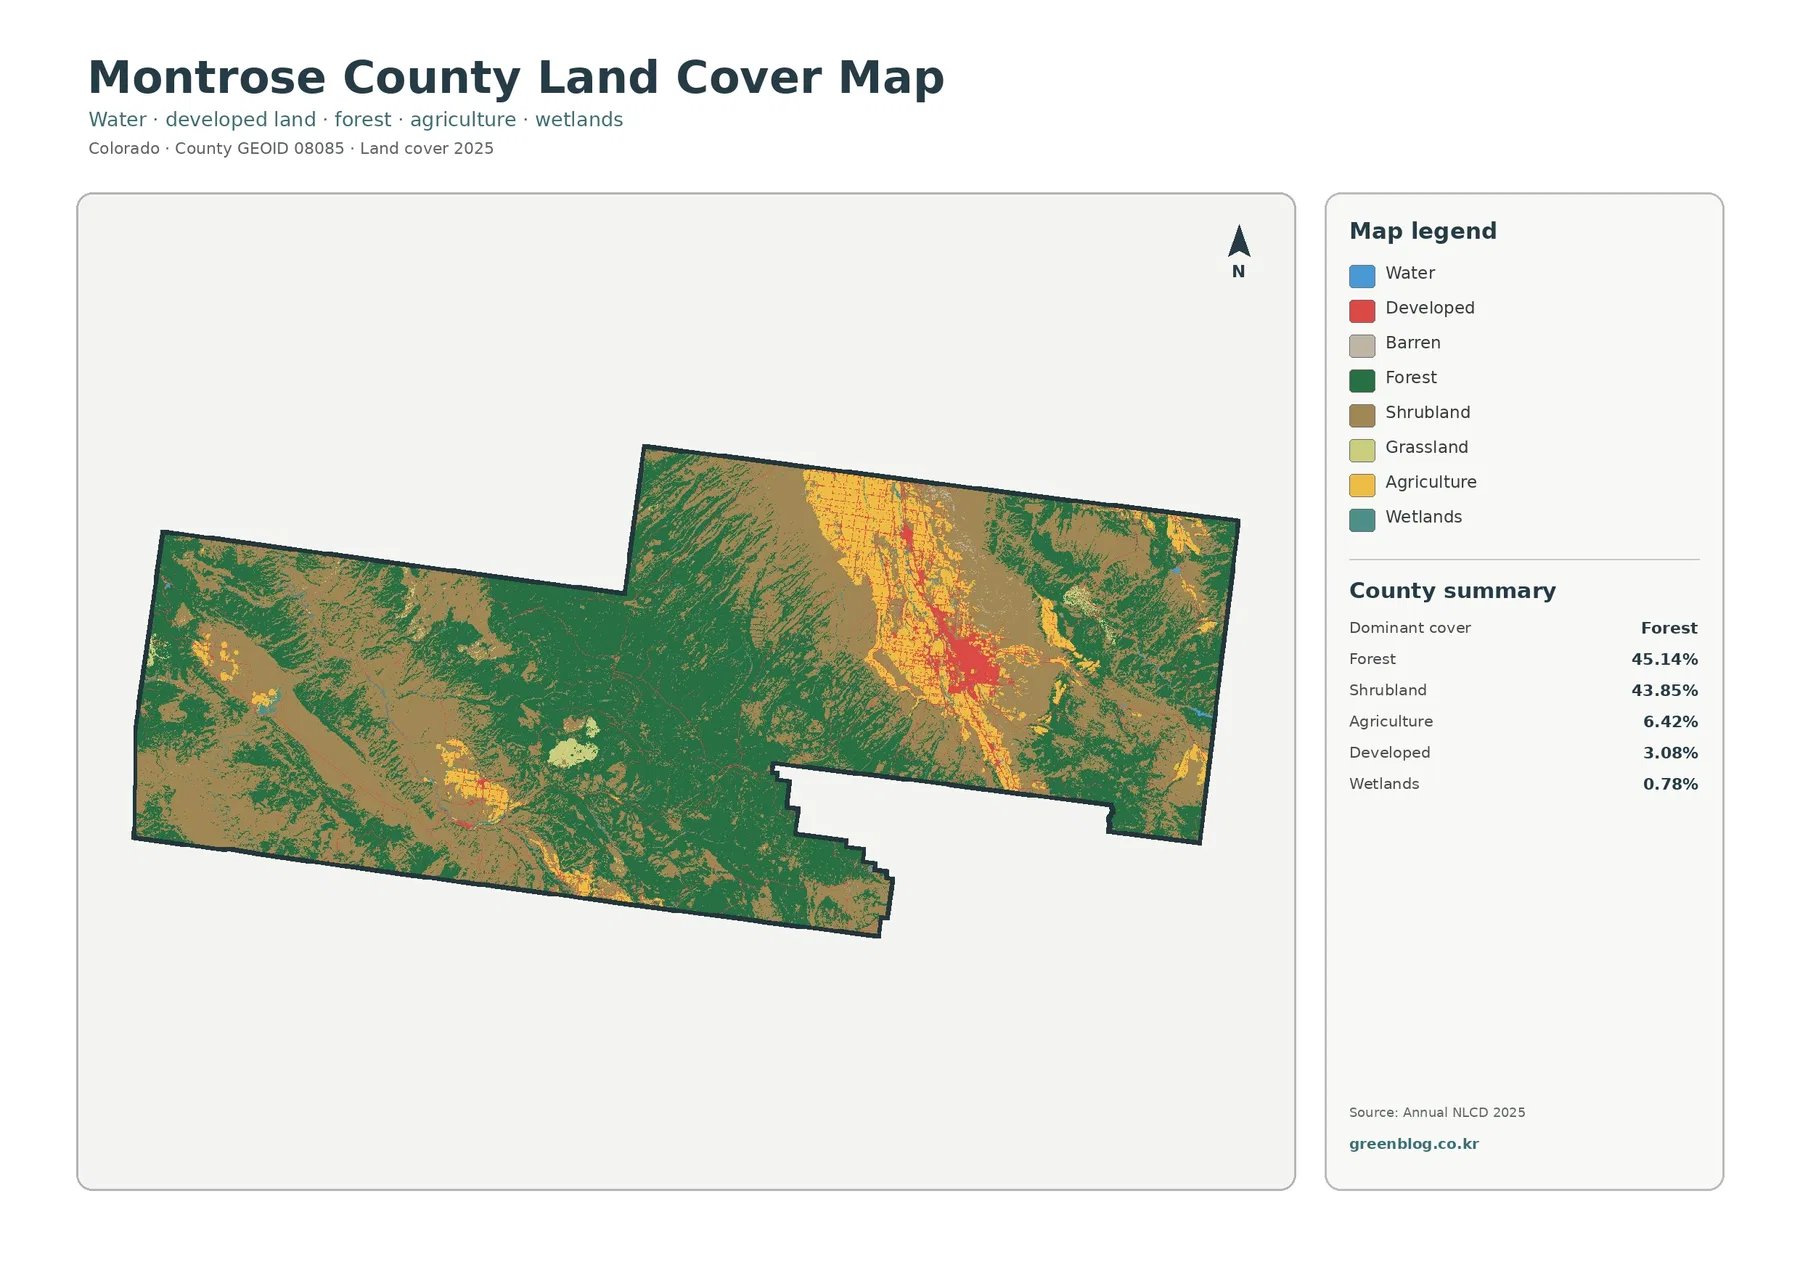
Agriculture represents 6.42% of the mapped county. Its strongest concentration is in the eastern valley where the City of Montrose and the Town of Olathe are located. The yellow agricultural pattern follows a relatively narrow north–south zone, rather than spreading evenly across the surrounding uplands. A second, smaller agricultural area appears in the West End near communities such as Nucla and Naturita.
Developed land is only 3.08% of the county, yet the main urban concentration is visually obvious. The largest red patch surrounds Montrose, with smaller developed marks extending along nearby transportation and settlement corridors. The West End contains another compact cluster, but it is much smaller than the Montrose area. This is a good example of why a countywide percentage should be read together with the map itself: a small overall share can still be locally important.
Water and wetlands occupy relatively little area in the county summary. Water is 0.07% and wetlands are 0.78%, so these classes generally appear as narrow or scattered features rather than broad zones. Montrose County’s planning documents identify the Uncompahgre River and the West End river valleys as important geographic settings, but this map is not a named hydrography map. For river names, channel detail, or legal wetland boundaries, a dedicated water dataset should be used.
The forest-and-farmland view clarifies where agriculture interrupts the natural cover
The forest and farmland map reduces the number of competing colors and makes the agricultural pattern easier to follow. Forest remains the dominant green class at 45.14%, while shrub and grass cover form a broad background across many drier areas. Agriculture at 6.42% becomes especially noticeable in the Uncompahgre Valley because it sits next to large blocks of forest and shrub cover.
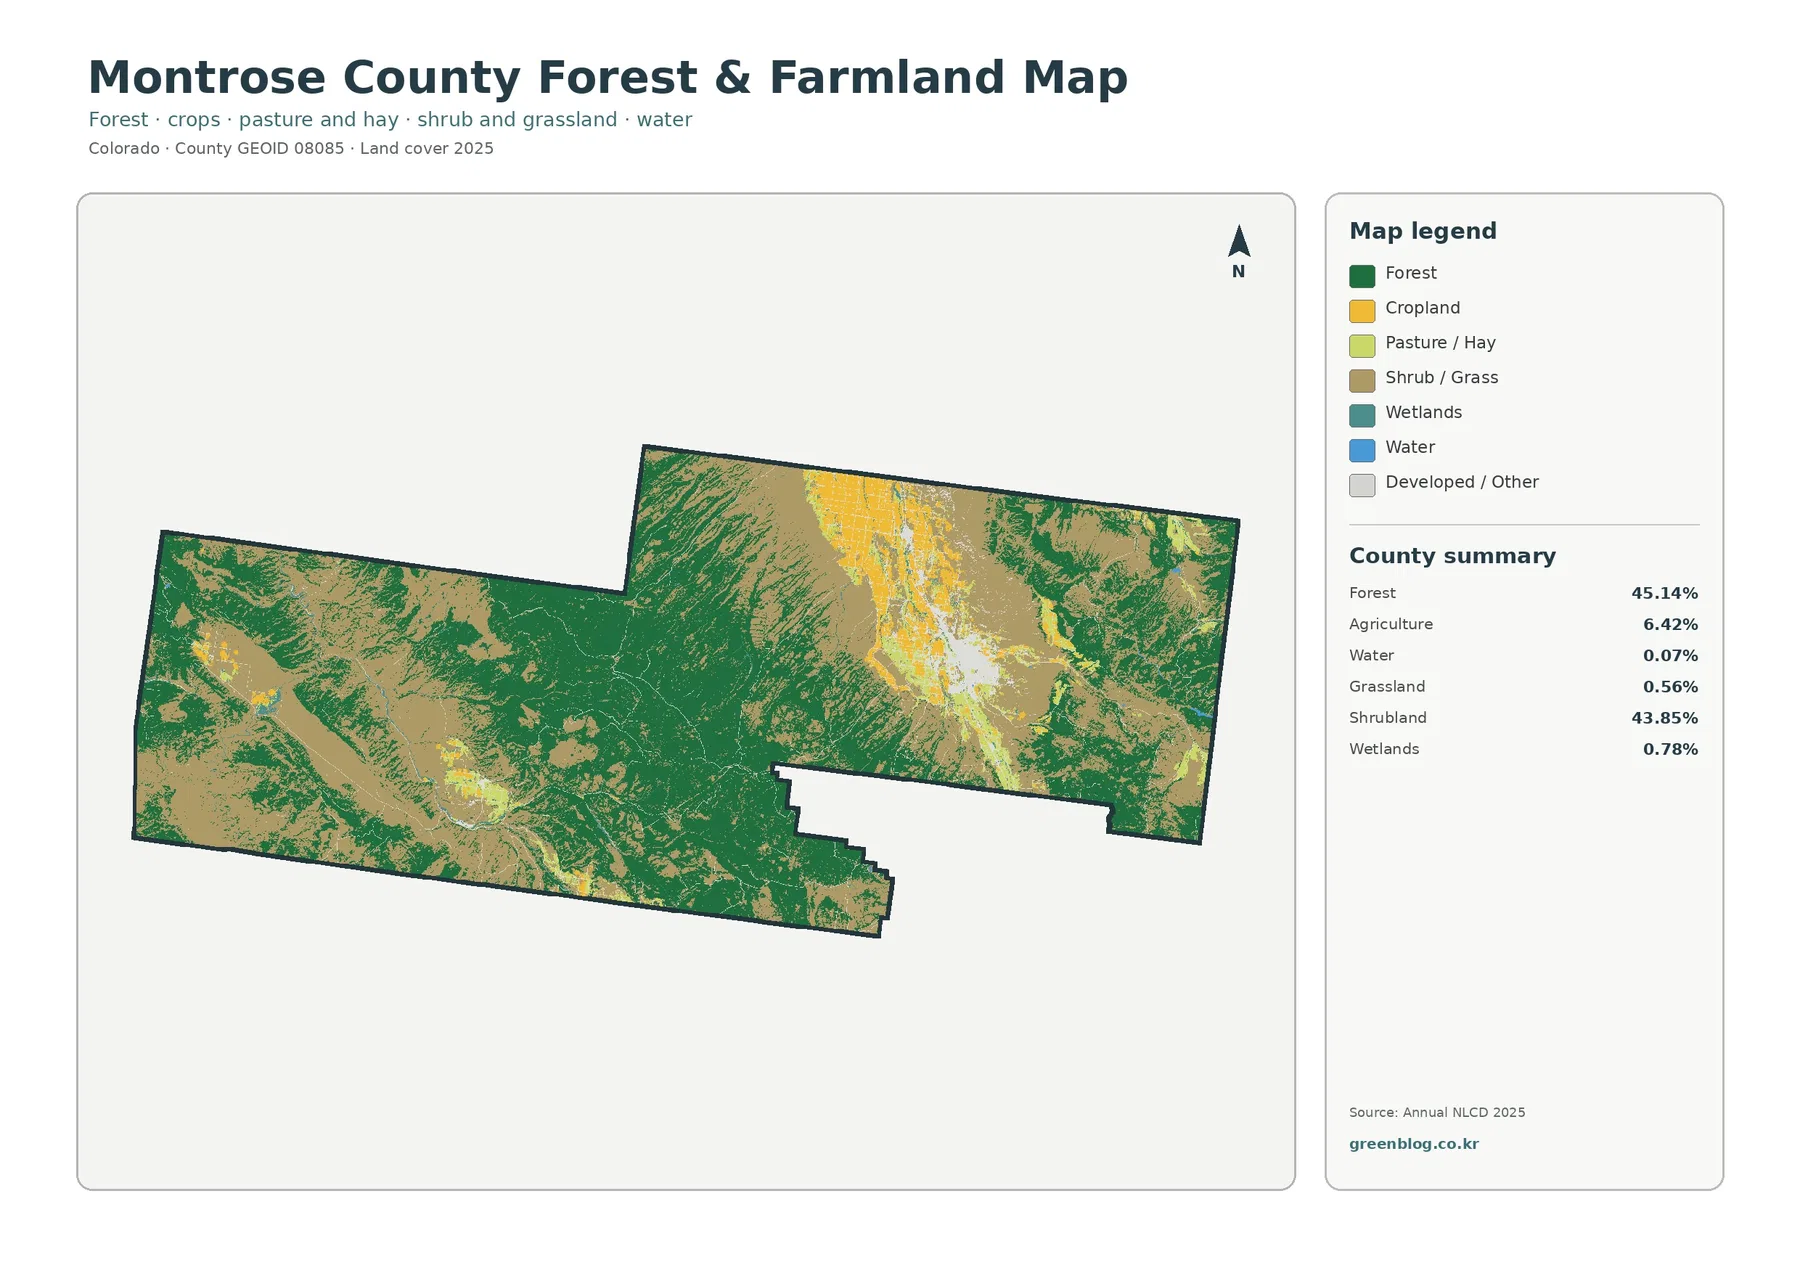
Montrose County’s official Master Plan treats agriculture as one of the county’s important long-term resources. That local context helps explain why the eastern farm belt matters even though it covers far less area than forest or shrubland. The map is especially useful for seeing the difference between a broad natural landscape and the narrower valley floors where farming is more concentrated.
The West End has a different arrangement. County planning documents describe Nucla, Naturita, Bedrock, Redvale, and Paradox as part of a rural area shaped by agricultural and mining traditions. On the map, farm cover is present there but does not form a single extensive belt comparable with the eastern valley. Natural cover remains much more prominent around the smaller agricultural patches.
Mapped agriculture should not be confused with every land-based agricultural activity. Grazing can occur on shrubland or grassland without those cells being classified as agriculture. Likewise, the yellow agricultural class does not provide farm ownership, crop type, irrigation rights, or field boundaries. The 6.42% figure is a land-cover classification, not a measure of the county’s total agricultural economy.
Impervious surface highlights the contrast between Montrose and the rural parts of the county
Impervious surface means pavement, rooftops, parking areas, and other hard surfaces that do not readily absorb water. Montrose County’s mean impervious value is 0.90%, and 0.40% of the county is mapped at 50% impervious or greater. These values are different from the 3.08% developed-land share because a developed class can still contain trees, lawns, soil, and other permeable surfaces.
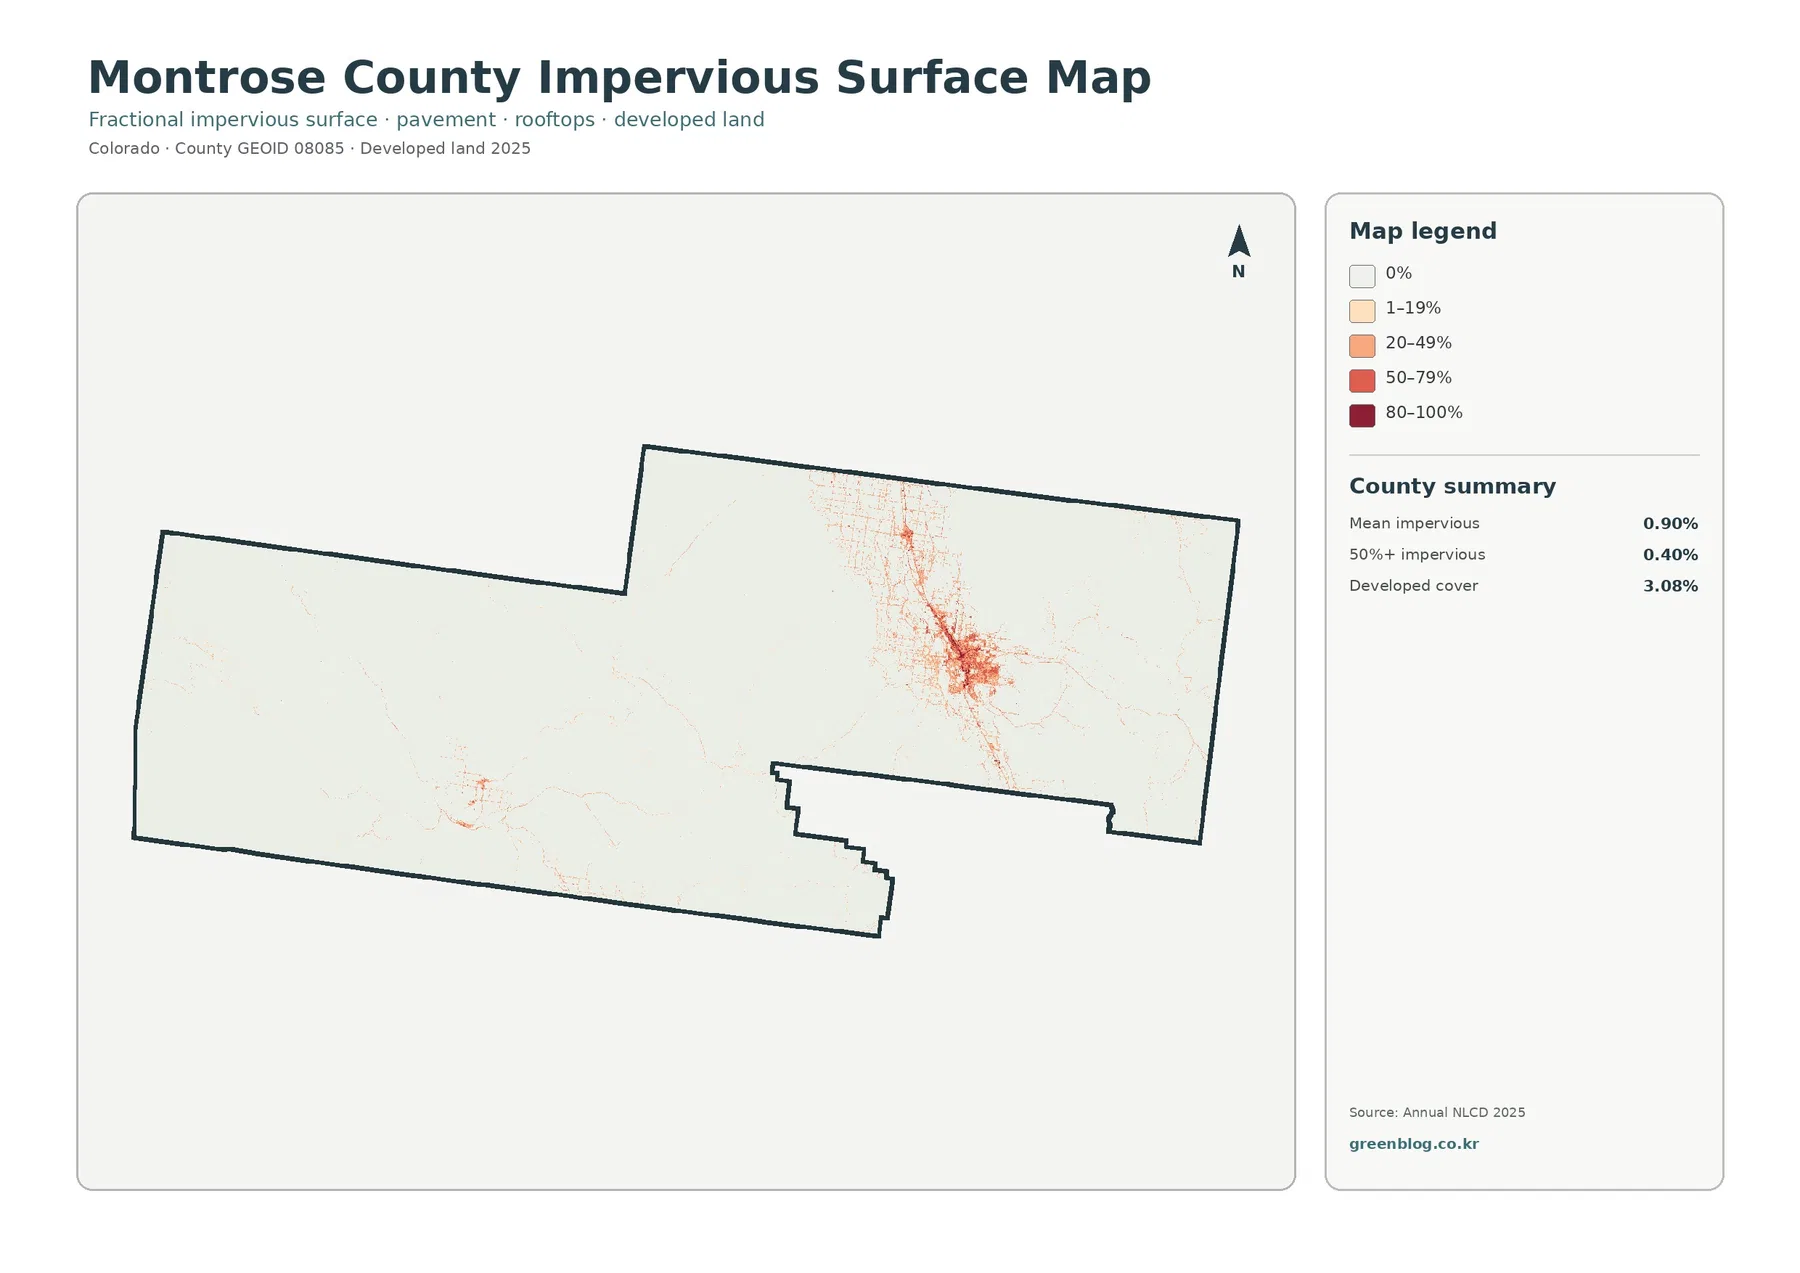
The Montrose urban area stands out immediately on this map. Higher values form a compact cluster, while thin lines extend outward through the surrounding valley. Those lines are consistent with transportation corridors, but the preview does not label individual roads, so the map should not be used to identify a specific street or facility. Olathe and other smaller settled areas appear much lighter and more compact.
A smaller impervious cluster is also visible in the West End. Its presence matters because a county average can hide strong local differences. Most of Montrose County has little or no hard surface, yet a few settled areas contain substantially more pavement and buildings than the surrounding landscape. For stormwater education or broad development comparisons, that contrast is more informative than the countywide mean alone.
This layer is not a zoning or buildability map. A low impervious value does not mean that land is available for development, and a high value does not reveal a parcel’s legal use. Montrose County publishes separate GIS layers for parcels, roads, zoning, municipal boundaries, and land ownership. Those administrative datasets should be used when a question depends on legal boundaries rather than physical surface cover.
The 1985–2025 map marks class differences, not a single story of gain or loss
The long-term comparison shows where the mapped class in 2025 differs from the mapped class in 1985. Across Montrose County, 10.39% of cells fall into a different class. The summary breaks out 0.99% classified as developed, 4.04% in the forest-loss category, 0.88% in the agricultural-loss category, and 4.40% in other class differences. Most of the county remains in the no-class-difference background.
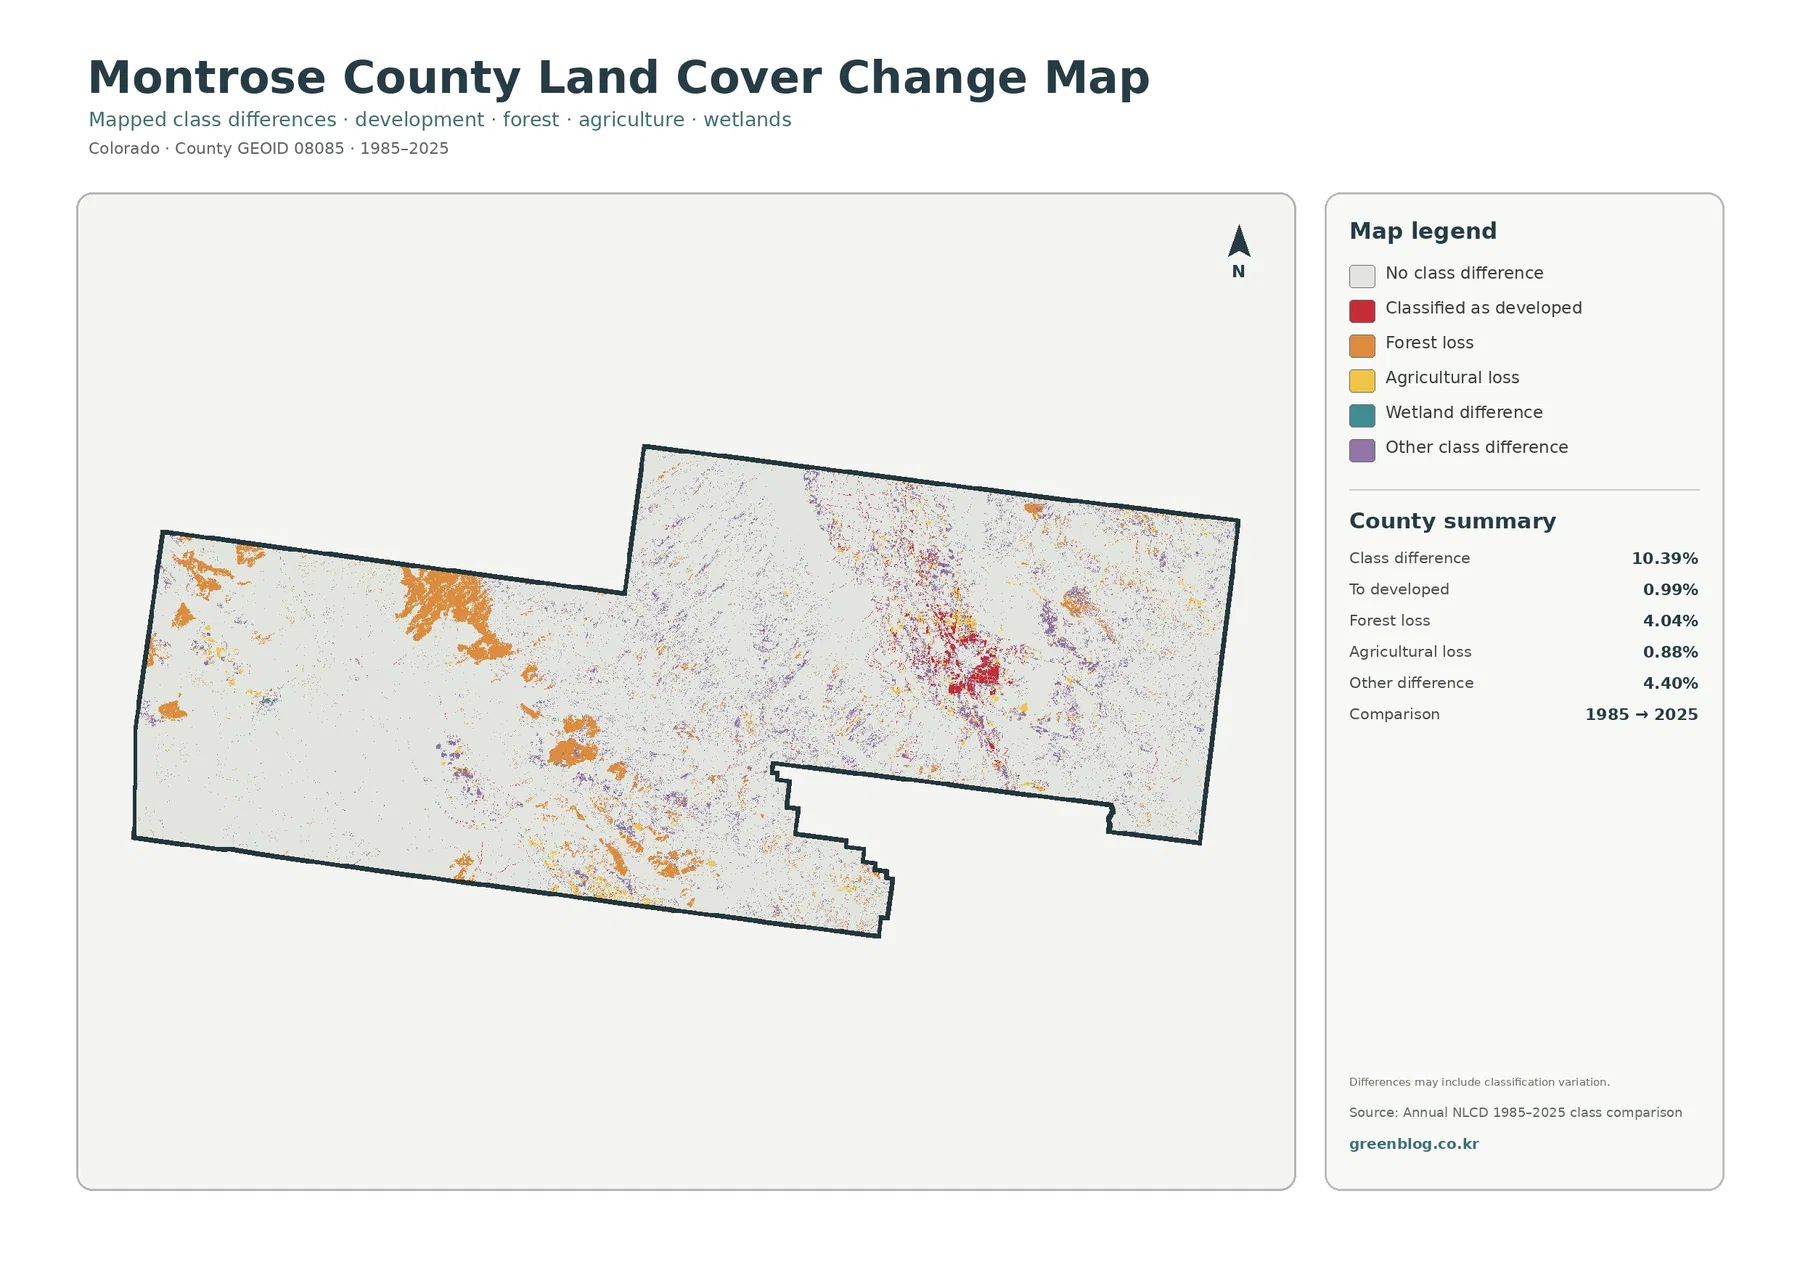
Red change cells are most concentrated around Montrose, which is also where the 2025 impervious map shows the county’s strongest built-surface cluster. Smaller red areas occur elsewhere, including the West End. Orange forest-loss-class cells are more dispersed and appear in several forested or formerly forest-classified areas rather than in one continuous block.
Those labels need cautious interpretation. A cell in the forest-loss category does not identify wildfire, logging, insects, or any other cause. An agricultural-loss cell does not by itself show that farming stopped. The map records a difference between two classifications, and the cause would need to be investigated with intermediate imagery, fire history, agricultural records, permits, or field information.
Classification variation can also contribute to the 10.39% figure. A 30-meter raster cell may contain several cover types, and seasonal or year-to-year vegetation conditions can influence which class best represents the cell. For that reason, the total class-difference percentage should not be described as the percentage of the county that was damaged or permanently converted.
The eastern valley and the West End offer two useful comparison areas
For a practical reading exercise, start with the eastern part of the county. The general map shows agriculture and development concentrated in the valley, the forest-and-farmland map simplifies the farm belt, and the impervious layer isolates the Montrose built surface. The change map then shows where some cells around that same area received a different class in 2025 than in 1985.
The West End tells a different story. Natural shrub and forest cover dominate a much larger share of the visible landscape around the smaller communities, while farm and developed patches are more limited. County planning documents describe the West End as rural and closely tied to agriculture, mining traditions, public lands, and scenic landscapes. The land-cover maps do not show those economic activities directly, but they provide the physical-cover background for understanding the area.
Between these settled areas, the Uncompahgre Plateau and other uplands contain extensive natural cover. The county’s Master Plan notes forests, wildlife habitat, grazing land, waterways, and other natural resources across Montrose County. Seeing those broad green and brown areas as active landscapes rather than empty space is important when using the maps for environmental education or regional planning context.
Use the four maps together, but keep their questions separate
The general land-cover map is the best overview because it places forest, shrubland, agriculture, development, wetlands, water, and other classes on the same page. It is useful for answering a broad question such as where the county shifts from large natural-cover areas to more intensively used valleys. The forest-and-farmland version is better when the main comparison is agriculture versus wooded or open natural cover.
For questions about hard surfaces, the impervious map should come next. It separates the Montrose urban cluster from the much lighter rural background and helps illustrate why developed land and impervious surface are related but not identical measurements. The change map should usually be read last, after the current cover is understood, because its colors represent differences between classifications rather than current land-cover classes.
In a classroom, the maps can be used to compare the same location four times and ask different questions: What covers the ground now? Is the area primarily forest, farmland, or open shrub and grass? How much hard surface is present? Did the 1985 and 2025 classifications match? Keeping those questions separate prevents the common mistake of treating every map as if it measured the same thing.
Thirty-meter raster cells are useful for county patterns, not parcel decisions
Annual NLCD land cover is a raster dataset. In simple terms, the landscape is divided into grid cells and each cell receives a representative class. Landsat-based land-cover products generally use 30-meter cells, which is appropriate for regional patterns but much coarser than a survey, parcel map, or building footprint.
Mixed pixels are unavoidable at this scale. A single cell near a road, farm edge, stream, or subdivision may contain vegetation, soil, pavement, and structures together. The final class is therefore a generalized representation of what dominates or best matches the classification rules. Narrow streams, small wetlands, minor roads, and irregular field edges may look wider, narrower, or less precise than they do on the ground.
The year also matters. The current maps represent the 2025 classification, so later construction, vegetation recovery, fire effects, crop changes, or water-level changes may not be included. The change map compares two endpoints, 1985 and 2025, and does not tell the reader exactly when a difference occurred. For a time-sensitive or parcel-specific decision, newer aerial imagery and county GIS should be consulted.
Download the four original JPG maps
The download ZIP contains four original JPG files for Montrose County: the 2025 land-cover map, the forest-and-farmland map, the impervious-surface and developed-land map, and the 1985–2025 class-difference map. Because all four use the same county extent, they are convenient for side-by-side display in reports, lessons, presentations, or county comparison projects.
The asset manifest lists each JPG at 2480×1754 pixels and marks the package as not meeting its A3 high-resolution reference. If a large printed poster is the goal, check the legend and text at the intended print size before relying on it. For screen viewing and ordinary document use, the files provide a consistent set of four map views.
Frequently Asked Questions
What is the dominant land cover in Montrose County?
Forest is the largest 2025 class at 45.14%, followed closely by shrubland at 43.85%. Together they account for most of the county. Agriculture and developed land occupy much smaller shares and are concentrated mainly in the eastern valley and in smaller West End areas.
Which map is best for seeing development around the City of Montrose?
Use the forest and farmland map for agricultural areas and the impervious surface map for developed areas around Montrose.
Does the 10.39% class difference mean 10.39% of the county was damaged?
No. It means 10.39% of mapped cells received a different land-cover class in 2025 than in 1985. Real land change may be part of that total, but mixed pixels, vegetation conditions, imagery, and classification differences can also contribute. Additional records are needed to identify the cause of a specific change.
Map File Information
Download four original JPG maps for Montrose County, Colorado: 2025 land cover, forest and farmland, impervious surface and developed land, and 1985–2025 land-cover class differences.
- Included Files: Use only the versions confirmed in the article and supplied images
- File Type: Use the confirmed download contents
- Intended Use: Printing, education, presentations, and map-based projects
Related Maps
- Adams County Colorado Land Cover Map
- Alamosa County Colorado Land Cover Map
- Arapahoe County Colorado Land Cover Map
Sources and References
These sources were used to check the land-cover classification framework, county boundary, and Montrose County’s geographic, agricultural, ecological, and planning context.
- MRLC Annual NLCD Data – annual land-cover data and related products
- USGS Annual NLCD Land Cover Classification – land-cover class definitions and dataset background
- U.S. Census Bureau TIGER/Line Shapefiles – county boundary data
- Montrose County Master Plan – valleys, planning areas, agriculture, land use, and natural-resource context
- Montrose County Ecological Services – forest health, agriculture, wildlife habitat, riparian systems, and landscape resilience
- Montrose County Downloadable GIS Data – county roads, parcels, zoning, ownership, and municipal boundary datasets
Green Map creates custom-edited map images using open geographic data sources such as geoBoundaries, Natural Earth, OpenStreetMap, and government open data.
These maps are edited visual materials, not raw data files, and are provided for education, documents, presentations, and graphic reference.