The Jackson County Colorado Land Cover Map is shaped by North Park, a broad mountain basin where shrubland and wet ground occupy the center while forest wraps much of the outer terrain. In 2025, shrubland covers 46.42%, forest 31.56%, and wetlands 12.31%.
This page includes four views: current land cover, forest and farmland, impervious surfaces, and class differences from 1985 to 2025. The four original JPG maps are available together in one ZIP for printing, presentations, classroom use, and closer inspection.
Table of Contents
Arapaho National Wildlife Refuge explains why wetlands matter so much in North Park
Wetlands make up 12.31% of Jackson County, a large enough share to become one of the strongest visual features on the current map. Blue-green wetland cover branches through the central basin and expands into broader patches along several drainage areas.
The U.S. Fish and Wildlife Service describes Arapaho National Wildlife Refuge south of Walden as part of the high intermountain basin called North Park. Its habitats include sagebrush steppe uplands, grassland meadows, willow riparian areas, and wetlands. That mix closely matches the broad types visible across the basin portion of the supplied map.
Slow, meandering streams cross the basin floor and eventually combine to form the headwaters of the North Platte River, according to the refuge’s official description. Floodplains contain irrigated meadow, while higher rises are characterized by sagebrush. This helps readers understand why wetland, agricultural, grass, and shrub classes occur next to one another through central Jackson County.
The refuge boundary itself is not drawn on the NLCD image. Its official habitat description should therefore be used as regional context rather than proof that a particular pixel falls inside the refuge.
Walden stands out because almost the entire county has very little impervious surface
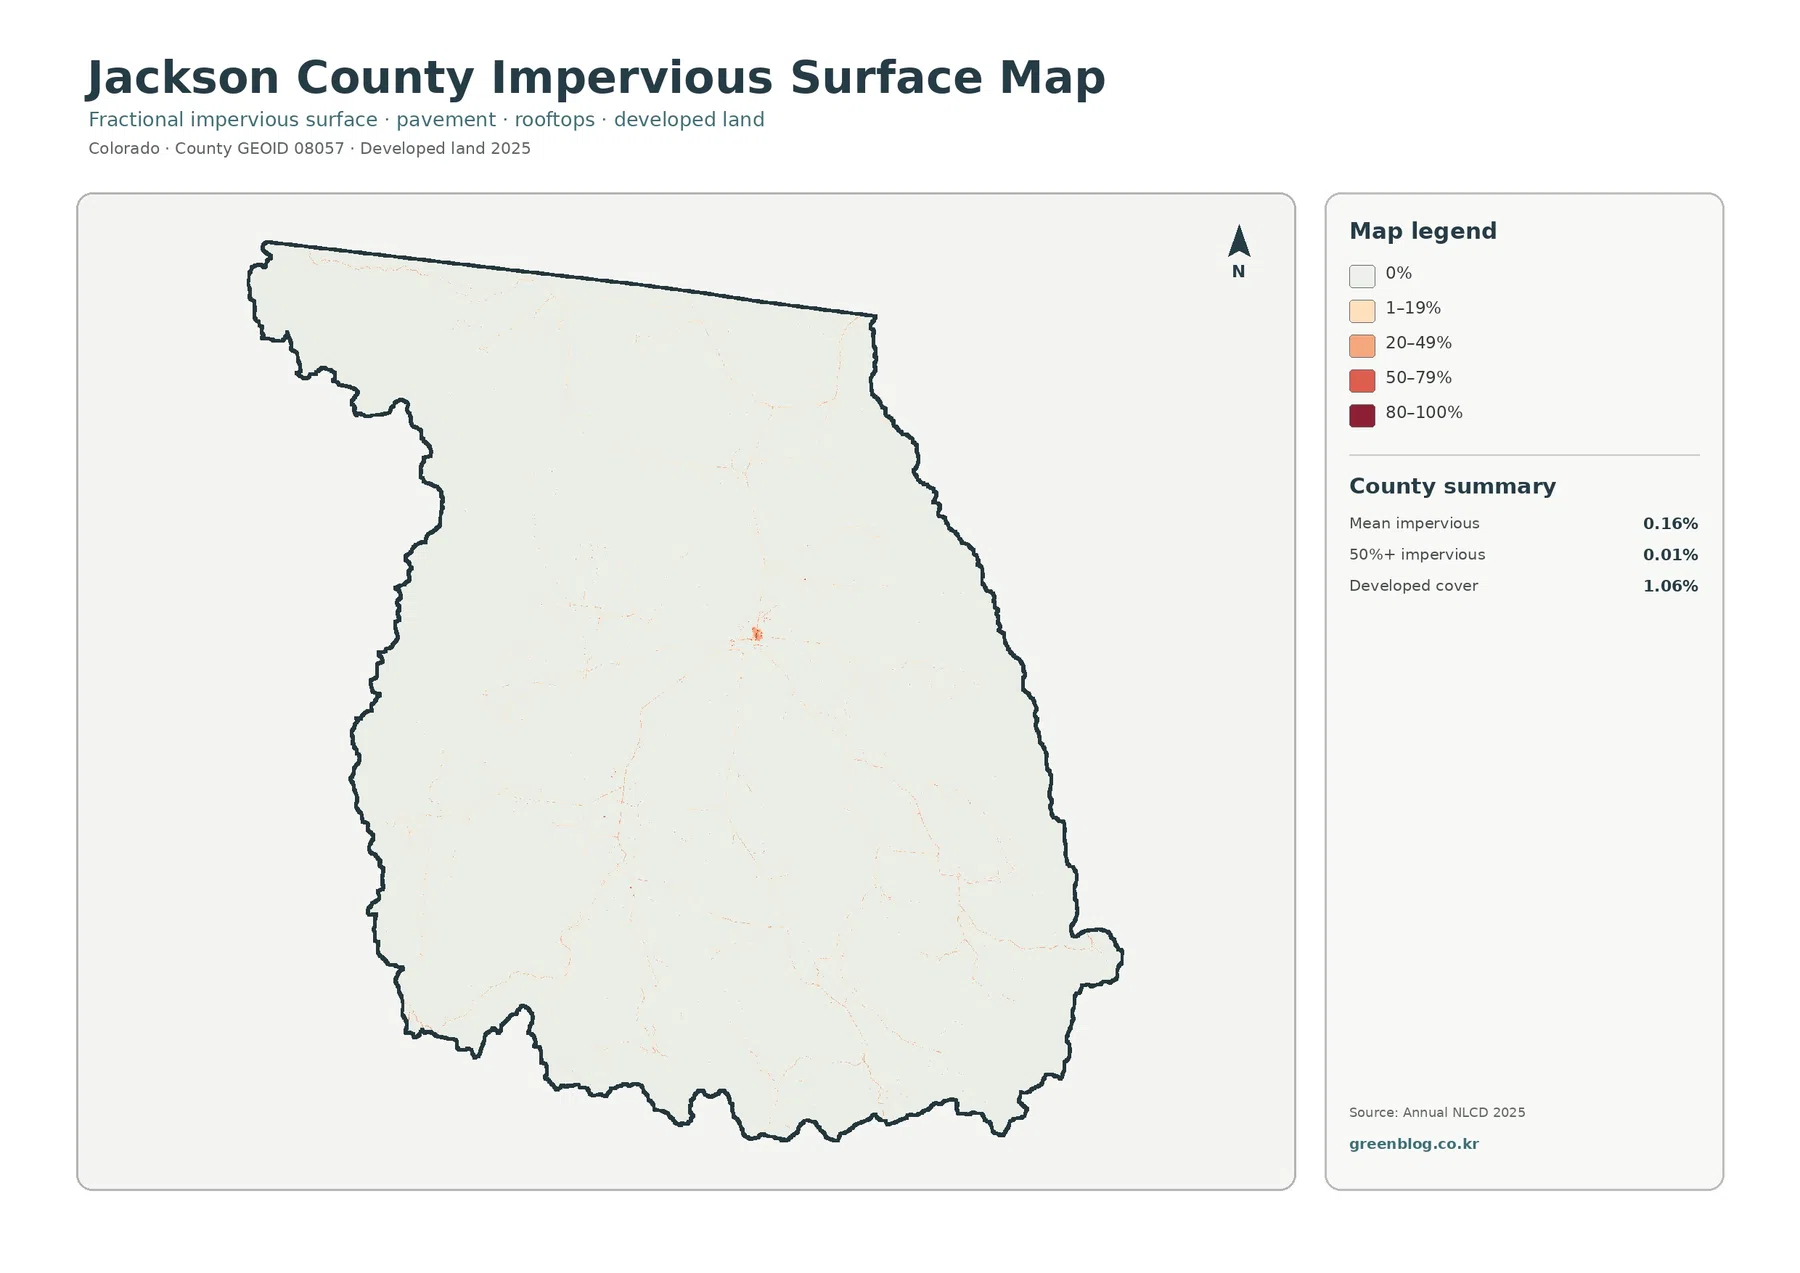
Mean imperviousness is only 0.16%, and cells mapped at 50% or greater imperviousness account for just 0.01% of the county. Developed land cover is also small at 1.06%. Most of the map is nearly white because natural surfaces dominate at county scale.
A small orange-red cluster near the central basin is the clearest built-surface concentration. The official Town of Walden website provides the town’s location, while the Arapaho refuge is documented immediately south of Walden. Those references make Walden a practical anchor for interpreting this isolated central cluster.
Faint linear traces extend away from the main cluster, but high imperviousness remains rare. Roads and scattered development occupy a tiny share of a landscape dominated by shrubland, forest, wetlands, and grass.
Developed cover and imperviousness are related but different measurements. Land cover assigns a categorical class to each cell. Fractional imperviousness estimates how much of the cell is actually covered by pavement, rooftops, or another hard surface.
The 2025 map places sagebrush-like shrub cover between forested mountain rims
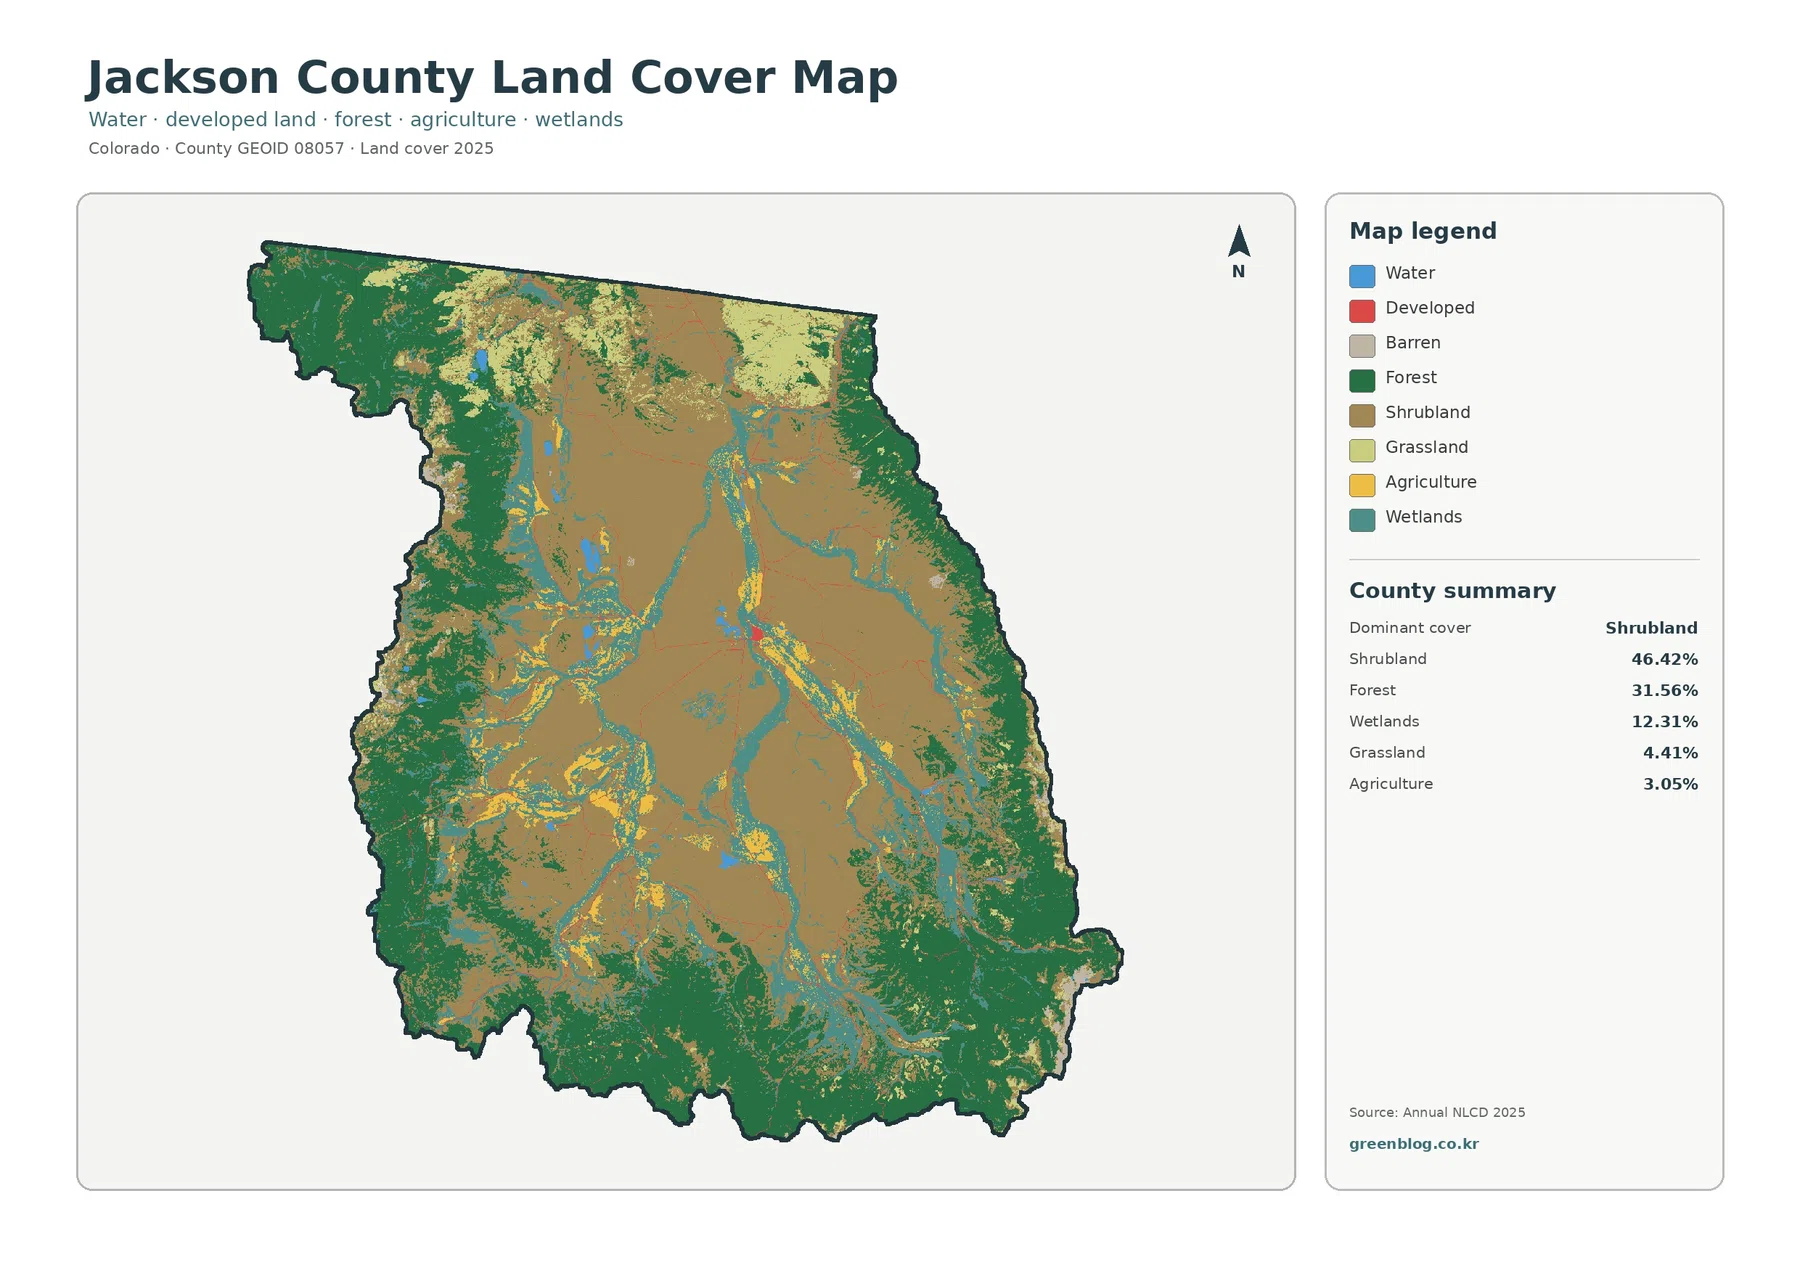
Shrubland is the dominant 2025 class at 46.42%. It fills much of the broad central and northern basin in tan, while dark-green forest becomes more extensive along the west, south, and east margins. The pattern creates a clear basin-versus-mountain contrast.
Forest covers 31.56%, making it the second-largest class. Large forest blocks appear along several outer mountain areas rather than across the basin floor. The western and southern edges are especially green, and the eastern rim also carries substantial forest.
Grassland accounts for 4.41%, and agriculture for 3.05%. Both are much smaller than shrubland, yet they appear repeatedly within the open basin. Yellow agricultural patches are especially noticeable beside wetland corridors and other open cover instead of deep inside the forested rims.
Open water covers 0.44%. Small blue lakes and ponds can be seen in several basin and mountain locations, but their countywide share is low. Narrow waterways may be represented partly by wetland or other classes because the raster cells generalize mixed surfaces.
The forest-and-farmland view makes North Park’s basin edge easier to explain
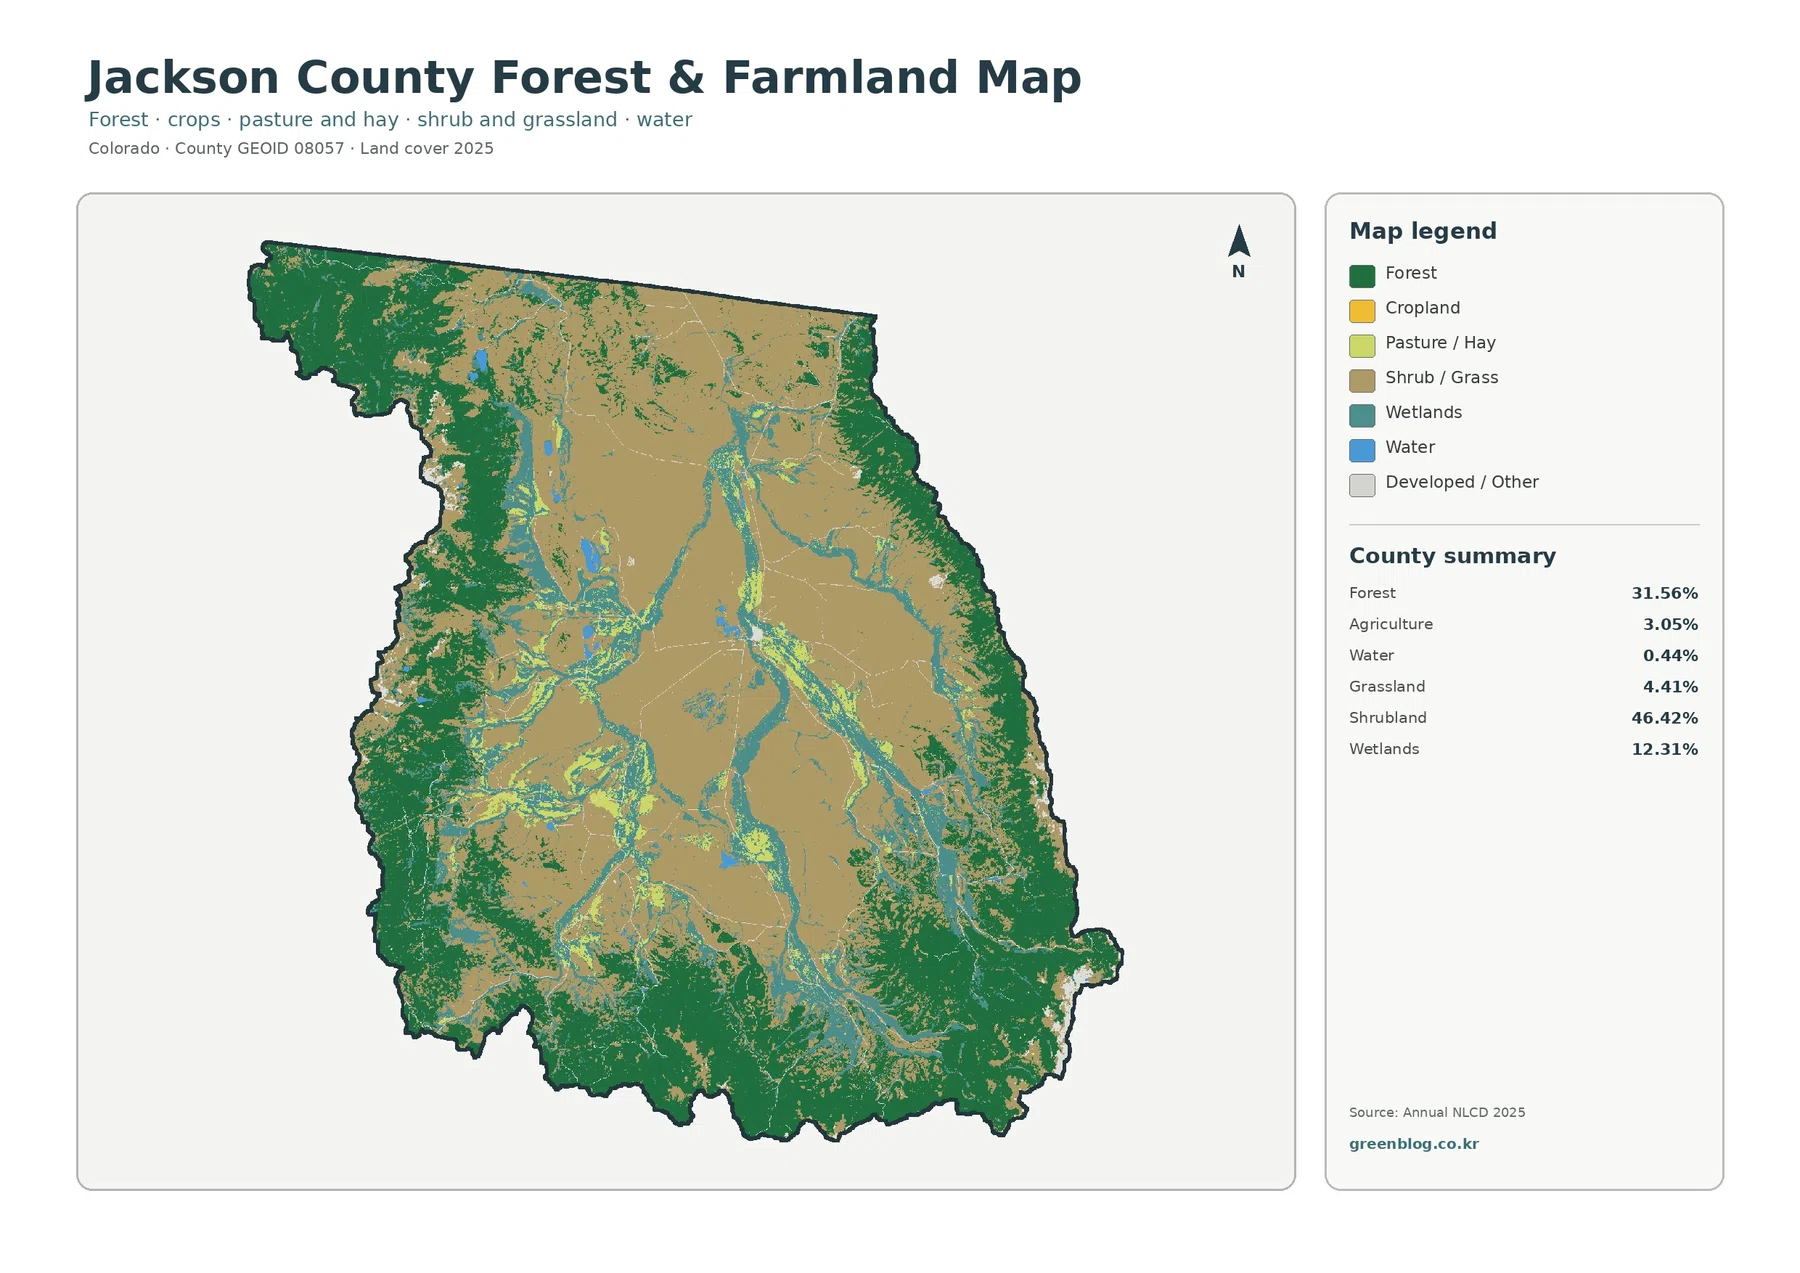
The simplified legend removes some detail and strengthens the contrast between the open basin and forested outer terrain. Shrub-and-grass cover dominates the center, while forest forms broad green areas around the western, southern, and eastern mountains.
Agricultural cover remains localized. Cropland and pasture or hay appear in selected basin-floor areas near wetlands rather than forming a continuous farming district. This matches the refuge’s description of irrigated meadows on floodplains surrounded by sagebrush uplands.
Wetlands remain prominent even on the simplified map. Their branching shape makes them useful for locating the low, moist part of North Park before comparing the surrounding shrubland and forest.
Forest-colored cells should not be interpreted as the legal boundary of State Forest State Park or another public land unit. Colorado Parks and Wildlife describes State Forest State Park as 70,932 acres of forest, jagged peaks, alpine lakes, and trails, but administrative boundaries and satellite-derived land cover answer different questions.
State Forest State Park provides a useful contrast with the open North Park basin
Colorado Parks and Wildlife describes State Forest State Park near Walden and Gould as a rugged mountain landscape with extensive forest, high peaks, and alpine lakes. That environment differs sharply from the broad shrub-and-wetland basin around central Jackson County.
Across the current map, the same broad regional contrast appears without the park boundary being drawn. Forest is much more important toward the mountain rims, while the basin interior is dominated by shrubland and wetland corridors.
Small blue water features in forested mountain areas should be interpreted with caution at web scale. Colorado Parks and Wildlife lists alpine lakes and North Michigan Reservoir in the State Forest landscape, but the supplied raster does not label individual water bodies.
This distinction is useful for presentations: an official park source can supply named places and recreation context, while the land-cover maps show generalized surface classes across the whole county.
Forest loss drives most of the 12.33% class difference between 1985 and 2025
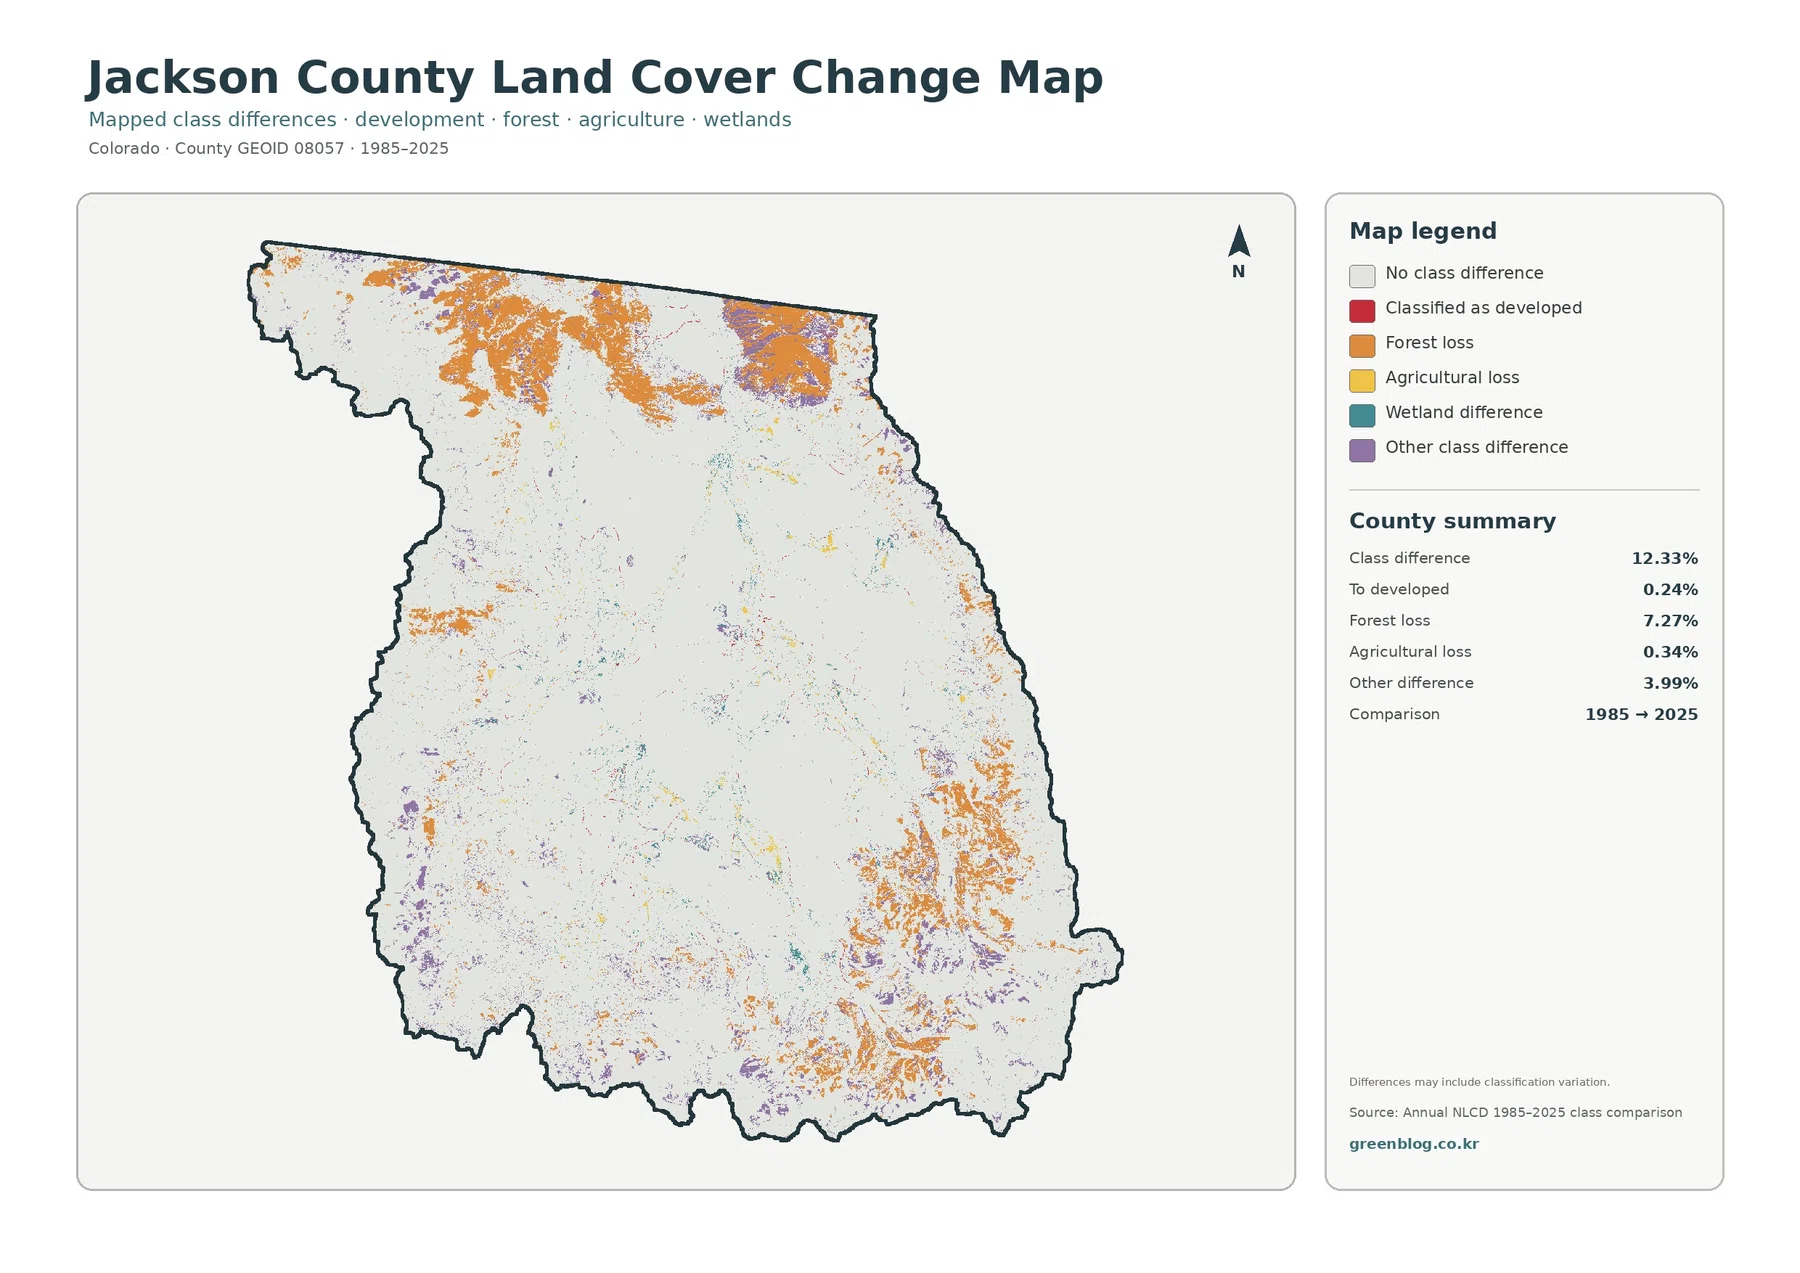
Mapped classes differ across 12.33% of Jackson County between 1985 and 2025. Forest loss is the largest category at 7.27%, followed by other class difference at 3.99%, agricultural loss at 0.34%, and conversion to developed at 0.24%.
Large orange forest-loss areas occur along the northern edge, with additional patches in the west-central and southeastern mountain zones. Purple other-difference pixels are also prominent in parts of the north and south. The open central basin contains much less concentrated change color.
The 7.27% forest-loss category does not identify a cause. Wildfire, insects, vegetation disturbance, timber change, recovery, and classification variability cannot be separated from this two-date map alone. A specific orange patch requires intermediate-year imagery or local forest records before any cause is assigned.
Conversion to developed is only 0.24%, far smaller than the current 1.06% developed-cover share. The change layer shows cells that shifted into a developed class between the selected years, not every location that is developed in 2025.
Why 30-meter raster cells matter in a basin full of narrow wetland corridors
Annual NLCD uses 30-meter raster cells. A cell can contain shrubs, grass, wet ground, water, a road, or a building at the same time, yet the land-cover product assigns one representative class. Fractional imperviousness handles hard surface separately.
This generalization matters in Jackson County because wetland corridors and small streams can be narrow. A blue-green wetland line is useful for county-scale pattern reading, but it is not a surveyed stream channel or a legal wetland boundary.
Small statistics also need geographic context. Water is 0.44%, developed cover 1.06%, and highly impervious cells only 0.01%. A concentrated pond or settlement can still be easy to see even when its countywide percentage is tiny.
Both the land-cover and impervious products represent 2025. Changes after that year, including construction, vegetation recovery, fire effects, or altered water conditions, may not appear. Current site decisions require newer local information.
Choose the Jackson County map according to the question
Use the general land-cover map first when you need the complete North Park picture. It places shrubland, forest, wetlands, grassland, agriculture, water, and the small developed footprint in one view.
The forest-and-farmland version works better for explaining the difference between the open basin and the forested mountain rim. Imperviousness is the clearest choice for Walden-area hard surfaces because most natural-cover detail disappears and the small settlement cluster stands out.
The change map is the right layer for 1985–2025 questions, especially the northern and southeastern forest-loss areas. Pair it with the current map so forest loss is not mistaken for present forest cover and conversion to developed is not mistaken for all current development.
For a classroom or presentation, comparing the Arapaho refuge landscape with the State Forest mountain setting is particularly effective. One emphasizes shrubland, wet meadows, and riparian cover; the other provides local context for forested peaks and alpine lakes.
Download four original Jackson County JPG maps
The downloadable ZIP contains four original JPG files: general land cover, forest and farmland, impervious/developed land, and 1985–2025 land-cover change. The WebP images in the article are optimized for quick online viewing, while the JPG files are better for enlarging wetland networks, small water features, and sparse built surfaces.
Keep the map title, year, and legend with each image when reusing it. Current forest and forest loss, current development and conversion to developed, and developed cover and imperviousness are related but different measurements.
Frequently Asked Questions
Why are wetlands such a large part of Jackson County?
Wetlands cover 12.31% and form a branching network across the North Park basin. The U.S. Fish and Wildlife Service describes the Arapaho refuge area as a mix of wetlands, willow riparian habitat, grassland meadow, irrigated floodplain, and sagebrush upland.
Why is mean imperviousness only 0.16%?
Most of the county is covered by shrubland, forest, wetlands, and grass. Hard surfaces are concentrated in a very small settlement cluster around the Walden area, and cells above 50% imperviousness account for only 0.01%.
Can 7.27% forest loss be subtracted from the current 31.56% forest share?
No. Forest loss is a 1985–2025 change category, while 31.56% describes current 2025 forest cover. They measure different things and cannot be subtracted to reconstruct an earlier forest percentage.
Map File Information
The download ZIP contains four original Jackson County land-cover JPG maps.
- Included Files: Use only the versions confirmed in the article and supplied images
- File Type: Use the confirmed download contents
- Intended Use: Printing, education, presentations, and map-based projects
Related Maps
- Adams County Colorado Land Cover Map
- Alamosa County Colorado Land Cover Map
- Arapahoe County Colorado Land Cover Map
Sources and References
- MRLC Annual NLCD Data – official access point for Annual NLCD products and data.
- USGS Annual NLCD Land Cover Classification – official documentation for interpreting Annual NLCD classes and 30-meter raster data.
- U.S. Fish and Wildlife Service – Arapaho National Wildlife Refuge – official North Park context for wetlands, sagebrush, irrigated meadow, riparian habitat, and North Platte headwaters.
- Colorado Parks and Wildlife – State Forest State Park – official information about the forested mountain and alpine-lake environment in Jackson County.
- Town of Walden – official municipal website and location reference for Walden.
Green Map creates custom-edited map images using open geographic data sources such as geoBoundaries, Natural Earth, OpenStreetMap, and government open data.
These maps are edited visual materials, not raw data files, and are provided for education, documents, presentations, and graphic reference.