Conejos County is one of the Colorado counties where a single land-cover label tells only part of the story. Shrubland is the largest 2025 class at 46.25%, yet the western side is strongly forested while farm blocks, wetlands, and small developed clusters become much more visible across the valley side of the county. That west-to-east contrast gives the four maps on this page a clear geographic pattern rather than a uniform countywide appearance.
The page compares current land cover, forest and farmland, impervious and developed surfaces, and mapped class differences from 1985 to 2025. The four original JPG maps are available together in one download. They work best as county-scale reference images for reports, lessons, presentations, and side-by-side comparison, especially when the same location is checked across more than one layer.
Table of Contents
A county divided between mountain cover and valley mosaics
The regional setting helps explain the map before any percentage is considered. The San Luis Valley Regional Hazard Mitigation Plan describes roughly half of Conejos County as part of the San Luis Valley floor at about 7,700 feet, while the western half rises through foothills into the San Juan Mountains, with peaks around 13,000 feet. On the land-cover image, that change in terrain corresponds to a strong shift from broad western forest to shrub-dominated and agricultural surfaces farther east.
This does not mean elevation directly determines every mapped class. The image is a land-cover classification, not a terrain model, and it does not show legal land use, ownership, or zoning. It simply records the dominant surface class assigned to raster cells. Still, the official description of a mountain-to-valley landscape provides useful context for why forest, shrubland, farmland, and wetlands occur in such different proportions across the county.
Shrubland leads the 2025 summary, but forest reshapes the west
The 2025 county summary identifies shrubland as the dominant class at 46.25%. Forest accounts for 26.52%, agriculture 11.77%, wetlands 7.43%, and grassland 5.45%. Water is much smaller at 0.26%. These figures show that shrubland is the main countywide category, but the spatial pattern matters as much as the percentages because the classes are not evenly mixed.
Dark green forest covers much of the western part of the county in large connected masses. Open shrub and grass areas interrupt that forest in irregular patches, especially toward the center. Farther east, the forest becomes less continuous and tan shrubland occupies much larger blocks. Yellow agricultural areas become prominent in the central-eastern and eastern valley, while blue-green wetlands thread through areas that otherwise appear dry and open.
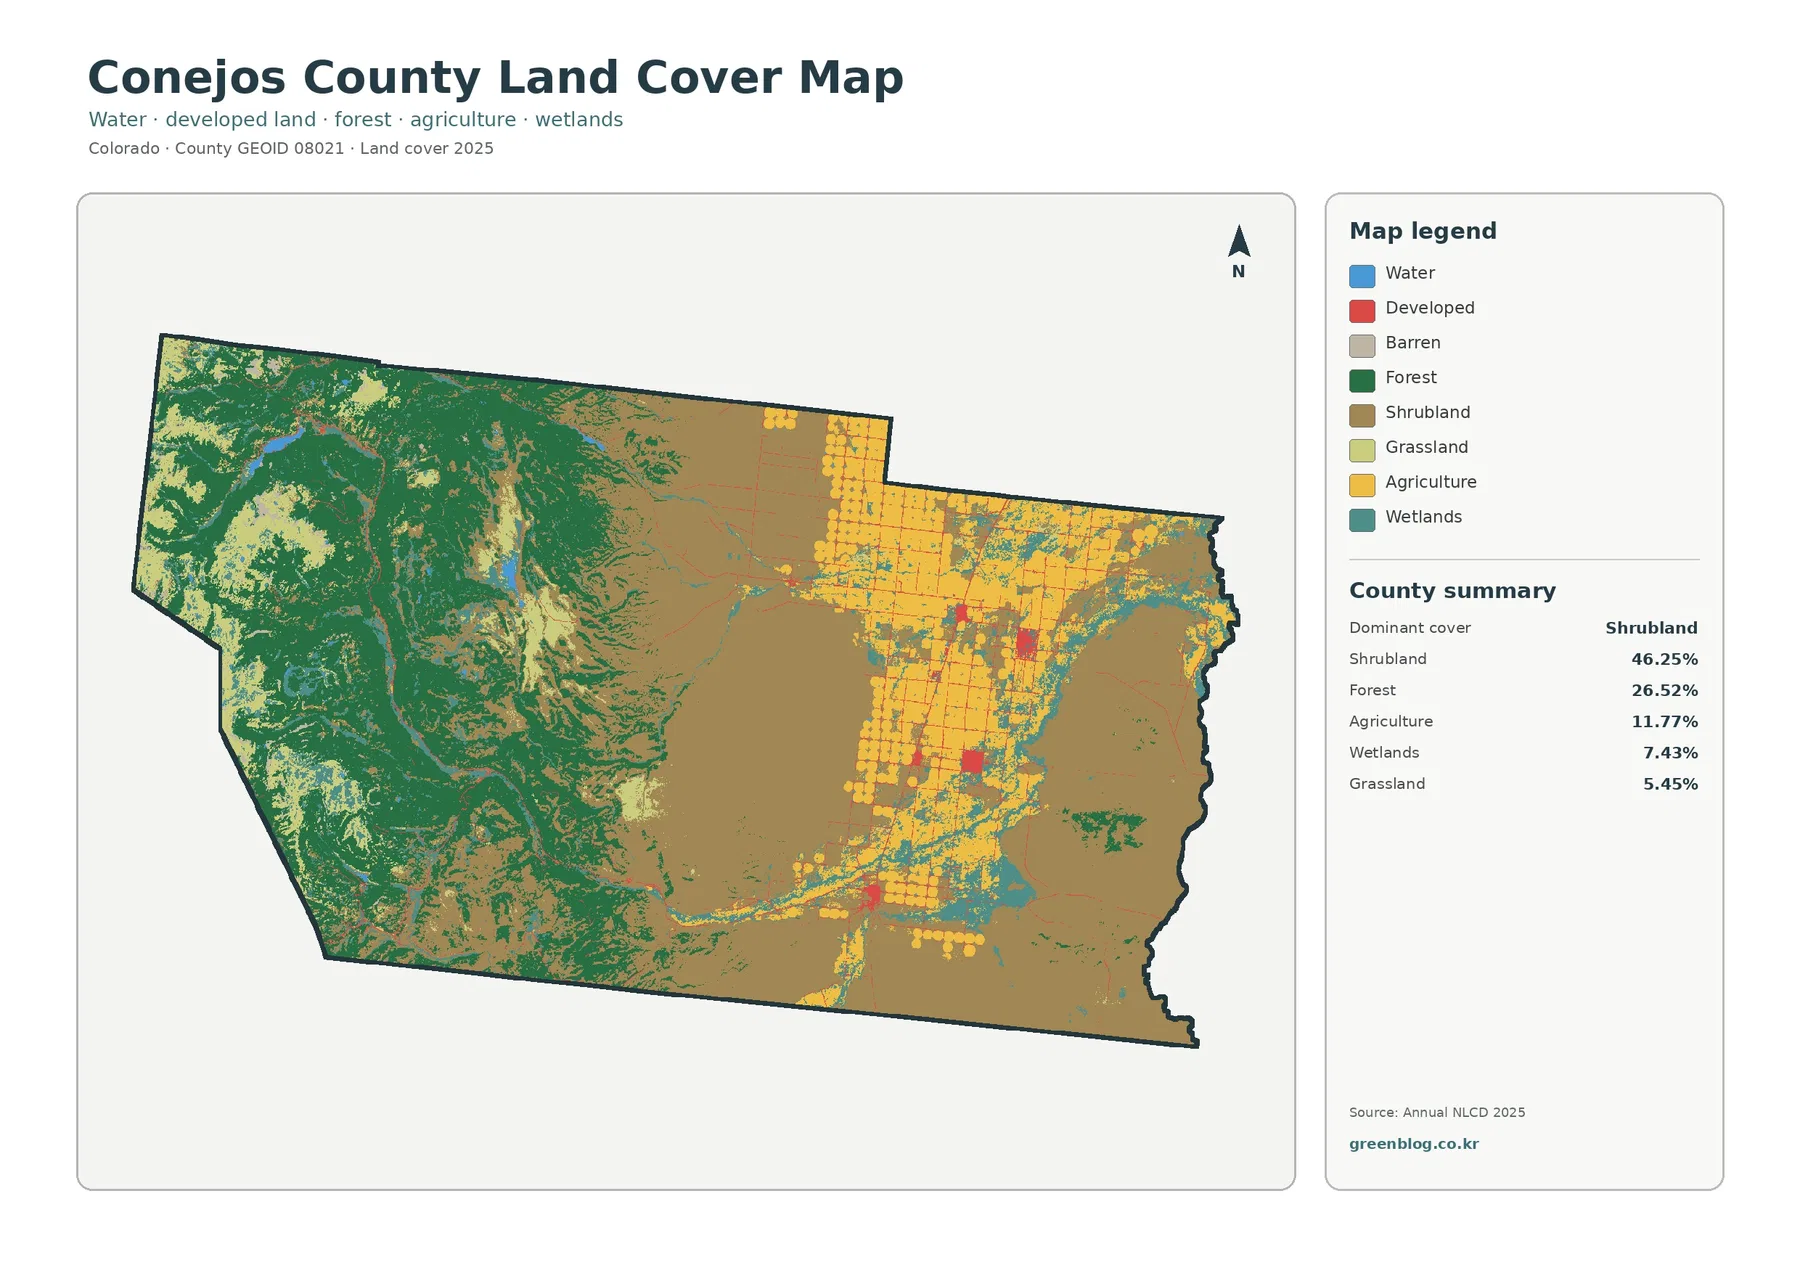
Water occupies only 0.26% of the county, yet several blue features are easy to locate because they contrast sharply with the surrounding forest and shrubland. The western mountain area includes conspicuous water bodies, while smaller water features occur farther east. The map should not be used as a named hydrography layer, however. It shows surface-water classification but does not label every river, reservoir, canal, or drainage.
The overall map is therefore best used for the broad question: what covers the ground now, and where do the major classes change? It is less suitable for deciding how a parcel may be used. A cell classified as agriculture is not automatically an agricultural zoning district, and forest does not imply public ownership or protected status. Those questions require county land-use, assessor, or management records.
Forest and farmland reveal the west-to-east transition
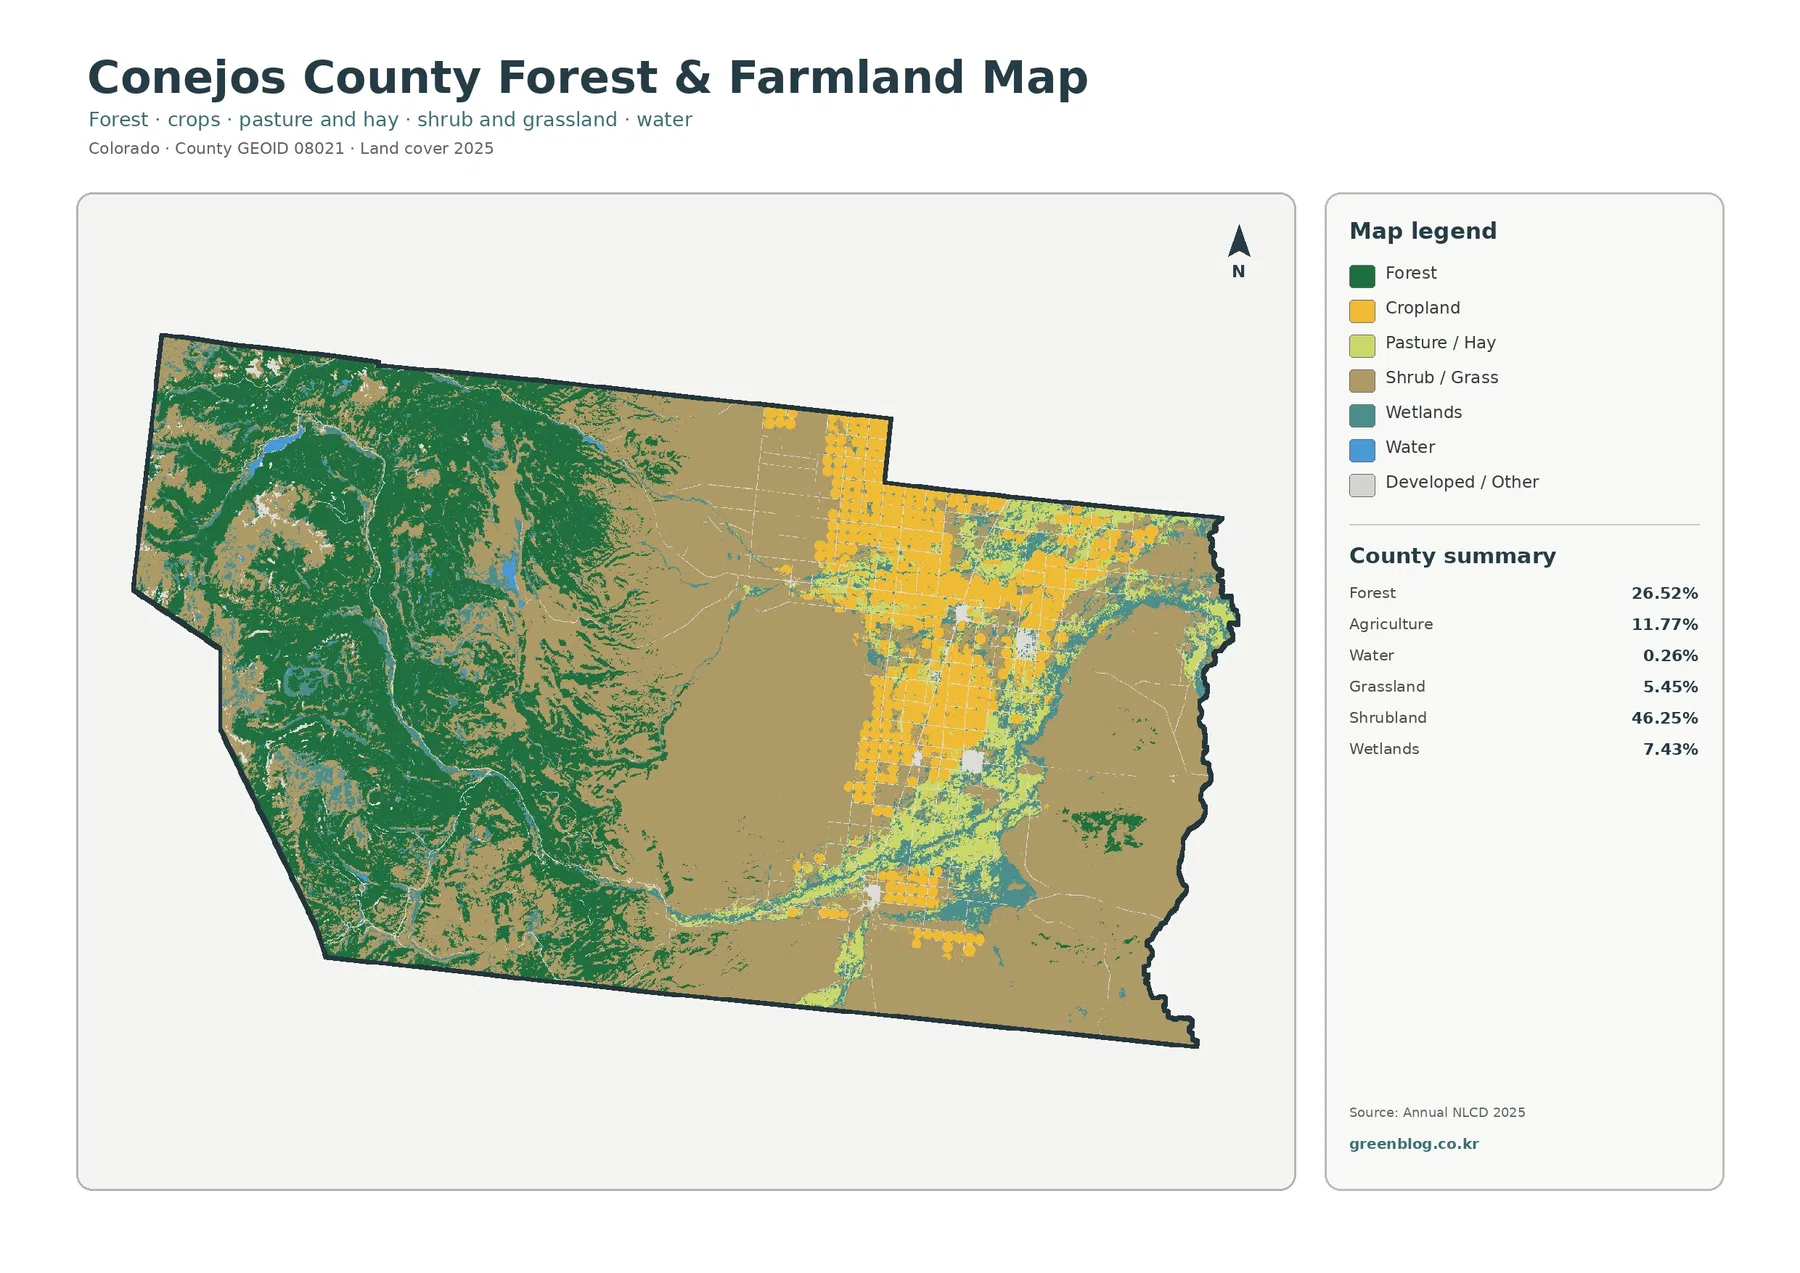
The forest-and-farmland view makes the county’s internal contrast easier to follow. Forest dominates the western mountain side, while crop and pasture colors become far more common across the valley portion. Between them lies a broad area of shrub and grass, with wetlands crossing the transition in narrow bands and branching patches. Agriculture is only 11.77% of the county, but its concentration in one part of the map makes it visually important.
The geometry of those agricultural areas is also distinctive. Many fields have straight edges or repeated blocks that differ sharply from the irregular forest boundaries to the west. Some cultivated shapes appear circular or nearly circular within the larger grid. The image does not identify individual farms or irrigation systems, so those shapes should be treated as visible land-cover patterns rather than parcel-level evidence.
Water management is an important part of the local background. The U.S. Bureau of Reclamation describes the Conejos Division of the San Luis Valley Project and notes that Platoro Reservoir on the Conejos River supplies supplemental irrigation water within the Conejos Water Conservancy District. That official context helps explain why agriculture and water are meaningful topics in the valley, but it does not justify identifying every blue or wetland feature on this raster as a specific reservoir, canal, or irrigation ditch.
Forest and agriculture should also be read with shrubland, not as a simple two-class opposition. Shrubland occupies nearly half the county and fills much of the space between the forested west and the farm-heavy valley. Grassland adds another 5.45%. Together, those open classes make the transition broad and gradual, with forest fingers, wet areas, and agricultural blocks breaking up what might otherwise look like one continuous shrub surface.
Wetlands form a larger footprint than open water
Wetlands account for 7.43% of the supplied 2025 land-cover summary, far more than the 0.26% assigned to open water. On the map, blue-green wetland cells form elongated bands through the valley and smaller branches toward the mountain side. Their shape often follows low, connected areas instead of the rectangular geometry of many farm fields. That makes wetlands one of the best features for orienting yourself when switching between the general map and the forest-and-farmland version.
A separate Conejos County profile from the Colorado Natural Heritage Program reports 47,798 acres of mapped wetlands and about 6% wetland coverage in its own inventory. That number should not replace the 7.43% Annual NLCD value used by the map on this page. Different datasets can use different observation dates, wetland definitions, source imagery, and mapping methods. When citing a percentage, name the dataset and year rather than treating unlike products as interchangeable.
Open water and wetlands should remain separate in any explanation. Open water represents visible water surfaces, while wetland classes describe land where water, saturated soils, and wetland vegetation are part of the surface condition. A narrow river or lake may appear blue, while the broader area around it can be mapped as wetland. Combining the two into one number would hide an important distinction in Conejos County, where wetlands occupy a substantial share of the valley landscape.
Hard surfaces remain small and clustered
The impervious-surface map is striking because most of the county is nearly blank at this scale. Mean impervious cover is 0.53%, and only 0.08% of the county is summarized as having at least 50% impervious surface within a cell. Developed cover is 1.86%. Those values are consistent with a rural county where pavement, rooftops, and other hard surfaces occupy a small fraction of the total area.
The highest impervious values appear as small clusters and thin connecting lines across the central-eastern and eastern valley. Several clusters are clearly larger than the faint traces crossing the western mountain area. The pattern is not a continuous urban blanket. It looks more like separated settlements connected by roads, with agricultural and open land filling most of the space between them.
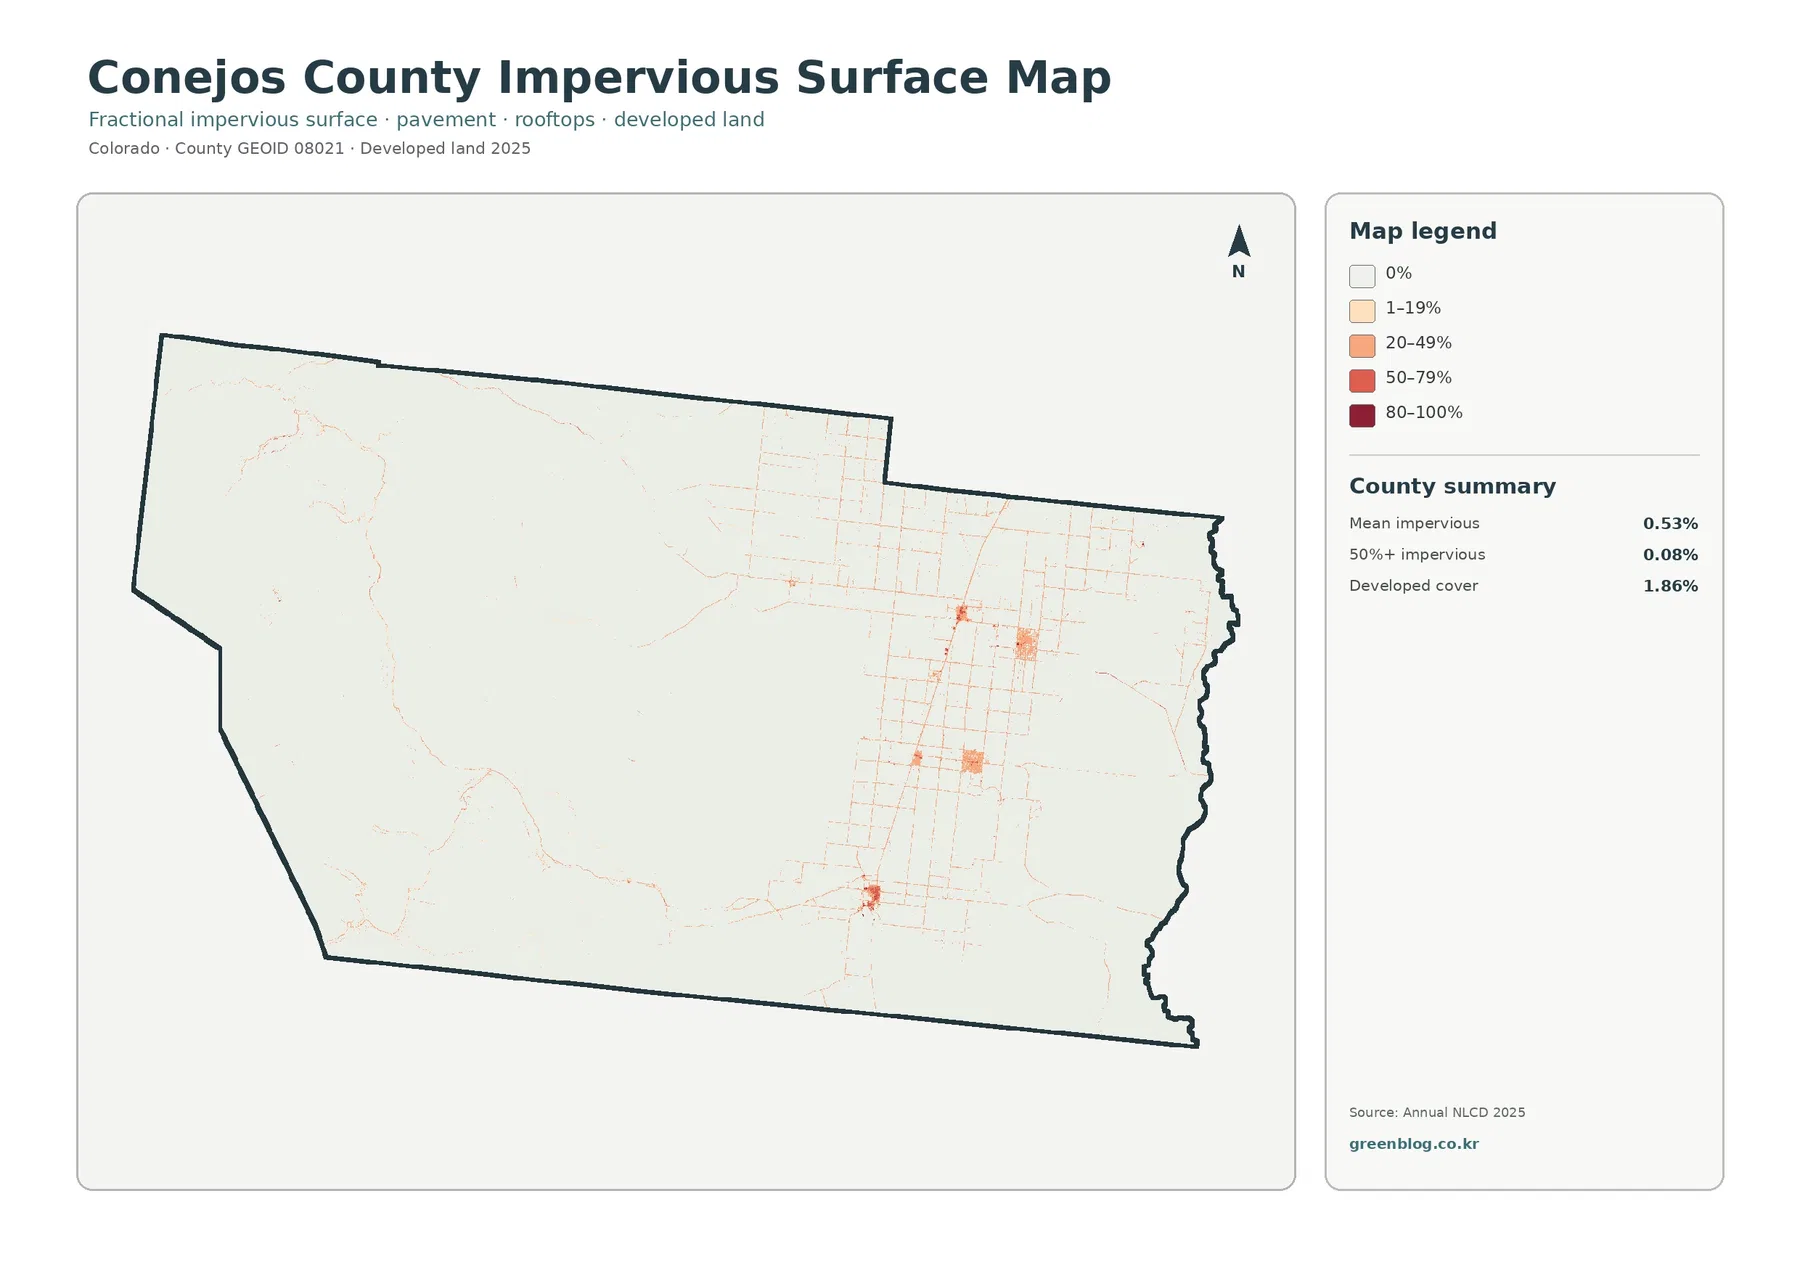
The regional hazard plan identifies Antonito, La Jara, Manassa, Romeo, and Sanford as incorporated towns, along with Capulin and Conejos as census-designated places. The raster image does not label those communities, so an individual red or orange cluster should not be assigned to a town solely from this map. A labeled road or place map can be used alongside the impervious layer when exact settlement identification is needed.
Developed cover and impervious percentage answer different questions. A developed land-cover cell can include lawns, soil, trees, and other permeable surfaces mixed with buildings or pavement. Impervious data estimate the hard-surface fraction within the cell. For that reason, the 1.86% developed-cover share is not expected to equal the 0.53% mean impervious value, and neither should be substituted for the other.
The change map points to selective turnover, not total replacement
The 1985–2025 comparison reports a class difference across 8.28% of the county. Other class difference is the largest listed category at 5.03%, followed by agricultural loss at 2.10%, forest loss at 0.50%, and change classified as developed at 0.24%. Most of the map remains in the no-class-difference background, so the correct first impression is relative stability across the majority of the county with change concentrated in selected areas.
Colored change cells are particularly visible across the agricultural valley and the mixed wetland-farm corridor in the center and east. Yellow agricultural-loss cells appear within and around the field pattern. Purple other-difference cells occur in many sizes, while smaller orange forest-loss patches are scattered through the western and transitional areas. Red developed-change cells are limited and often appear near places where the current impervious map also shows clusters or thin connections.
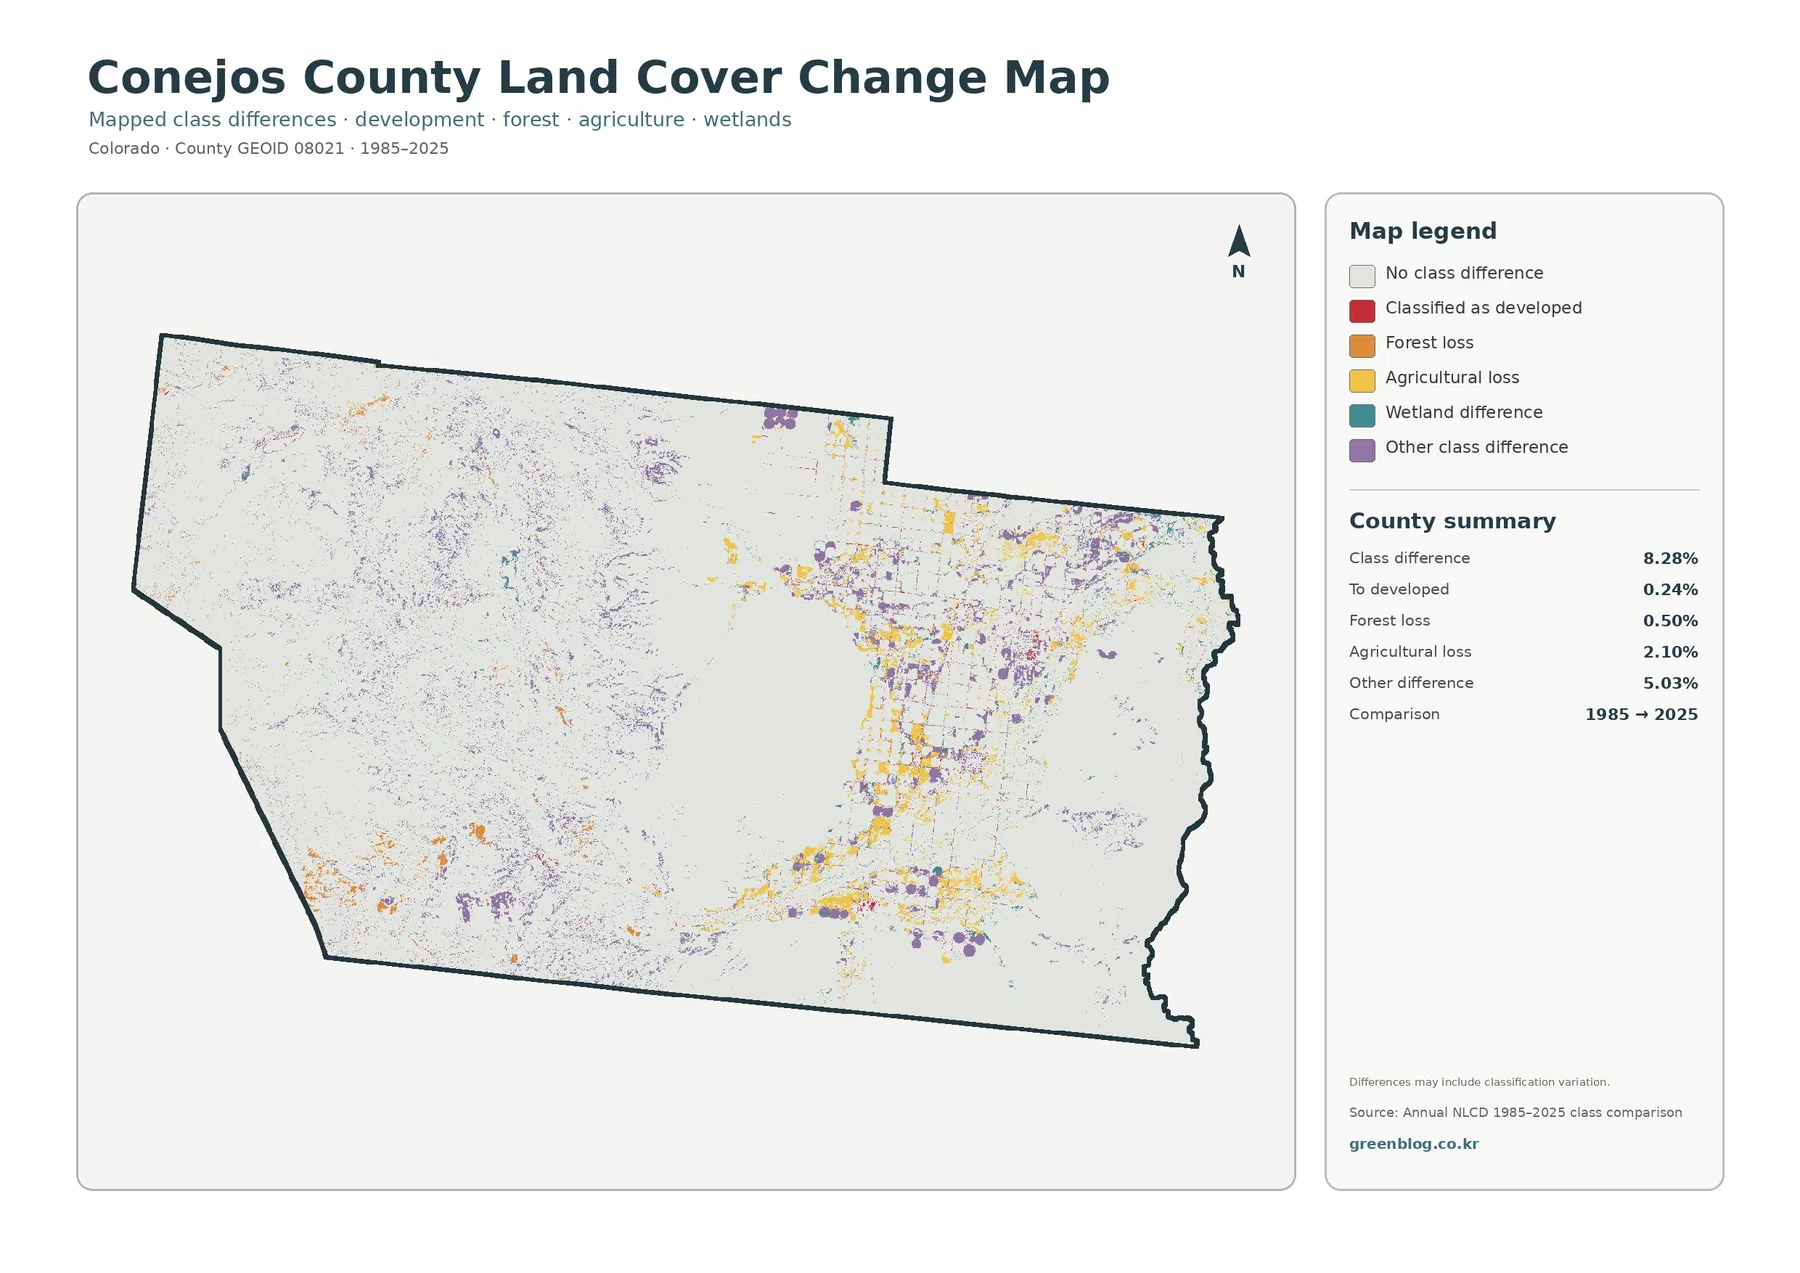
Agricultural loss should not be read as a direct measure of farms permanently disappearing. It is a class-comparison category between two mapped years. A cell can change because of vegetation condition, fallowing, water availability, a true conversion to another cover, or classification variation. The map itself notes that mapped differences may include classification variation, so identifying a cause requires time-series imagery, agricultural records, water information, or local land-use documentation.
The same caution applies to the 0.50% forest-loss category. It is not automatically a wildfire perimeter, logging estimate, or permanent deforestation total. Current forest cover of 26.52% is a 2025 status statistic, while forest loss is a category within the 1985–2025 comparison. Subtracting one directly from the other would not reconstruct the 1985 forest share because the change map does not provide a complete transition matrix for every class.
Use the four layers as one comparison set
For the western half, start with the forest mass on the general map and then check the forest-and-farmland image to see where wooded cover gives way to shrub and grass. The impervious layer shows how little hard surface occupies the same mountain area. Finally, the change map can be used to locate scattered forest-loss and other-difference cells without assuming that every visible change has the same cause.
For the valley side, begin with agricultural blocks and wetland bands. The simplified forest-and-farmland map makes the field pattern easier to follow, while the impervious map adds the small settlement and transportation footprint. The change layer then shows where agricultural-loss and other-difference cells cluster within that same landscape. Switching layers in this order keeps current condition, human-built surface, and long-term class difference from being mixed into one explanation.
The central transition deserves its own look because it contains large shrub areas, forest extensions, wetlands, and farm patches within a relatively short distance. That zone helps explain why shrubland can dominate the countywide percentage even though the west looks heavily forested and parts of the east look strongly agricultural. The county summary and the spatial distribution are both necessary to describe Conejos County accurately.
Classification limits matter in a mixed rural landscape
Annual NLCD is raster data. The ground is divided into cells, and each cell receives a representative land-cover class or impervious fraction. Real features are often narrower or more complicated than those cells. A road, irrigation ditch, wet meadow, shrub patch, and field edge can meet within a small area, so the mapped boundary is a generalized representation rather than a survey line.
This is particularly important for the narrow wetland bands, small water bodies, road-like impervious lines, and field margins visible in Conejos County. A feature can appear wider than it is on the ground, disappear at county scale, or be assigned to the dominant neighboring class. The maps are useful for regional pattern comparison, but they are not suitable for locating parcel corners, confirming a wetland boundary for permitting, or measuring a road footprint.
Land cover also differs from land use. Conejos County’s Land Use Code includes goals related to protecting agriculture, rural character, and water resources, but those planning goals are not encoded in the NLCD colors. A shrubland cell may be privately owned, publicly managed, grazed, conserved, or subject to another legal designation. For zoning, building, ownership, or development questions, use county records rather than interpreting the land-cover class as a legal status.
The 2025 map is not a live image. Construction, changing crop patterns, fire, vegetation recovery, and water-level changes after the observation year may be absent. The 1985–2025 layer compares endpoints and does not tell you the year in which a class changed. A project that needs annual timing should use additional Annual NLCD years, aerial imagery, and local records.
Choose the JPG that matches your question
The general map is the best single image for a county overview because it keeps shrubland, forest, agriculture, wetlands, grassland, water, and development together. Use the forest-and-farmland map when the project centers on the mountain-to-valley contrast or the geometry of farm fields. Choose the impervious map for roads, rooftops, and settlement concentration. Use the change map only when the topic is the difference between 1985 and 2025 rather than present-day cover.
For a classroom exercise, the current percentages provide several useful comparisons: shrubland 46.25%, forest 26.52%, agriculture 11.77%, wetlands 7.43%, and grassland 5.45%. For a development discussion, keep developed cover at 1.86%, mean impervious cover at 0.53%, and the 0.08% share at 50% or greater imperviousness clearly separated. For a historical comparison, use the 8.28% class-difference figure with the change-category breakdown rather than mixing it with current-cover percentages.
The four JPG files are supplied at their original 2480×1754-pixel size. The package manifest does not mark them as meeting its A3 high-resolution reference, so this page does not promise a larger print specification. They are best used at a scale appropriate to the source dimensions. If you plan to enlarge them for printing, test the output first so labels and class boundaries remain clear.
In reports, one effective layout is to use the general map as the main figure and add one specialized layer next to the section that needs it. A presentation can place all four images at the same size to show the western forest, valley agriculture, wetland network, compact hard-surface footprint, and mapped change in a consistent county outline. This approach uses each map for a distinct purpose instead of repeating the same explanation four times.
Frequently Asked Questions
Why is shrubland the dominant class in Conejos County?
The supplied 2025 summary assigns 46.25% of the county to shrubland. Large shrub-colored areas occupy the center and much of the valley side, with additional patches mixed into the western landscape. The percentage describes surface cover in the NLCD classification. It does not mean that 46.25% of the county has one legal land use, ownership type, grazing status, or management designation.
Why does this map show 7.43% wetlands when another county wetland profile is closer to 6%?
The figures come from different mapping systems. This page uses the supplied 2025 Annual NLCD land-cover summary, while the Colorado Natural Heritage Program county profile uses a separate wetland inventory and reports about 47,798 mapped wetland acres, roughly 6% in that product. Differences in definitions, source imagery, scale, and observation date can produce different totals, so the dataset name should always accompany the percentage.
Does the 2.10% agricultural-loss class mean that much farmland permanently disappeared?
No. It is the share placed in the agricultural-loss category when the 1985 and 2025 classifications are compared. The cause could involve real land-cover conversion, fallowing, crop or moisture conditions, or classification variation. The change image does not identify the cause or the year of change. Agricultural statistics, water records, historical imagery, and local land-use information are needed for that question.
Map File Information
The ZIP contains four original Conejos County JPG maps covering 2025 land cover, forest/farmland, impervious/developed land, and 1985–2025 land-cover change.
- File Type: Four JPG files in one ZIP archive
Related Maps
- Adams County Colorado Land Cover Map
- Alamosa County Colorado Land Cover Map
- Arapahoe County Colorado Land Cover Map
Sources and References
- MRLC Annual NLCD Data — official access point for Annual NLCD land-cover products.
- USGS Annual NLCD Land Cover Classification — definitions for shrubland, forest, agriculture, wetlands, developed land, and related classes.
- San Luis Valley Regional Hazard Mitigation Plan — Conejos County Annex — regional context for the San Luis Valley floor, western San Juan Mountains, and county communities.
- Colorado Natural Heritage Program — Conejos County Wetland Profile — county-specific wetland mapping and wetland-type information.
- Conejos County Land Use Code — official county planning context for agriculture, rural character, development, and water resources.
- U.S. Bureau of Reclamation — San Luis Valley Project — background on the Conejos Division, Platoro Reservoir, and irrigation water in the valley.
Green Map creates custom-edited map images using open geographic data sources such as geoBoundaries, Natural Earth, OpenStreetMap, and government open data.
These maps are edited visual materials, not raw data files, and are provided for education, documents, presentations, and graphic reference.