Bent County sits in southeastern Colorado, and its 2025 land-cover map is overwhelmingly open: grassland accounts for 81.62% of the county. The Arkansas River cuts across the upper middle of the map, where agriculture, wetlands, water, and developed land become much more visible than they are across the broad plains to the north and south. John Martin Reservoir forms the largest single water feature and gives the four maps an easy geographic reference point.
Four views are included here: current land cover, forest and farmland, impervious/developed land, and a 1985–2025 land-cover comparison. After reviewing the WebP previews, you can download the four original JPG maps together in one ZIP for county reference, teaching, reports, or presentation graphics.
Table of Contents
A grassland county with a very different Arkansas River corridor
Most of Bent County is rendered in the grassland color, and that broad background is especially continuous across the southern half of the county. The pattern changes sharply near the Arkansas River. Agricultural blocks line parts of the river corridor, wetlands trace water-influenced areas, and the blue shape of John Martin Reservoir stands out near the east-central part of the county. This contrast matters more than the countywide percentages alone because the smaller classes are concentrated rather than evenly scattered.
The supplied 2025 summary lists grassland at 81.62%, shrubland at 6.85%, agriculture at 6.77%, wetlands at 2.64%, developed cover at 1.50%, and water at 0.56%. Forest is only 0.01% in the forest-and-farmland summary. Those values make Bent County very different from a forested Colorado mountain county: the important questions here are where the open grassland is interrupted, how farmed land follows the river, and where water and wetland classes gather around the reservoir and river channel.
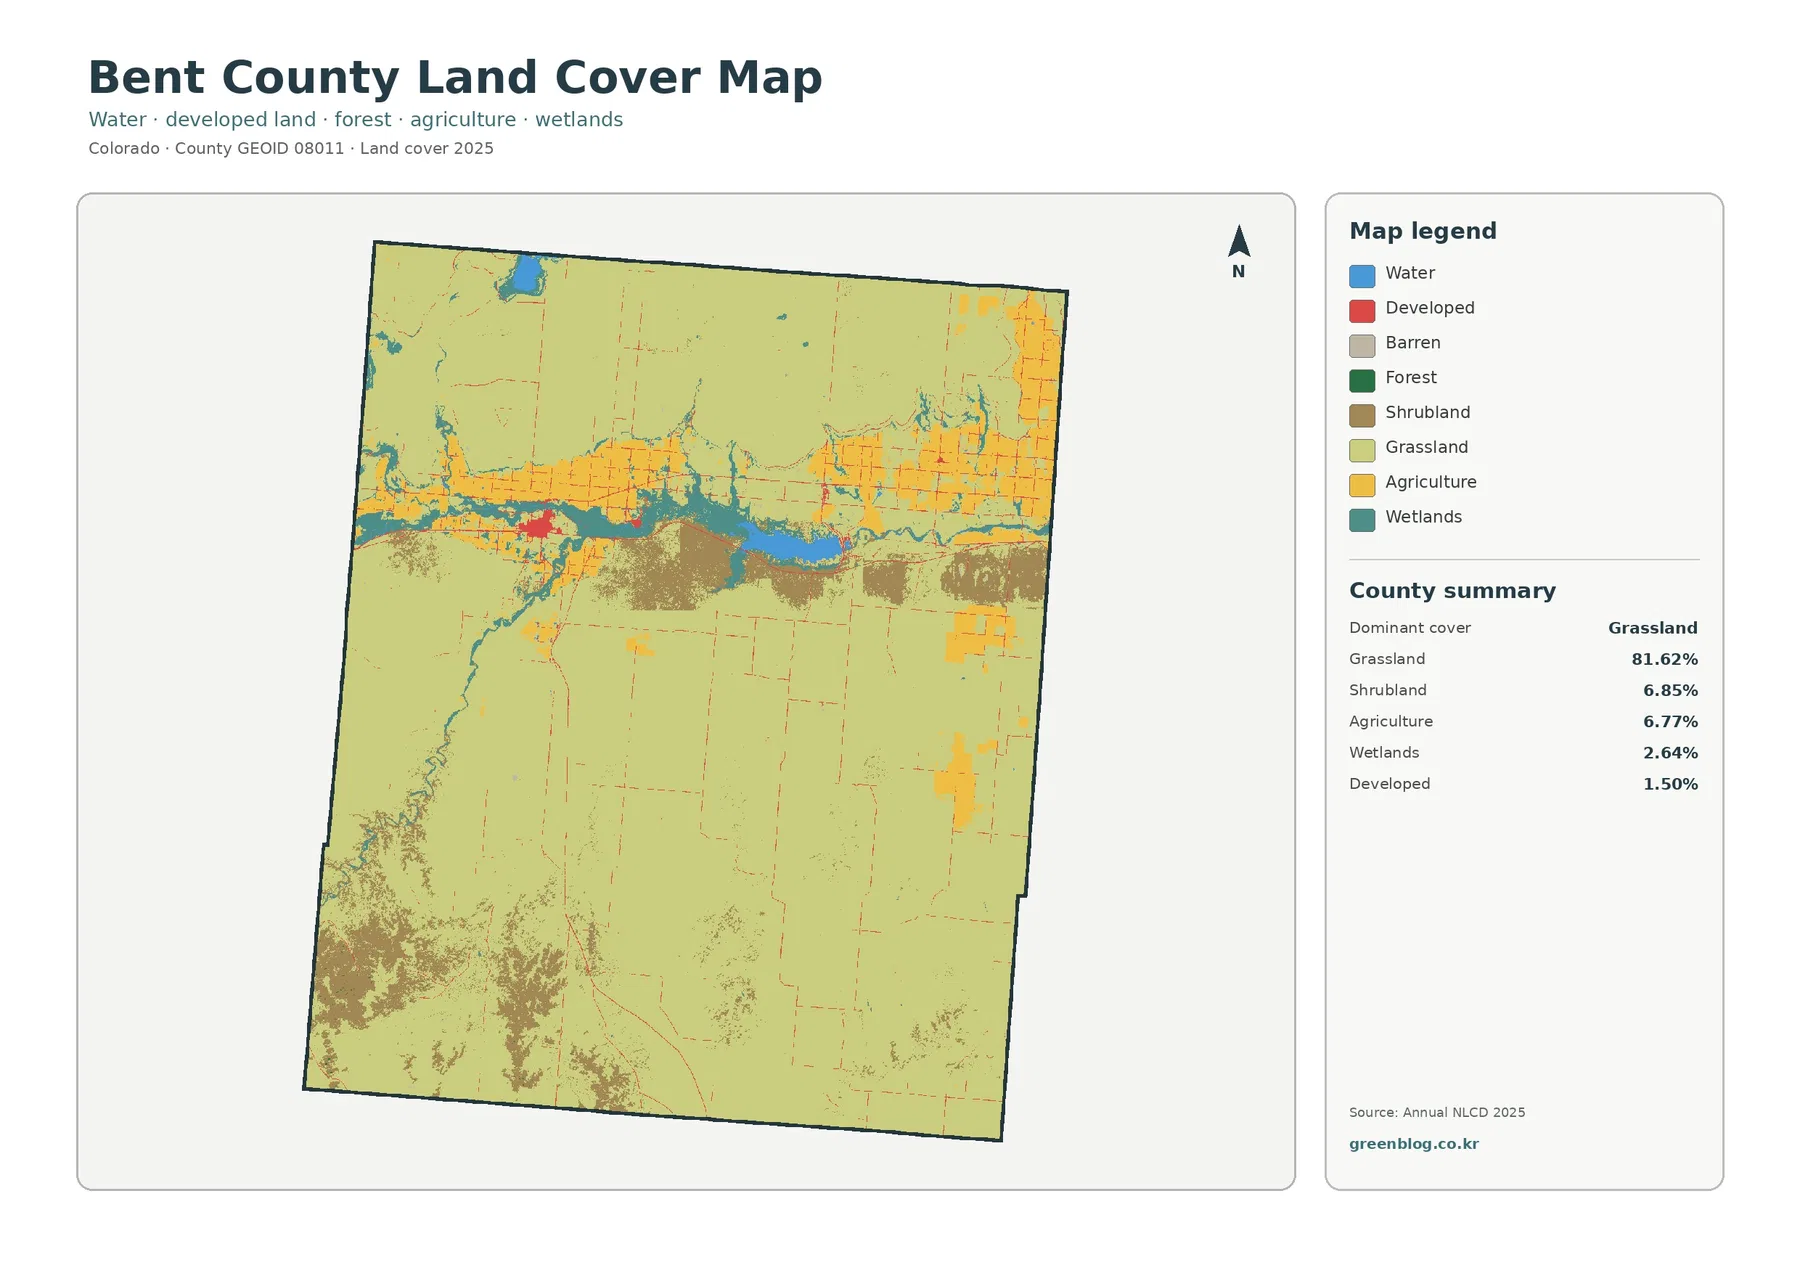
The full legend separates water, developed land, barren land, forest, shrubland, grassland, agriculture, and wetlands. Land cover should not be confused with zoning or legal land use. It describes the surface category assigned from remotely sensed data; it does not show who owns a parcel, what a parcel is legally allowed to be used for, or which crop is growing in a particular field. A developed class also is not a building-footprint layer.
John Martin Reservoir is especially useful for checking the map against a known place. Colorado Parks and Wildlife identifies it as a reservoir and state-park water body in Bent County. On the land-cover image, the reservoir appears as the large blue area near the river corridor, with wetland colors extending around portions of the shoreline and upstream areas. Water is only 0.56% countywide, yet its concentration in one large feature makes it much more visually prominent than the percentage might suggest.
Farm blocks follow the river while open grass and shrub cover dominate elsewhere
The forest-and-farmland view reduces some of the legend complexity and makes the agricultural pattern easier to trace. Cropland forms a broken belt near the Arkansas River and appears in larger rectangular blocks toward the northeast. Smaller cultivated areas occur elsewhere, but they do not replace the broad grass/shrub cover that fills most of the county. South of the river corridor, open cover becomes much more continuous and agriculture is comparatively sparse.
Agriculture represents 6.77% of the land-cover summary, so Bent County is not a county where cropland covers most of the mapped area. Even so, the fields are concentrated in places that make them important to the local landscape. USDA’s 2017 county agriculture profile reported extensive pastureland within land in farms and also documented cropland and irrigated acreage. That agricultural census measures farm operations rather than NLCD land cover, so the figures should not be combined directly, but it provides useful background for the mix of open range and cultivated land seen on the map.
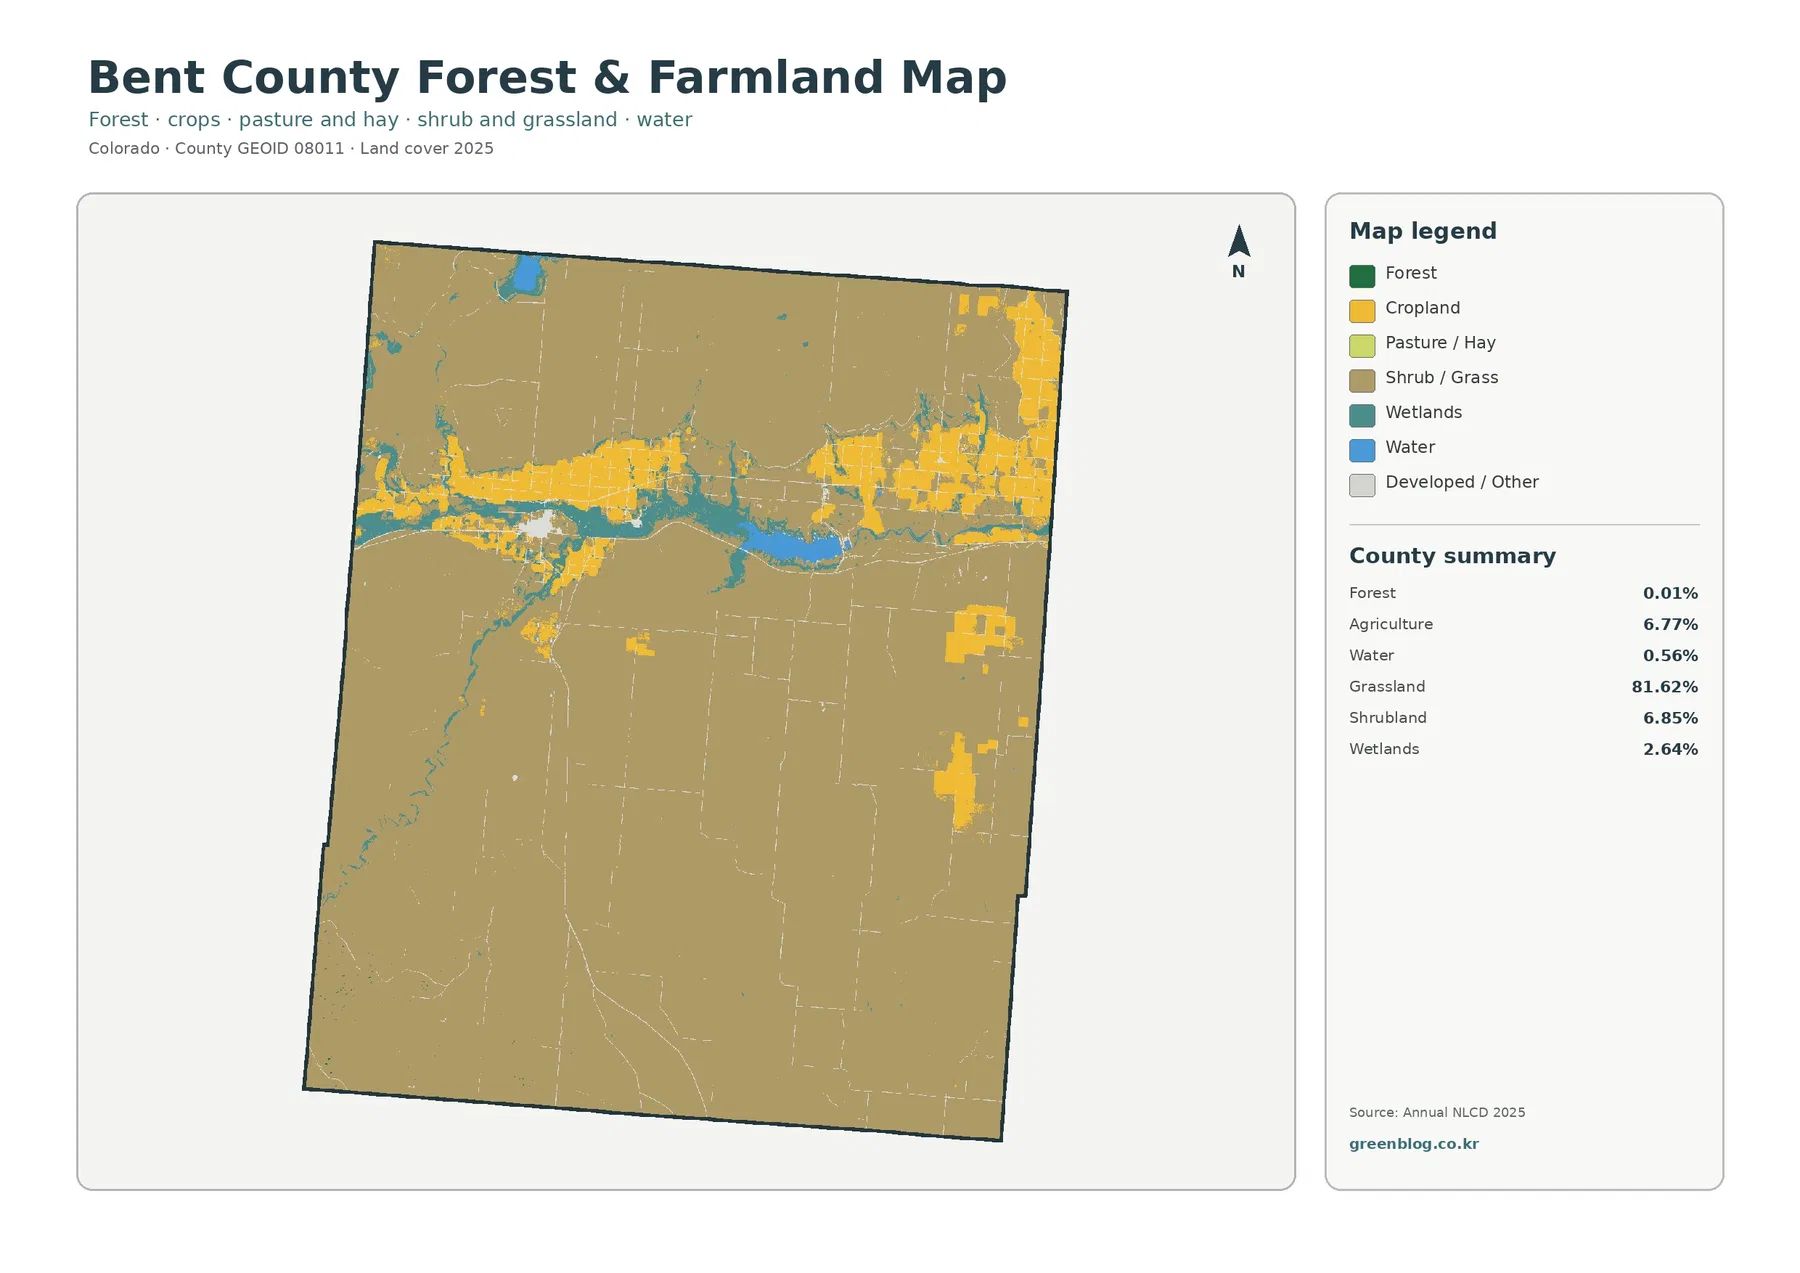
Forest is almost absent at 0.01%, which is why the darkest green class does not form any meaningful countywide block. The value of this particular map is therefore not in locating large forests. It is better for comparing cropland with pasture/grass and shrub/grass categories, and for seeing how water and wetlands break up the agricultural corridor near the river.
Wetlands deserve separate attention because they cover 2.64%, substantially more area than the 0.56% water class. The reservoir surface and river water are mapped separately from wetland vegetation and other wet ground. Along the Arkansas River and around John Martin Reservoir, the teal wetland color follows edges and narrow corridors that are distinct from the blue water surface. That makes this map useful when a project needs to distinguish open water from adjacent wetland cover.
Las Animas is the clearest concentration of hard surface
The impervious-surface layer measures pavement, rooftops, and other hard surfaces that do not readily absorb water. Bent County has a mean impervious value of only 0.30%, and just 0.04% of the county is mapped at 50% impervious or higher. Most of the image is therefore close to white, with a small number of orange and red clusters and thin linear traces.
The strongest cluster corresponds to the Las Animas area along the Arkansas River corridor. The City of Las Animas describes the community as the county seat and the only incorporated municipality in Bent County. That local fact fits the map: a compact concentration of hard surface appears in an otherwise lightly developed county, while smaller lines and spots follow roads and scattered developed locations.
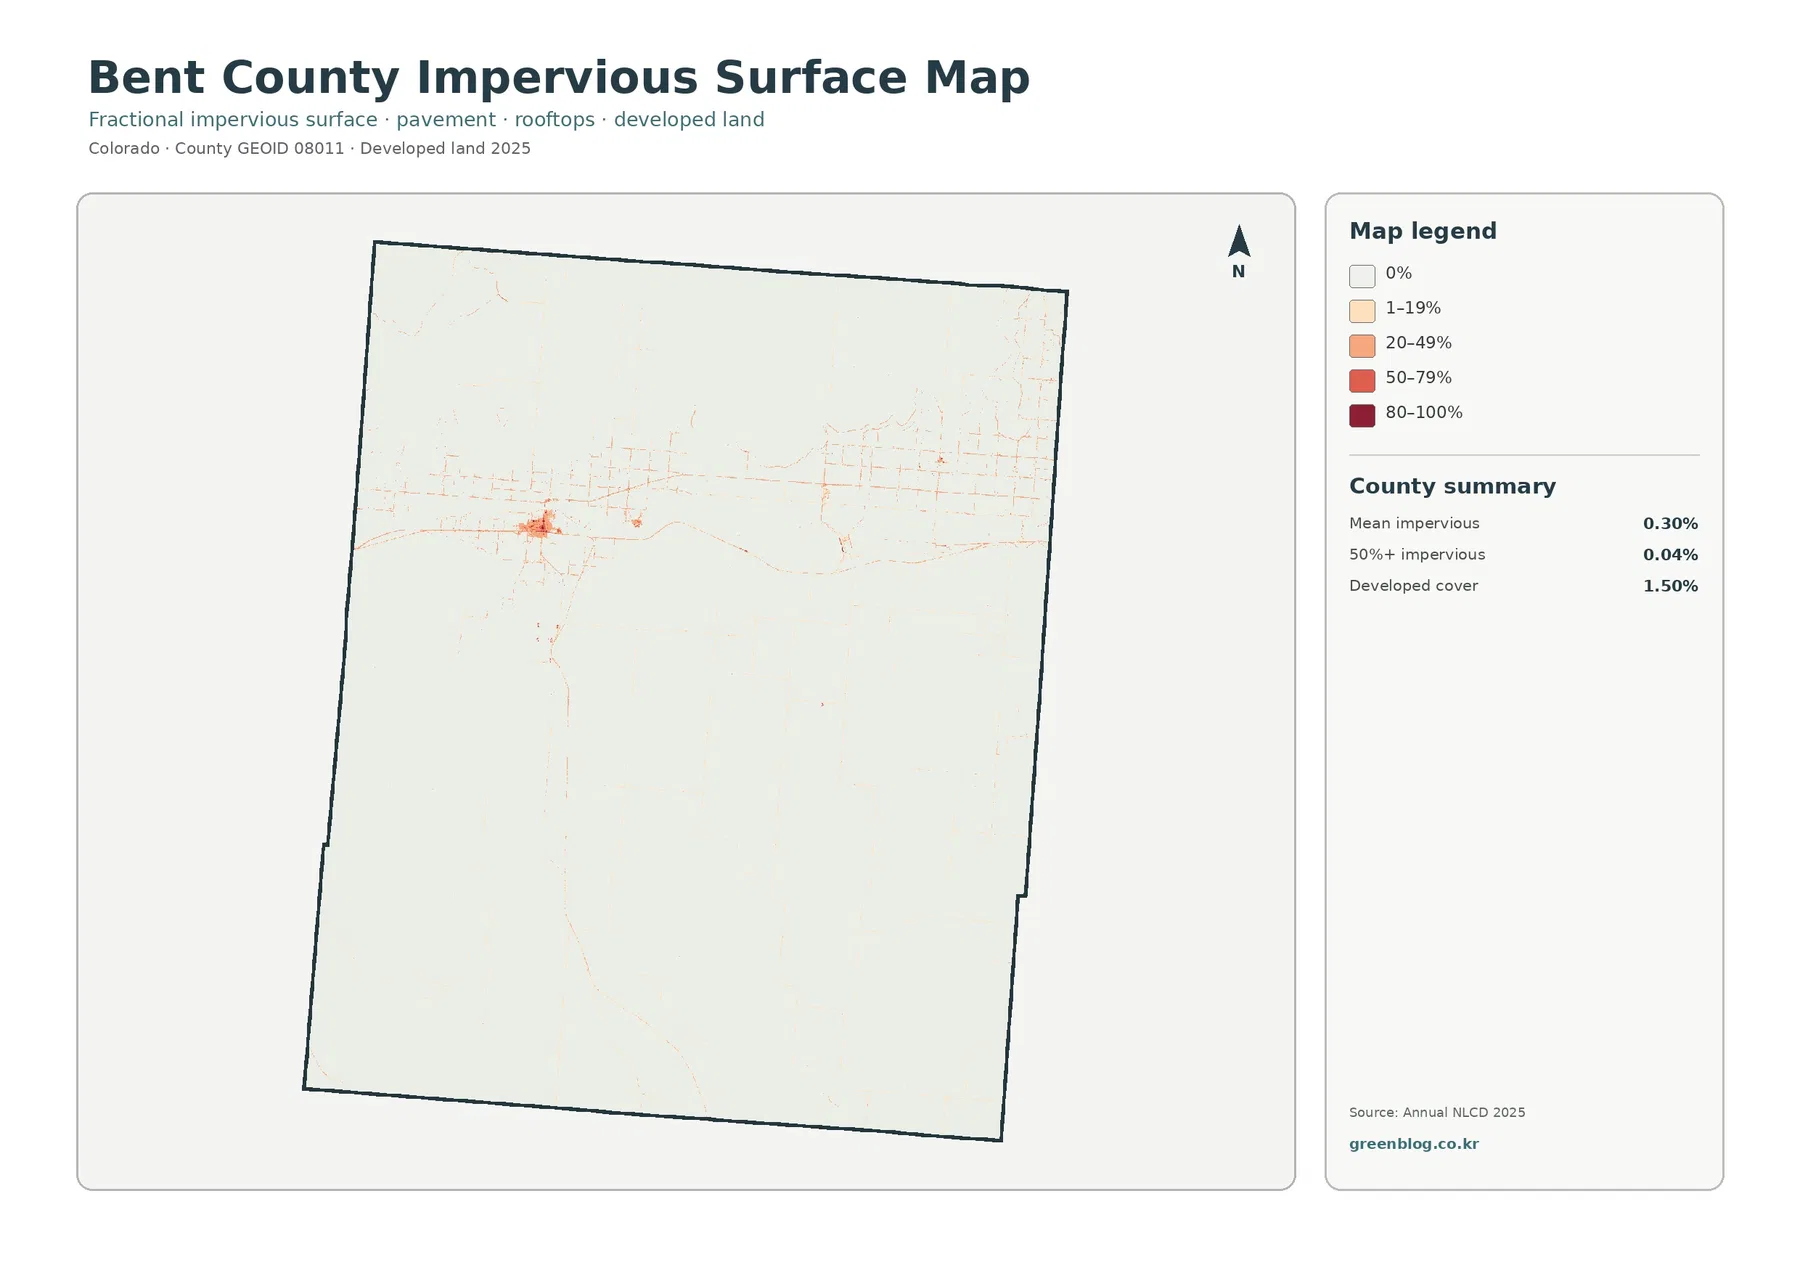
Developed cover in the general land-cover summary is 1.50%, which should not be treated as the same measurement as 0.30% mean impervious surface. A developed land-cover class can include vegetation mixed with buildings or roads, particularly at lower development intensities. The impervious product instead estimates how much of a cell is physically covered by hard surfaces. A lightly developed residential or roadside cell can therefore be developed land without being mostly impervious.
At county scale, this layer is best for identifying concentrations rather than counting individual structures. A raster cell may contain a road, yard, building, and open ground at the same time. The color represents a fraction within that grid cell, not a surveyed outline of a roof or pavement edge. Anyone needing exact road widths, building footprints, addresses, or parcel-level development should use dedicated infrastructure or cadastral data.
The long-term comparison highlights farm-class and wetland differences
The 1985–2025 change layer reports a class difference across 8.04% of Bent County. Agricultural loss is the largest labeled component at 5.10%. Change to developed accounts for 0.26%, other differences for 1.89%, and forest loss is shown as 0.00%. Yellow agricultural-difference patches appear in several farm blocks north of the river, around parts of the river corridor, and in scattered southern and eastern locations.
“Agricultural loss” is a classification term in this comparison, not a direct statement that 5.10% of Bent County farms disappeared. It identifies cells that no longer match the agricultural class across the two endpoints. A field can change classification because of fallow conditions, vegetation at the observation time, a real land-cover conversion, or differences in how the data were classified. The map itself notes that class differences may include classification variation.
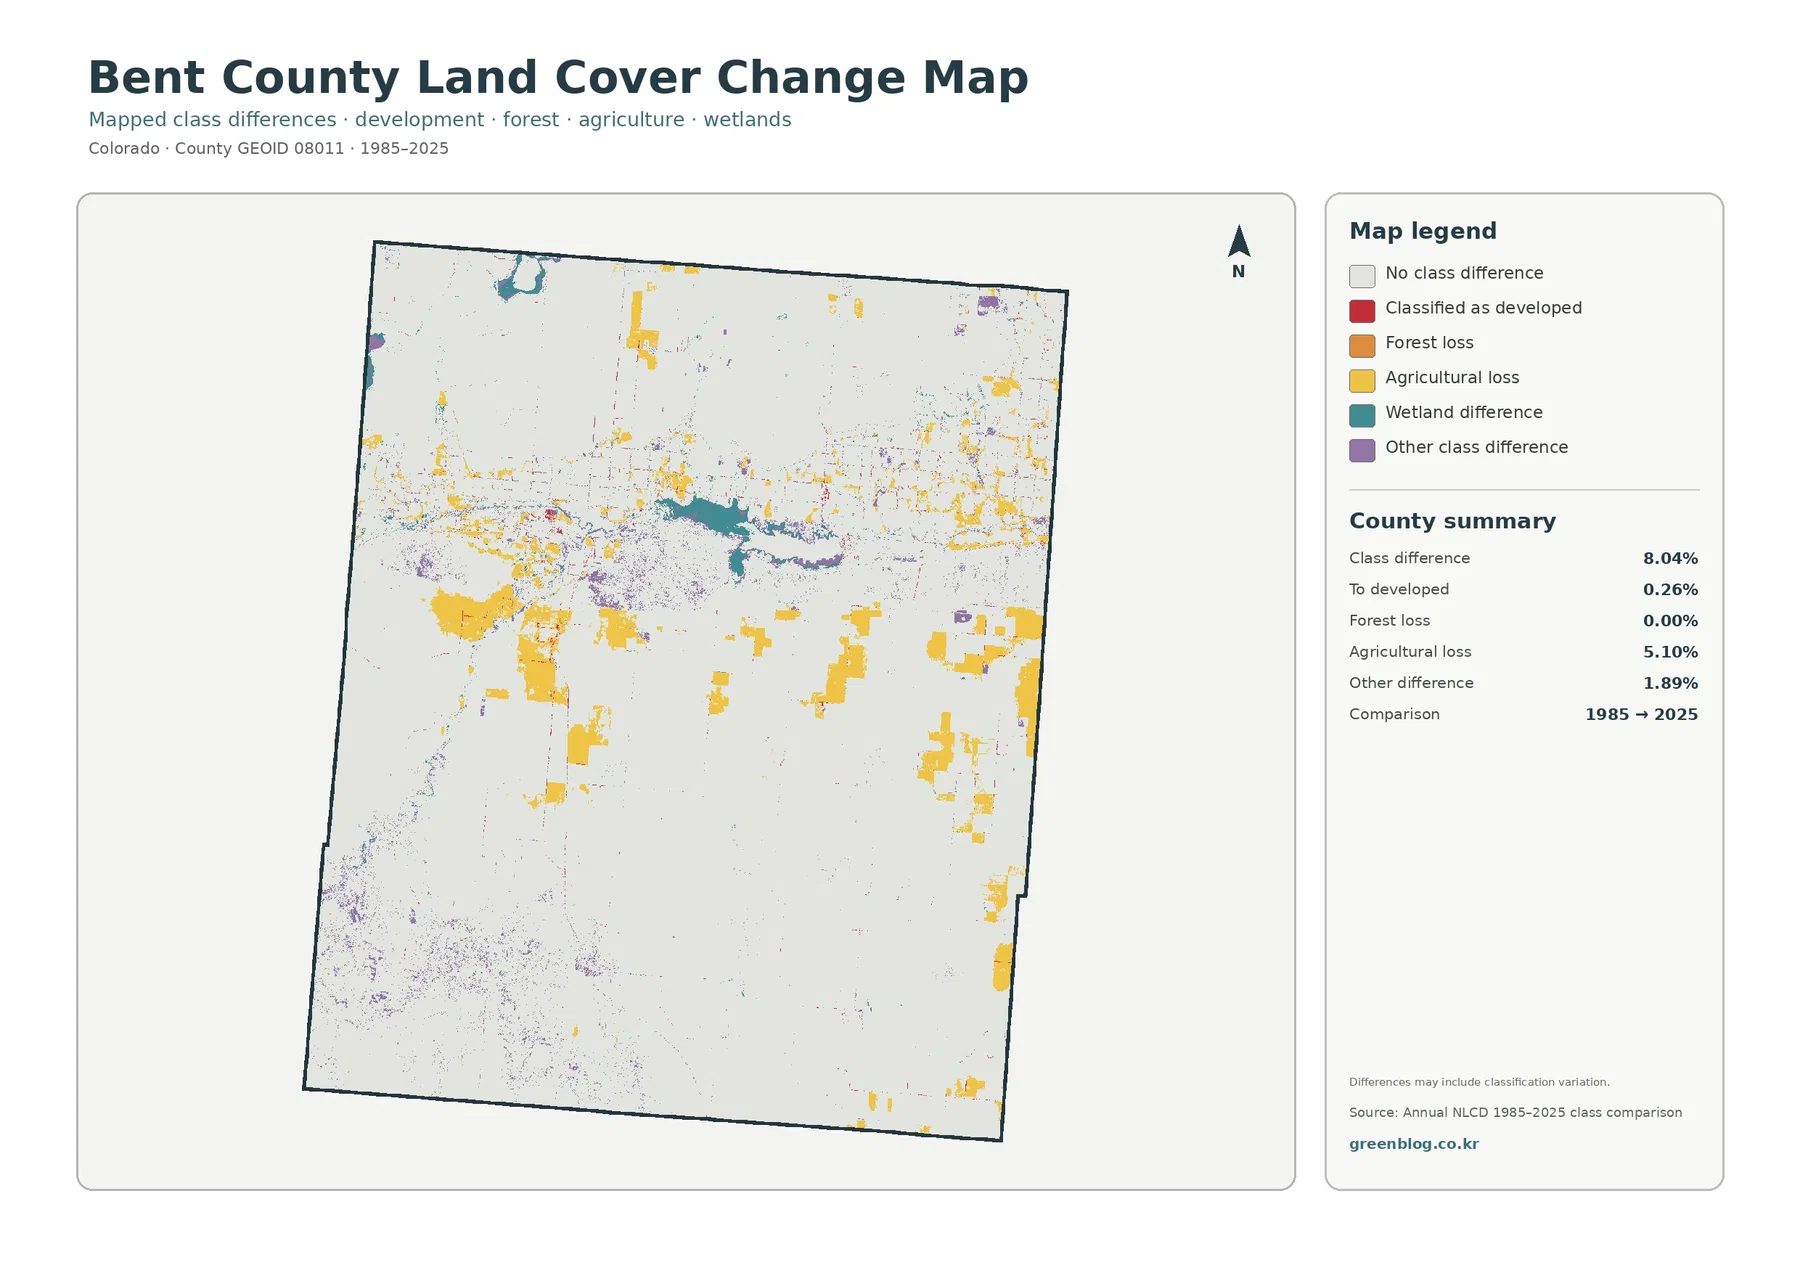
Wetland-difference colors are also visible around the Arkansas River and John Martin Reservoir. Those patches are worth examining because shoreline and river-corridor conditions can differ between mapped dates, yet the change color alone does not explain why. A water-level change, vegetation change, classification boundary, or true land-cover transition may all influence what appears in a two-date comparison. The current 2025 map should be placed beside the change layer before drawing conclusions about the present condition.
The 8.04% total difference means most cells retained the same broad class between the two mapped endpoints, but it does not mean the landscape was unchanged every year in between. The layer does not identify the exact year of a transition. If a research question depends on timing, intermediate Annual NLCD years are needed to determine whether the difference developed gradually, appeared only temporarily, or persisted to the latest map.
Use John Martin Reservoir as a reference point when comparing all four maps
A simple way to compare the set is to locate John Martin Reservoir first. In the general land-cover map, it anchors the water and wetland pattern. In the forest-and-farmland view, surrounding agricultural blocks and open grass/shrub cover become easier to separate. The impervious map then shifts attention away from the reservoir toward Las Animas and smaller developed corridors, while the change layer returns attention to farm fields and wetland edges where classifications differ between 1985 and 2025.
This approach keeps each map tied to a specific question. The current land-cover layer answers what broad surface classes dominate now. The farm-focused view simplifies the boundary between cultivated land and open cover. The impervious layer isolates the intensity of hard surfaces, and the change product identifies cells whose broad class differs across the two endpoints. Using them together prevents a single percentage or color from being asked to answer a question it was not designed for.
Bent County Extension lists agriculture and natural resources among its local program areas, while the Bent Conservation District describes work related to soil, water, farmland, rangeland, woodland, wildlife, and other renewable resources. These organizations provide useful context for why a countywide land-cover set can be informative. The maps can frame questions about the river corridor, grassland, farming, and developed areas, but farm management, irrigation, soil treatment, conservation projects, and property decisions require more detailed local information.
For a classroom or presentation, the strongest comparison is often between the 81.62% grassland background and the narrow corridor of more varied cover along the Arkansas River. Students can then add the 6.77% agriculture and 2.64% wetland figures to explain why relatively small classes still matter when they cluster in a recognizable location. The Las Animas impervious cluster provides a third contrast, showing how a very small countywide hard-surface percentage can still create a clear local center.
Classification scale, mixed pixels, and the map date
Annual NLCD is raster data, which means the landscape is represented by a grid of cells. A cell is one small square in that grid. If grass, a field edge, a road, and a wet ditch all occur inside the same cell, the final land-cover class simplifies that mixture. This is why narrow features may look wider or less continuous than they do on the ground and why boundaries should not be interpreted as surveyed parcel lines.
A mixed pixel is simply a cell containing more than one real-world surface. Mixed pixels are especially relevant along the Arkansas River, where water, wetlands, agriculture, roads, and open grass can occur close together. The classification is useful at county and landscape scale, but it cannot resolve every fence line, irrigation ditch, shoreline detail, or building. Specialized hydrology, parcel, or infrastructure data should be used when those smaller features are the subject of the work.
The current maps are labeled 2025, so they describe the classification for that mapped year rather than live conditions. Fields may rotate between crops and fallow cover, vegetation can respond to seasonal conditions, and reservoir or river levels can vary. The 1985–2025 change map is also an endpoint comparison. It locates long-term class differences but should not be described as a year-by-year record of everything that happened during the forty-year span.
Each original JPG in the supplied package is 2480×1754 pixels. The asset manifest does not mark these source files as meeting its A3 high-resolution reference, so the download is offered at the provided original size without claiming a larger print specification. They are well suited to on-screen reference, reports, lessons, and ordinary document placement; very large prints should be planned only after checking the pixel dimensions against the intended physical size.
Download the four Bent County JPG maps
The ZIP contains the four original JPG maps represented on this page: current land cover, forest and farmland, impervious/developed land, and the 1985–2025 land-cover comparison. Each file is 2480×1754 pixels and is provided at the original package resolution rather than being enlarged for the download.
Frequently Asked Questions
Why are wetlands so visible when they cover only 2.64% of Bent County?
They are concentrated along the Arkansas River and around John Martin Reservoir instead of being spread evenly across the county. That concentration creates a recognizable teal corridor and shoreline pattern even though wetlands occupy a small share of the total area. Water is a separate class at 0.56%, so the blue reservoir surface and the teal wetland edges should be read separately.
Why is developed cover 1.50% while mean impervious surface is only 0.30%?
The two products measure different things. Developed land cover can include cells where buildings or roads are mixed with vegetation and open ground. Impervious surface estimates the hard, water-resistant fraction within each cell. A low-density developed area can therefore count as developed without having a high impervious percentage.
Does the 5.10% agricultural-loss class mean Bent County lost 5.10% of its farms?
No. It is a land-cover classification difference between 1985 and 2025, not a farm census or property record. The value does not identify farm closures, ownership changes, or the cause of a class transition. Separate agricultural statistics and local records are needed for those questions.
Map File Information
The ZIP contains four original Bent County JPG maps: current land cover, forest and farmland, impervious/developed land, and the 1985–2025 land-cover comparison.
- File Type: Four JPG files in one ZIP archive
Related Maps
- Adams County Colorado Land Cover Map
- Alamosa County Colorado Land Cover Map
- Arapahoe County Colorado Land Cover Map
Sources and References
- MRLC Annual NLCD Data — official access to Annual NLCD land-cover products.
- USGS Annual NLCD Land Cover Classification — class definitions and interpretation guidance.
- U.S. Census Bureau TIGER/Line Shapefiles — official county-boundary reference data.
- Colorado Parks and Wildlife — John Martin Reservoir — official state information for the reservoir in Bent County.
- Colorado State University Extension — Bent County Agriculture & Natural Resources — local agriculture and natural-resource program information.
- Bent Conservation District — local soil, water, farmland, rangeland, and conservation information.
Green Map creates custom-edited map images using open geographic data sources such as geoBoundaries, Natural Earth, OpenStreetMap, and government open data.
These maps are edited visual materials, not raw data files, and are provided for education, documents, presentations, and graphic reference.