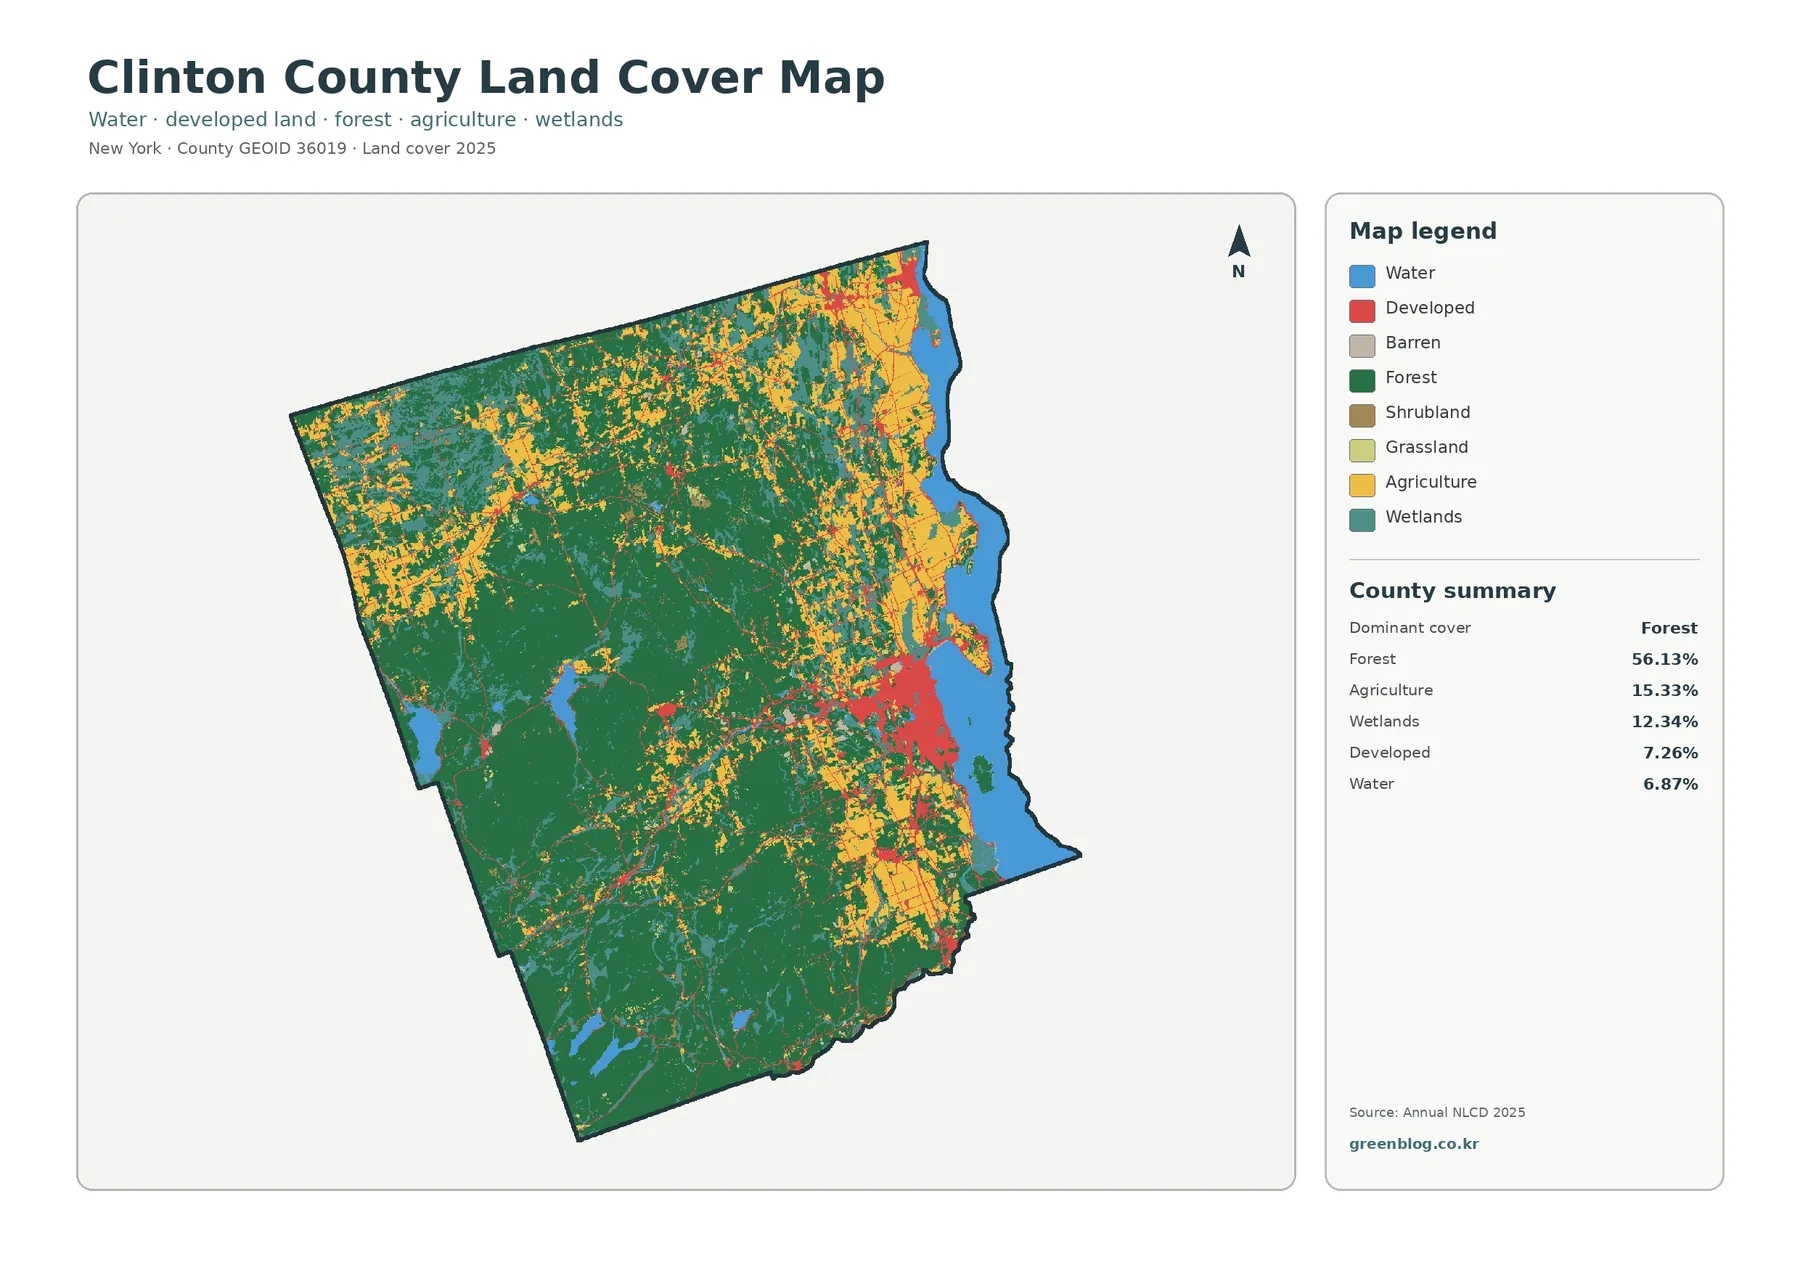
The Archuleta County Colorado Land Cover Map set covers a mountain county where forest is the defining surface pattern and development occupies a much smaller footprint. The 2025 summary places forest at 65.30% of the county and shrubland at 24.10%, while the strongest developed cluster appears around Pagosa Springs. Four views are included here: general land cover, forest and farmland, impervious surface and developed land, and mapped class change from 1985 to 2025.
The maps can be read on the page and the four original JPG files are available together in one ZIP below. They work best as county-scale reference graphics for comparing broad surface cover, settlement concentration, open land, wetlands, water, and mapped change. Land cover is not the same thing as zoning, ownership, parcel boundaries, or legal land use; it classifies what is covering the ground in the source imagery.
Table of Contents
Why forest defines the county view
Archuleta County’s own description places the county where high-desert plateau country meets the Rocky Mountains to the north and east. That setting fits the strong pattern in the supplied maps. Dark green forest covers broad areas across the north, east, center, and southeast, while shrubland and more open cover break up the forest in the central and southern portions. The result is not a simple north-versus-south split. Instead, large forest blocks surround irregular belts and pockets of shrub, grass, agriculture, wetland, and development.
The county also identifies communities beyond the Town of Pagosa Springs, including Arboles, Chromo, and Aspen Springs. Those names are useful context because the developed landscape is dispersed rather than occupying a large continuous metropolitan area. The Forest Service describes the San Juan National Forest as spanning southwestern Colorado from high-desert mesas to alpine peaks, with a Pagosa Springs district office. That regional setting helps explain why forest is so visually dominant here, although the land-cover maps do not show public-land ownership or national-forest boundaries.
A small impervious footprint with a clear Pagosa Springs core
Impervious surface means pavement, rooftops, parking areas, and other hard surfaces that do not readily absorb rainwater. The countywide mean in this map is only 0.52%, and just 0.09% of the mapped area is at least 50% impervious. Developed cover accounts for 2.53% of the 2025 land-cover summary. Those low percentages matter because they explain the almost empty appearance of the impervious map outside the principal settlement areas.
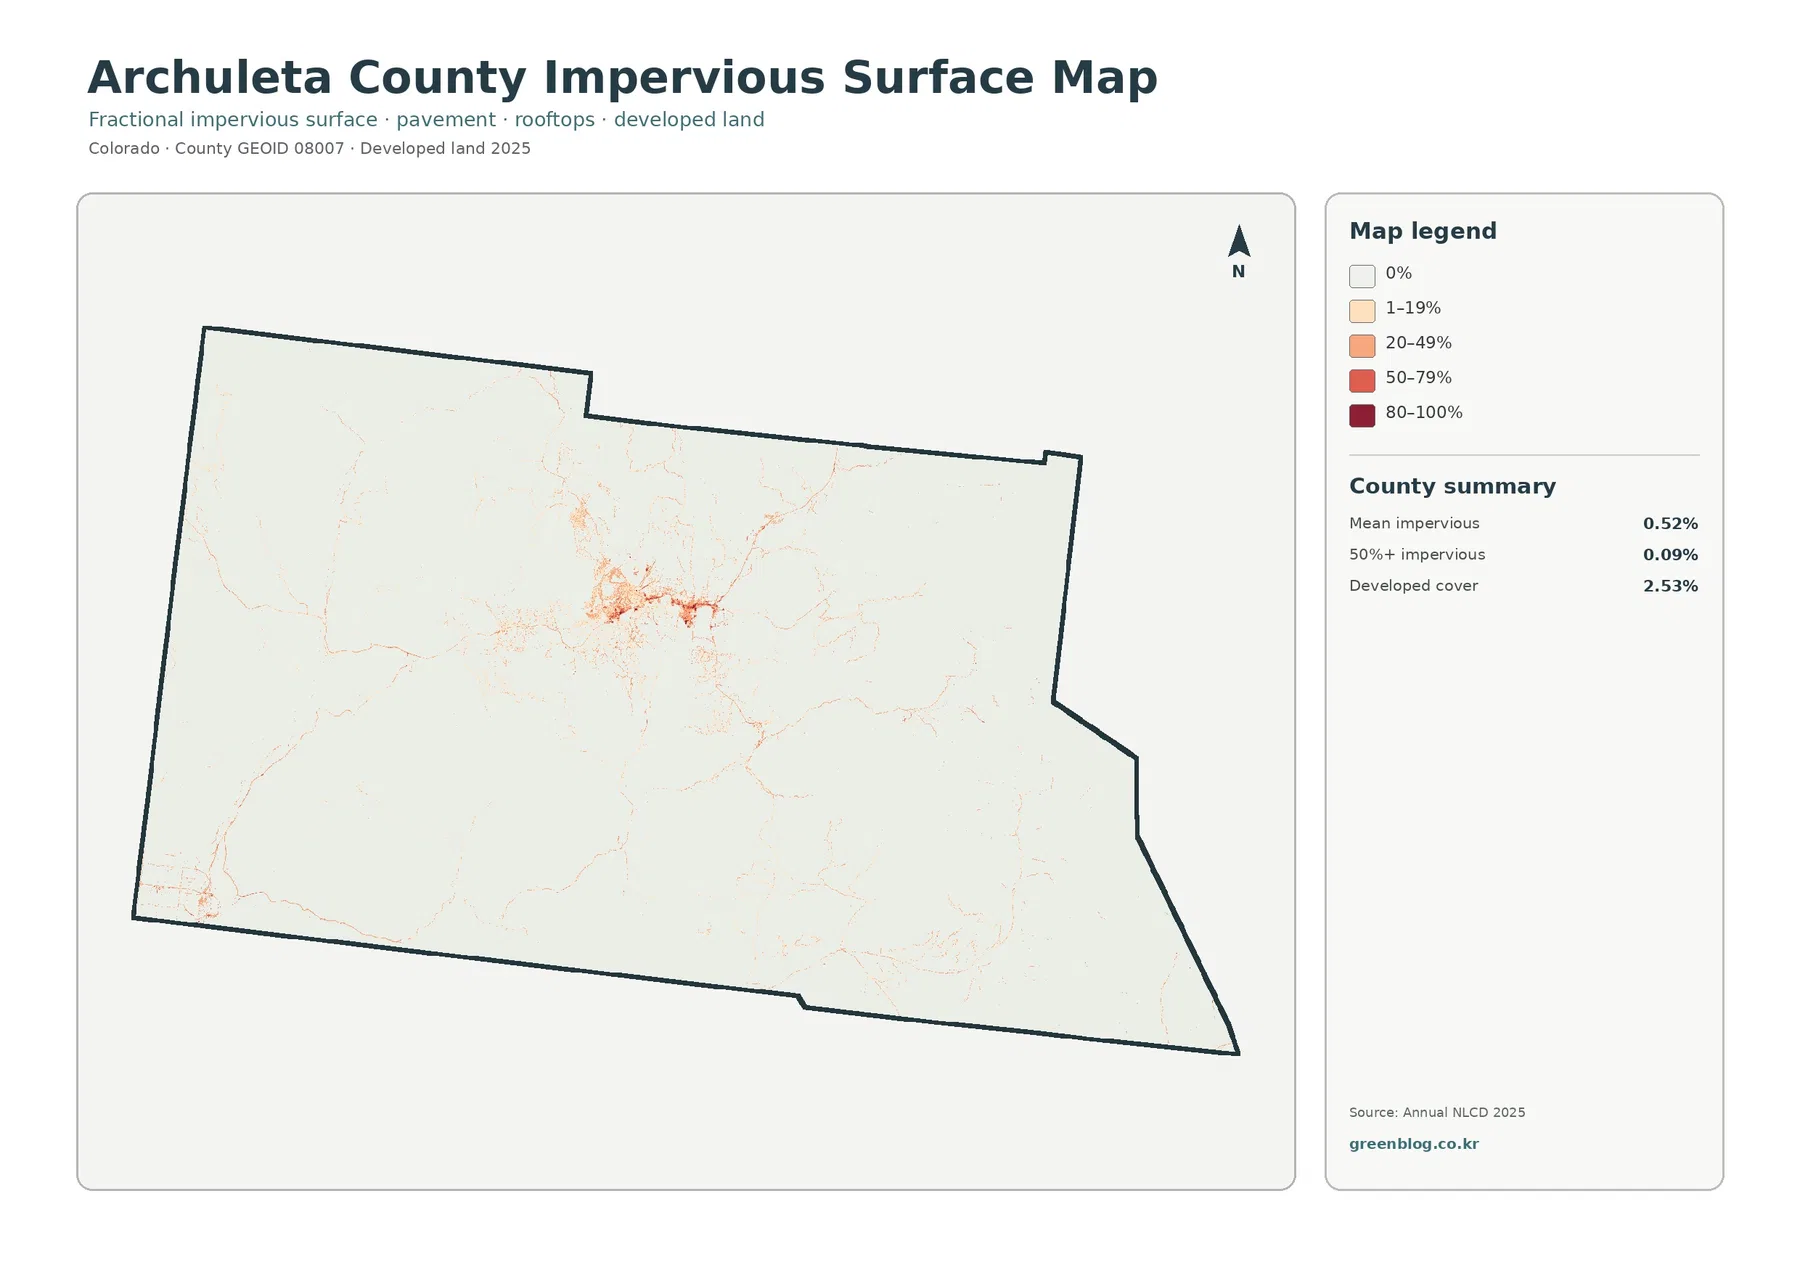
Pagosa Springs stands out as the main cluster of orange and red tones, and thin traces extend outward along developed corridors. A much smaller concentration is visible near the southwestern edge. The contrast is stronger on this map than on the general land-cover view because forest, shrubland, and other natural classes have been visually suppressed. The map therefore answers a narrower question: where are hard surfaces concentrated within a county that is otherwise overwhelmingly low in impervious cover?
This is useful for broad watershed or settlement comparisons, but it is not a building footprint map. A thin mapped line should not be treated as an exact road width, and a lightly colored cell does not reveal the precise amount of pavement on an individual property. The strongest colors indicate relatively higher impervious fractions at the raster-cell scale. They do not, by themselves, show traffic volume, zoning intensity, future growth, or whether a parcel can be developed.
Forest and farmland are not balanced halves of the landscape
The forest-and-farmland view makes one of Archuleta County’s strongest contrasts easier to see. Forest remains at 65.30%, while agriculture is only 1.72%. Grassland is 2.51%, shrubland 24.10%, wetlands 2.73%, and mapped water 0.22%. In other words, the open areas visible among the forest are not simply broad agricultural plains. Much of that nonforest cover is shrub or grass, with farming concentrated in smaller areas.
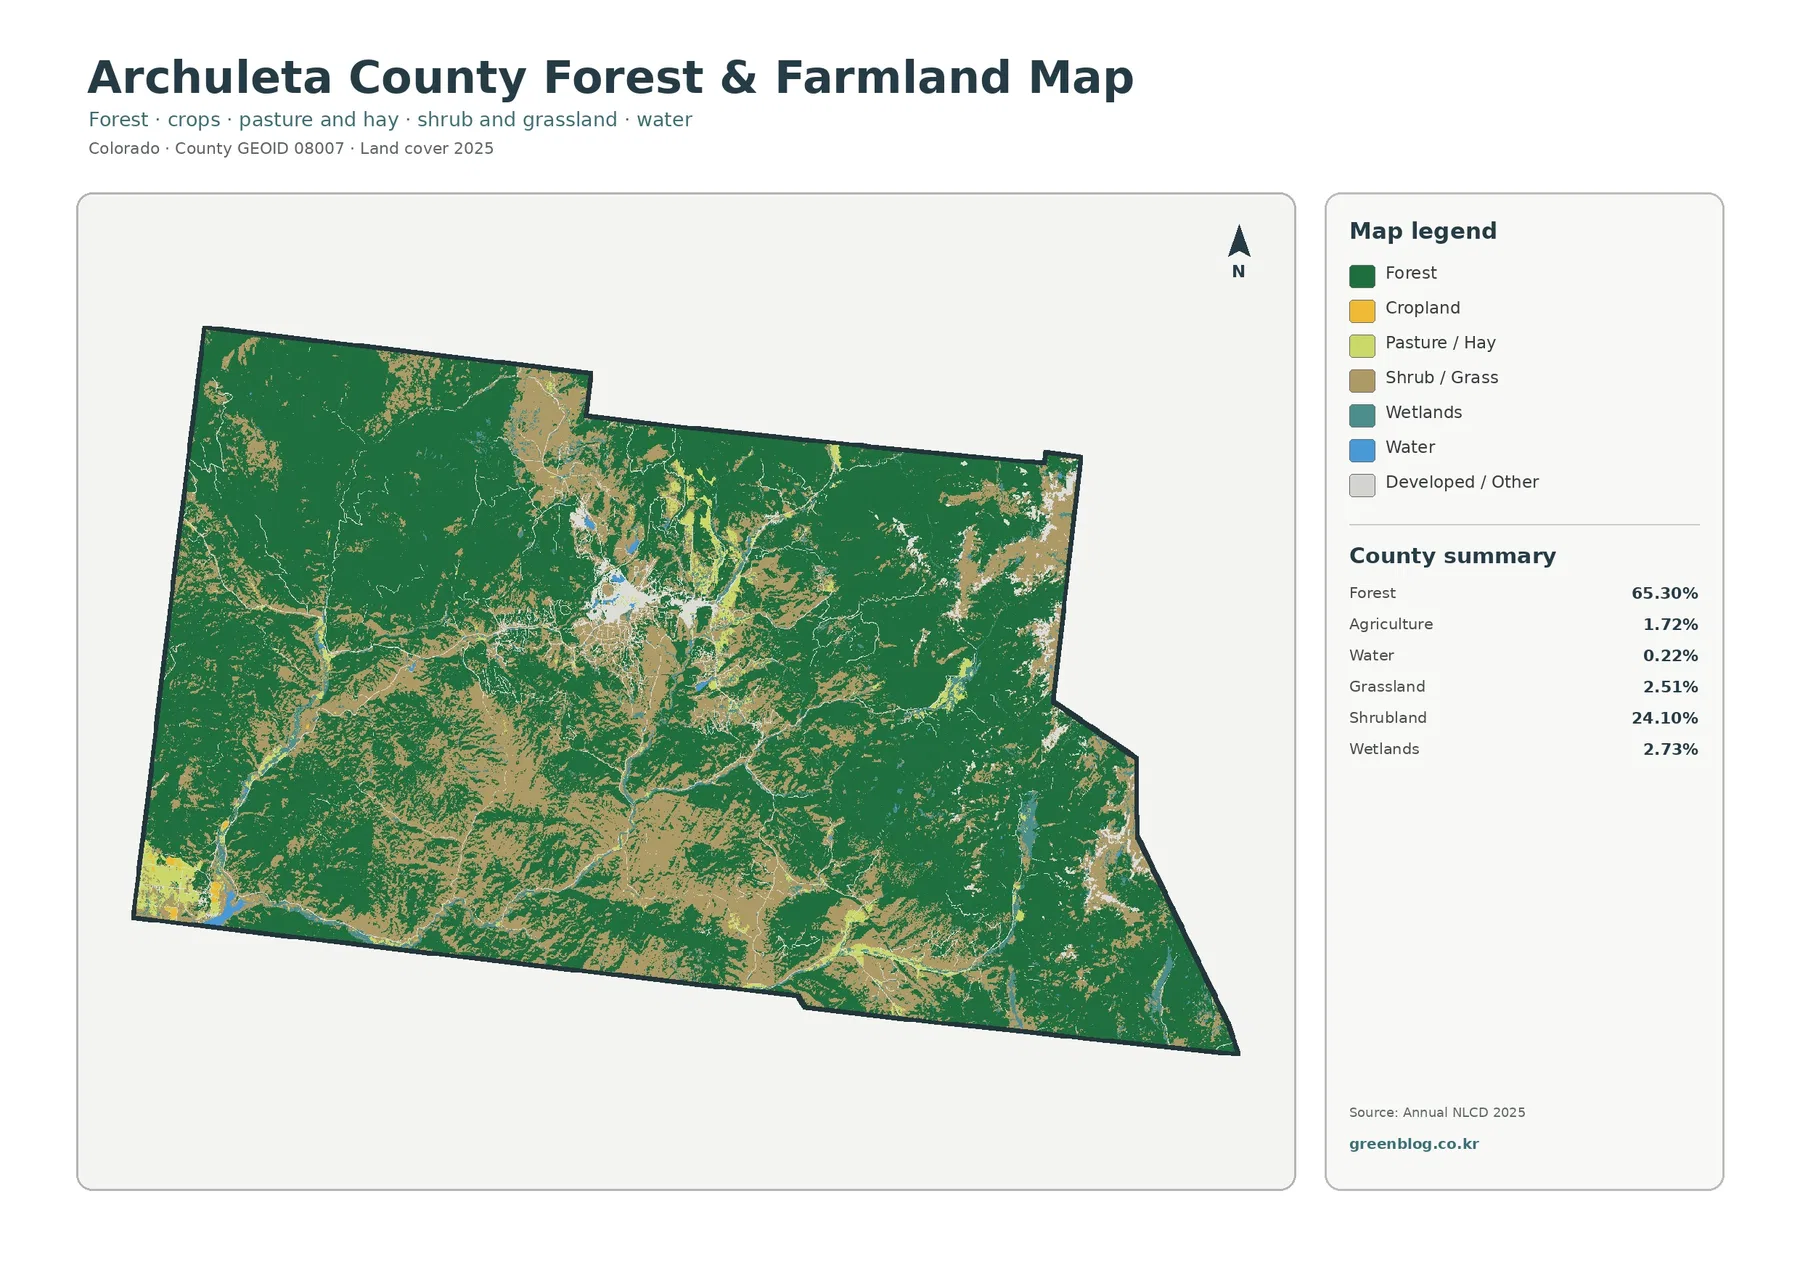
Agricultural colors appear in limited strips and patches, especially where the landscape is more open around the central portion and in parts of the south and southwest. Forest remains much more continuous in the northern and eastern portions. The map is helpful for classroom comparisons because it prevents a common visual mistake: assuming that every tan or pale opening in a mountain county is farmland. Here, shrubland and grassland together occupy far more area than agriculture, and wetlands add another distinct surface type that may be narrow enough to disappear when the map is reduced too much.
It is also important to keep “agriculture” in the land-cover sense separate from agricultural zoning or ownership. Annual NLCD classifies the observed surface, while Archuleta County’s Planning Department administers land-use regulations, zoning, subdivision, mining, and floodplain rules through a separate planning system. A field-colored cell on this map does not establish a legal right to farm, and a forest-colored cell does not establish who owns the land. For site-specific questions, county planning or parcel records are the appropriate next source.
What the 1985–2025 change layer actually records
The change map compares mapped classes in 1985 and 2025 rather than showing a continuous forty-year history. A class difference is recorded across 13.08% of the county. Of that total, 0.82% is mapped as becoming developed, 3.26% is identified as forest loss, and 0.33% as agricultural loss. The largest named summary is “other difference” at 8.38%, a category that deserves attention because it warns against reading every colored cell as a simple story of construction or clearing.
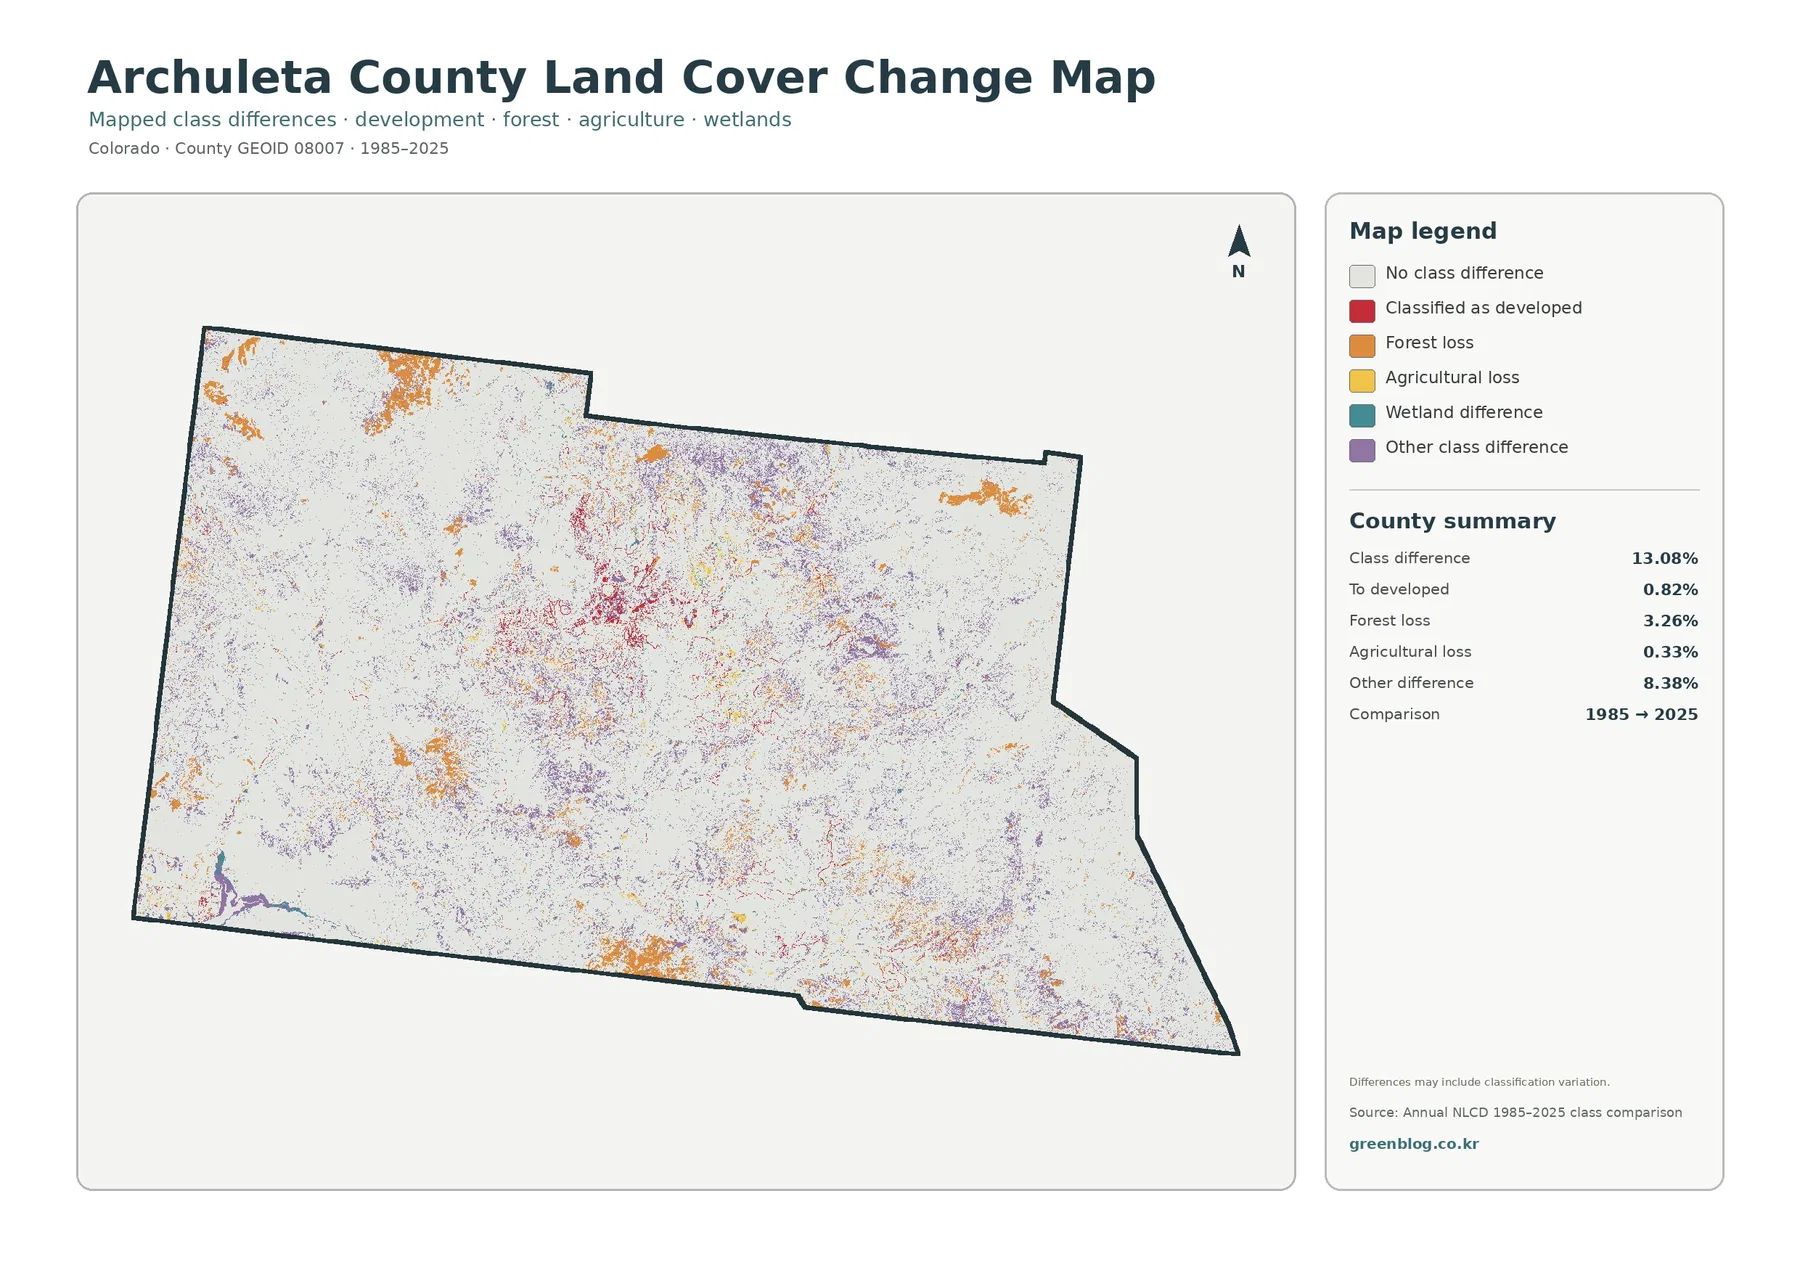
Development-related change is most noticeable around the Pagosa Springs area, where many small red marks form a denser cluster than elsewhere. Forest-loss colors occur in scattered patches, including portions of the northwestern and northern county as well as smaller southern areas. Other class differences are spread much more widely. That pattern makes the layer useful for locating places that merit a closer look, but it does not establish why a class changed.
Fire, timber activity, vegetation succession, new construction, changing water conditions, imagery differences, and classification methods can all influence what appears between two mapped dates. The supplied map itself notes that differences may include classification variation. A reader investigating one patch should therefore compare additional imagery or agency records before attaching a cause to it. The strongest use of this layer is screening: it points to areas where the 1985 and 2025 classifications do not match.
Reading the complete 2025 land-cover pattern
The general 2025 map brings all of the major classes back into one view. Forest leads at 65.30%, shrubland follows at 24.10%, then wetlands at 2.73%, developed land at 2.53%, and grassland at 2.51%. The visual balance closely matches those numbers. Green forest dominates, shrubland forms broad irregular openings, and the remaining classes appear as smaller patches or narrow features. Because development is concentrated rather than evenly spread, its 2.53% share remains easy to find around Pagosa Springs.
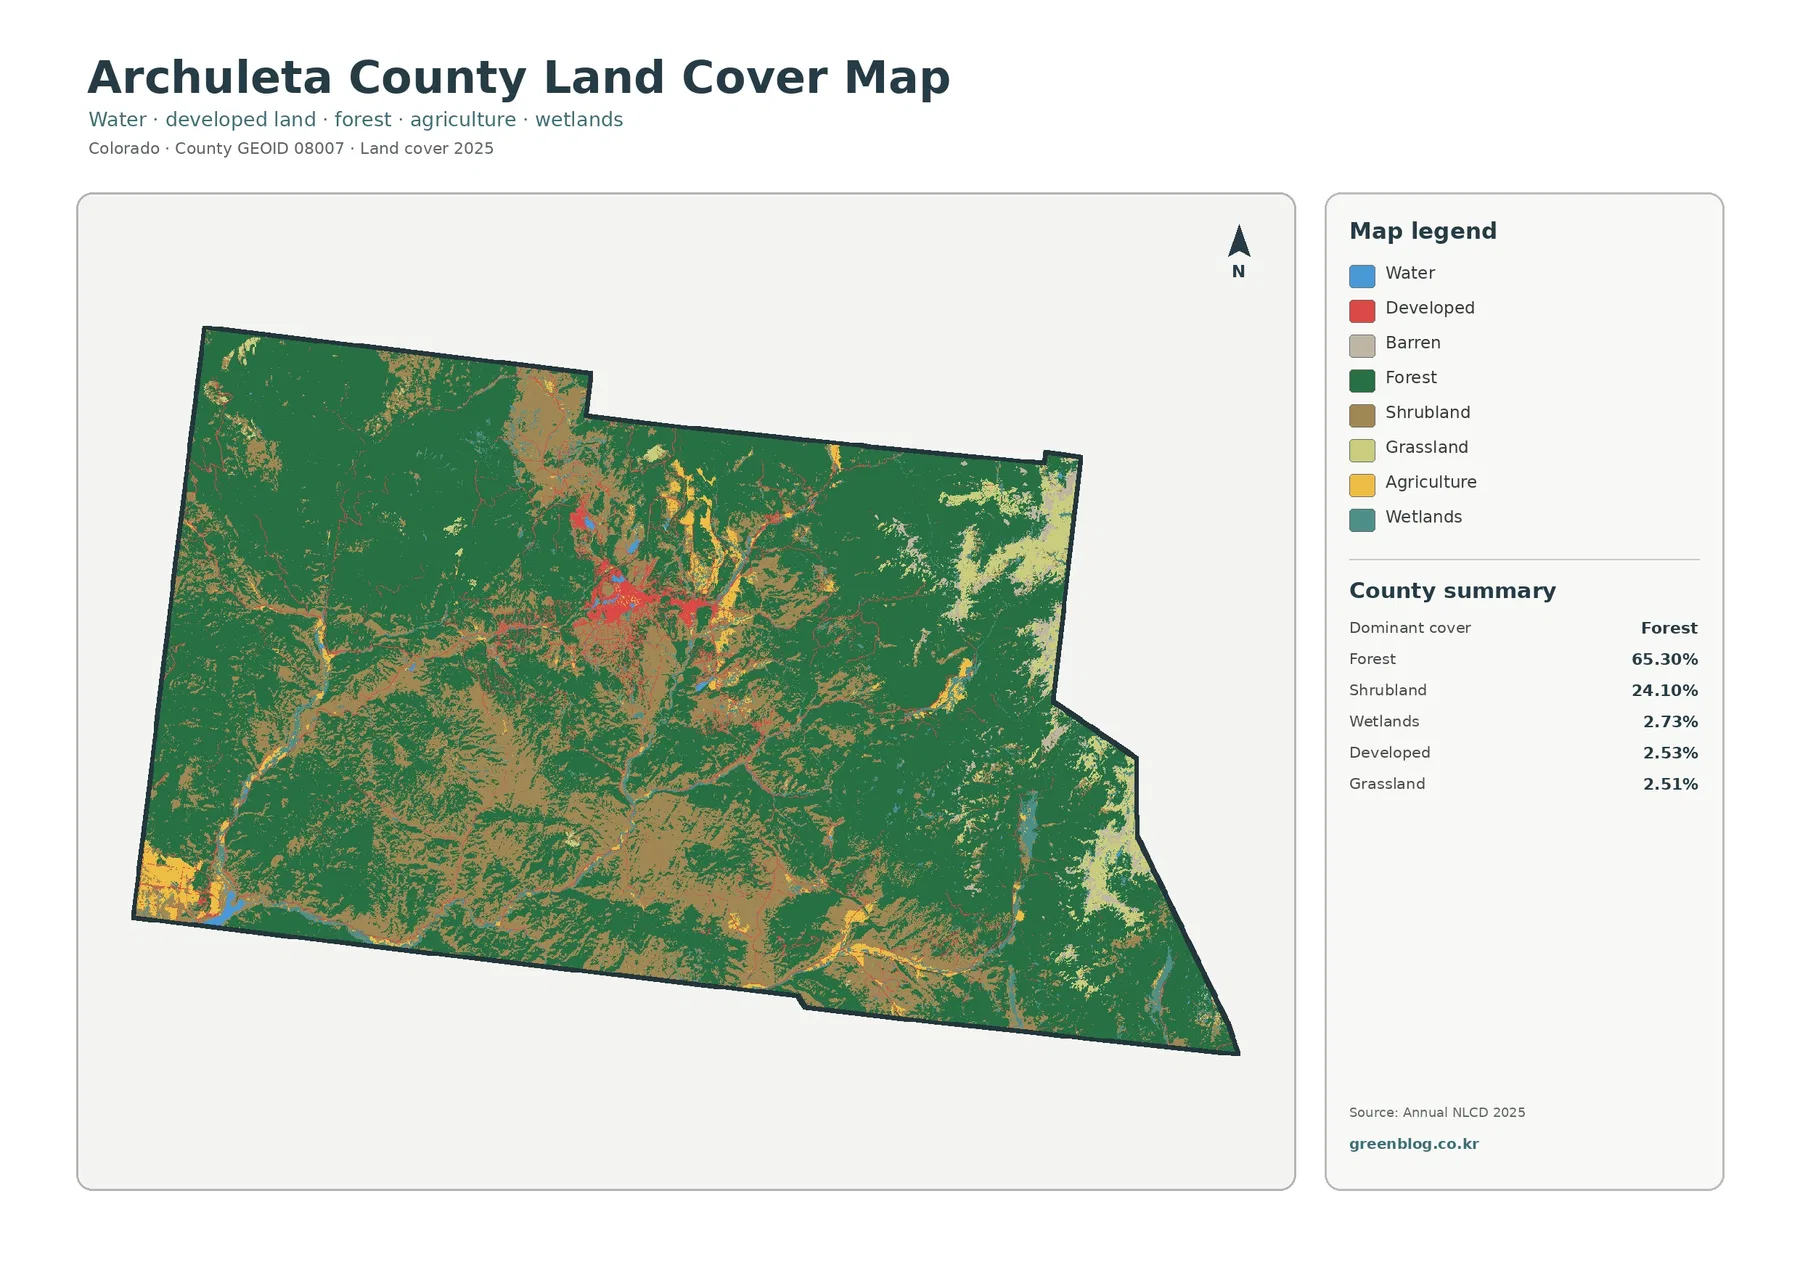
Several smaller classes become important when location matters more than countywide percentage. Water is limited in area, yet mapped blue features can be distinct near the county edges and within the interior. Wetlands appear in narrow or broken patterns that are easier to miss at a small display size. Agricultural colors are similarly localized. This is why the general map should not be read only from the summary table. The table tells how much of each class exists, while the map shows whether that class forms one cluster, many scattered patches, a narrow corridor, or a broad continuous block.
For Archuleta County, that distinction is especially useful. Forest and shrubland cover so much area that a percentage-only description could make the county sound uniform. The map shows otherwise: the Pagosa Springs area contains a more complex mixture of development and open cover, while large forest blocks remain prominent elsewhere. Smaller wet and agricultural features add local variation. The county’s overall identity is strongly forested, but the detailed pattern changes noticeably from one part of the boundary to another.
Choosing the right file for a report, lesson, or comparison
Start with the general land-cover map when the goal is to introduce Archuleta County as a whole. It keeps forest, shrubland, developed land, grassland, agriculture, wetlands, water, and other visible classes in one legend. Move to the forest-and-farmland map when the question is specifically about the balance between wooded land and more open or agricultural cover. The impervious map is the clearer choice for a discussion centered on settlement and hard surfaces. The change map should be reserved for a time comparison because its colors describe class differences, not current land cover.
Using the maps in that sequence can also make a presentation easier to follow. A first slide can establish the forest-dominated county pattern, a second can isolate agricultural and open areas, and a third can zoom conceptually into the limited developed footprint. The change map then adds a historical comparison without confusing it with the 2025 surface classes. For a watershed lesson, the general and impervious views can be paired to discuss how developed surfaces are concentrated; for habitat or landscape lessons, the forest-and-farmland map provides a simpler visual separation.
Four original JPG maps in one download
The on-page WebP images are optimized for quick viewing, while the download package contains the four original JPG files. Each source JPG is 2480×1754 pixels. The asset manifest does not mark these files as meeting the package’s A3 high-resolution reference, so they should be used at their native size rather than enlarged aggressively for oversized printing. They are well suited to reports, classroom handouts, slide decks, county comparisons, and reference collections where the original map layout and legend need to stay intact.
Scale, classification, and limits of the maps
Annual NLCD products are raster datasets, meaning the landscape is represented as a grid of cells. A cell is assigned a class based on the source data and classification process, but real landscapes do not always divide into neat squares. A forest edge may include a road, a house, grass, and trees within a small area. When more than one surface type contributes to a cell, the mapped class can simplify what is actually on the ground. This is often described as a mixed-pixel issue.
That limitation is most important when a reader zooms in too far. These maps are county-scale references, not parcel surveys. They should not be used to determine a property line, wetland jurisdiction, building eligibility, zoning district, or the exact percentage of pavement on a specific lot. Archuleta County’s Planning Department maintains the official planning and land-use framework, while ownership and parcel questions belong with the county’s property records. Forest management boundaries also require the appropriate Forest Service maps rather than an NLCD class alone.
The date matters as well. The general, forest/farmland, and impervious views summarize 2025 conditions as supplied in this package. Changes that happened after the observation period may not appear. The 1985–2025 layer compares two mapped years and does not reveal the exact year when a change happened between them. For current decisions, the maps are best treated as a broad visual starting point and then checked against newer imagery or the responsible agency’s records.
Frequently Asked Questions
What is the dominant land cover in Archuleta County?
Forest is the dominant 2025 class at 65.30%, followed by shrubland at 24.10%. Together they account for most of the mapped county. Developed land, wetlands, and grassland are each below 3% in the supplied summary, so their importance is easier to understand by looking at where they occur rather than by percentage alone.
Which map is best for seeing development around Pagosa Springs?
The impervious surface and developed-land map is the clearest choice. Most of Archuleta County has very low impervious cover, so the Pagosa Springs cluster and connected developed traces stand out strongly. The general 2025 land-cover map is useful as a companion because it shows how that development sits within a much larger forest-and-shrub landscape.
Does the 13.08% class difference mean that 13.08% of the county was developed or cleared?
No. The 13.08% figure includes every mapped class difference between 1985 and 2025. Only 0.82% is summarized as changing to developed and 3.26% as forest loss; 0.33% is agricultural loss and 8.38% falls into other differences. Classification variation can be part of the result, so the change map should be used to identify areas for follow-up rather than to assign a cause automatically.
Sources and Reference Links
- MRLC Annual NLCD Data — Official access point for annual U.S. land-cover and related raster products.
- USGS Annual NLCD Land Cover Classification — Descriptions of the mapped land-cover classes and how the national classification is organized.
- Archuleta County: Living in Archuleta County — County background on its Rocky Mountain and high-desert setting and local communities.
- Archuleta County Community Plan — Official county planning context that should be kept separate from land-cover classification.
- U.S. Forest Service: San Juan National Forest — Regional forest context for southwestern Colorado and the Pagosa Springs district.
Map File Information
The ZIP package contains all four original Archuleta County land-cover JPG maps.
- File Type: Four JPG files in one ZIP archive
Related Maps
- Adams County Colorado Land Cover Map
- Alamosa County Colorado Land Cover Map
- Arapahoe County Colorado Land Cover Map
Green Map creates custom-edited map images using open geographic data sources such as geoBoundaries, Natural Earth, OpenStreetMap, and government open data.
These maps are edited visual materials, not raw data files, and are provided for education, documents, presentations, and graphic reference.