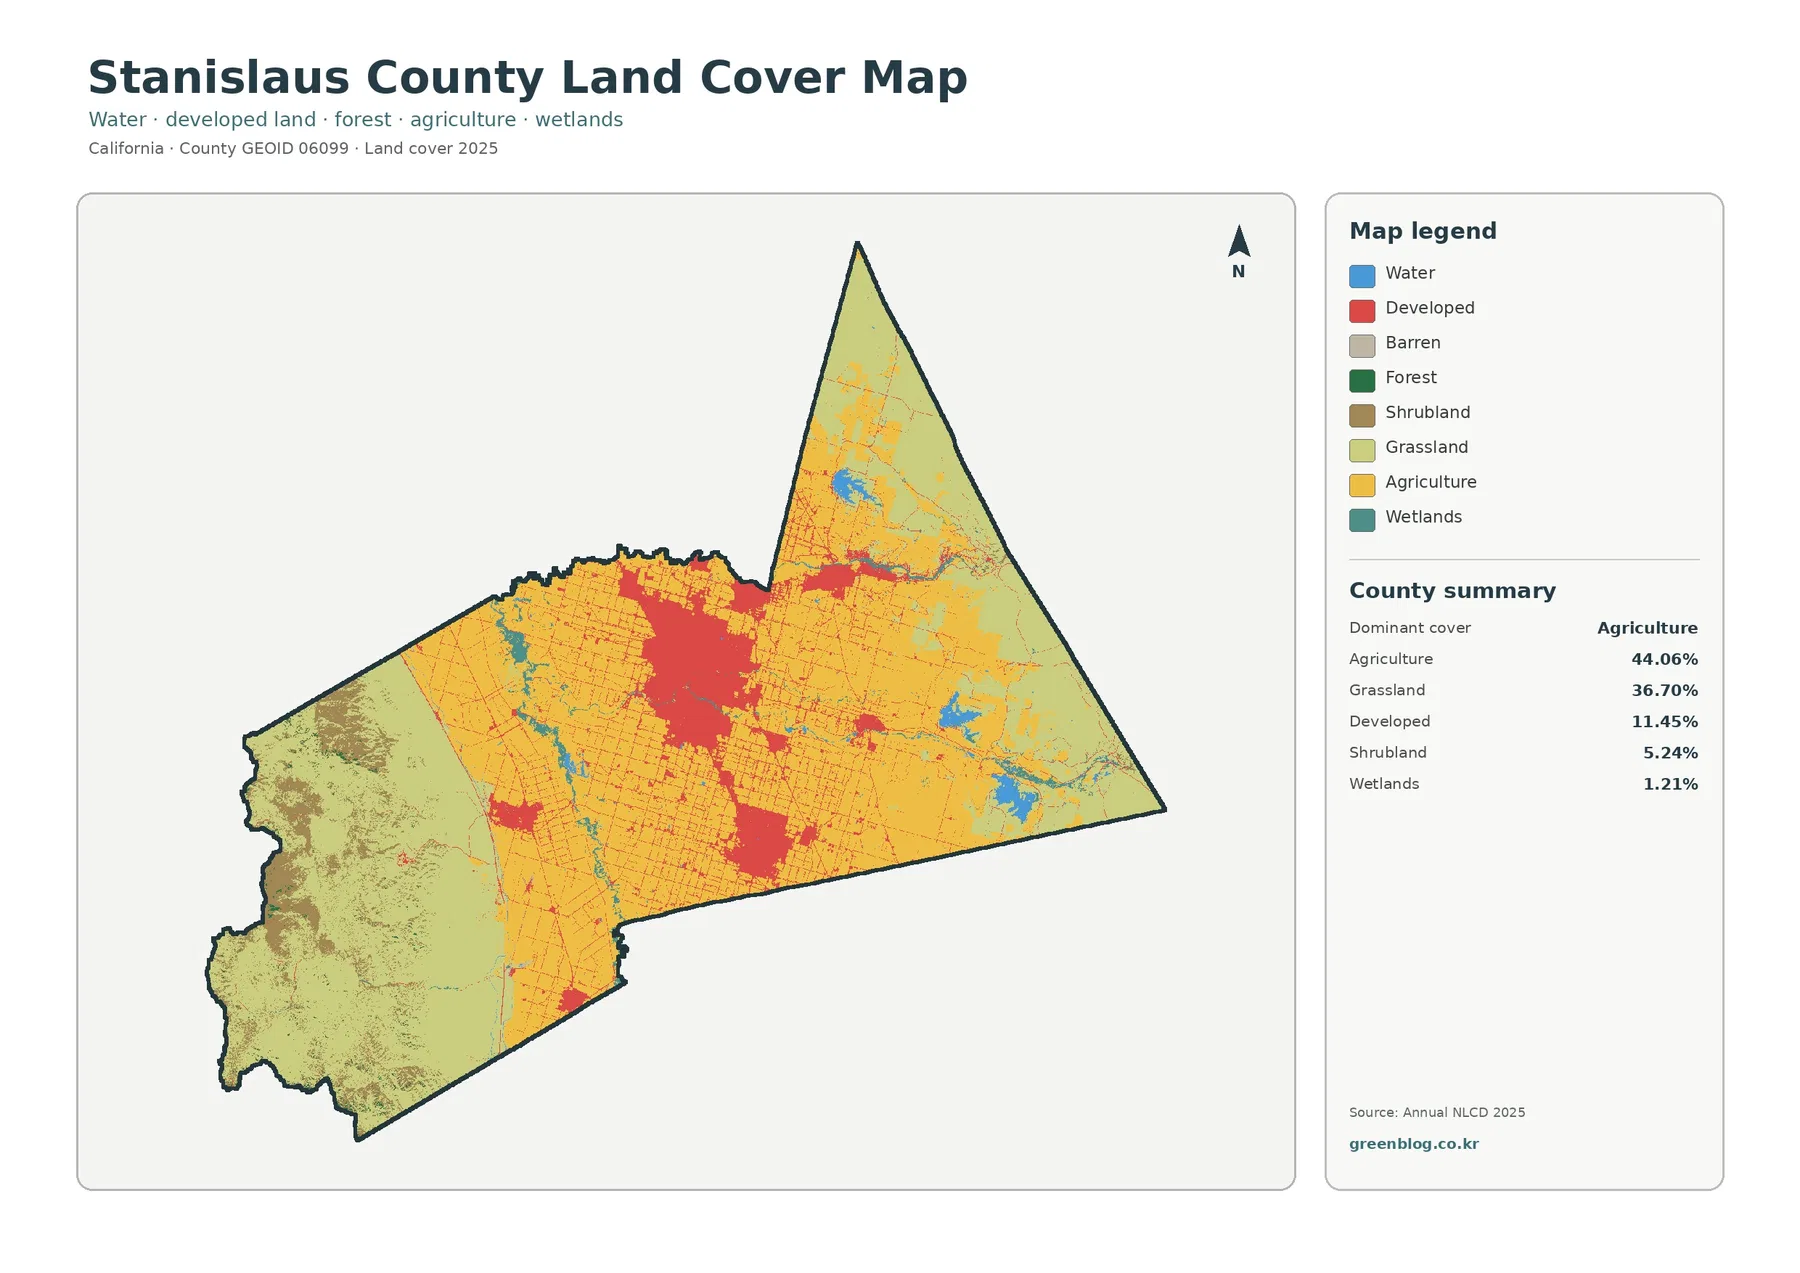
The Stanislaus County California Land Cover Map shows a county where intensive Central Valley agriculture, sizable cities, and much drier open hills occupy clearly different parts of the same boundary. In the 2025 summary, agriculture is the largest class at 44.06%, followed by grassland at 36.70%, developed land at 11.45%, shrubland at 5.24%, and wetlands at 1.21%. The strongest visual contrast is between the broad farm grid across the valley and the concentrated urban areas around Modesto, Ceres, and Turlock.
This page pairs four views: general land cover, forest and farmland, impervious surface and developed land, and mapped class differences from 1985 to 2025. The WebP images in the article are previews, while the four original 2480 × 1754 JPG maps are available together in one download. They are county-scale reference graphics, not parcel, zoning, ownership, survey, or development-permit maps.
Table of Contents
A Farm-Dominated Central Valley County with Distinct Urban Islands
Stanislaus County sits in central California and uses Modesto as its county seat. County government lists nine incorporated cities: Ceres, Hughson, Modesto, Newman, Oakdale, Patterson, Riverbank, Turlock, and Waterford. Those names help explain the red developed clusters visible on the land-cover image, but the map also makes clear that the cities occupy only part of the county. Large agricultural tracts continue between and beyond the urban areas, while the western extension becomes much more open and grass-covered.
Agriculture and grassland together account for most of the mapped surface, but they describe very different landscapes. Cropland dominates the flatter valley floor, where field boundaries form a dense rectilinear pattern. Grassland and shrubland are more prominent where the county reaches into rolling terrain, especially west of the main farm belt. This contrast matters because a countywide percentage alone cannot show whether a class is scattered evenly or concentrated in one broad zone.
Where Cropland Gives Way to Open Hills
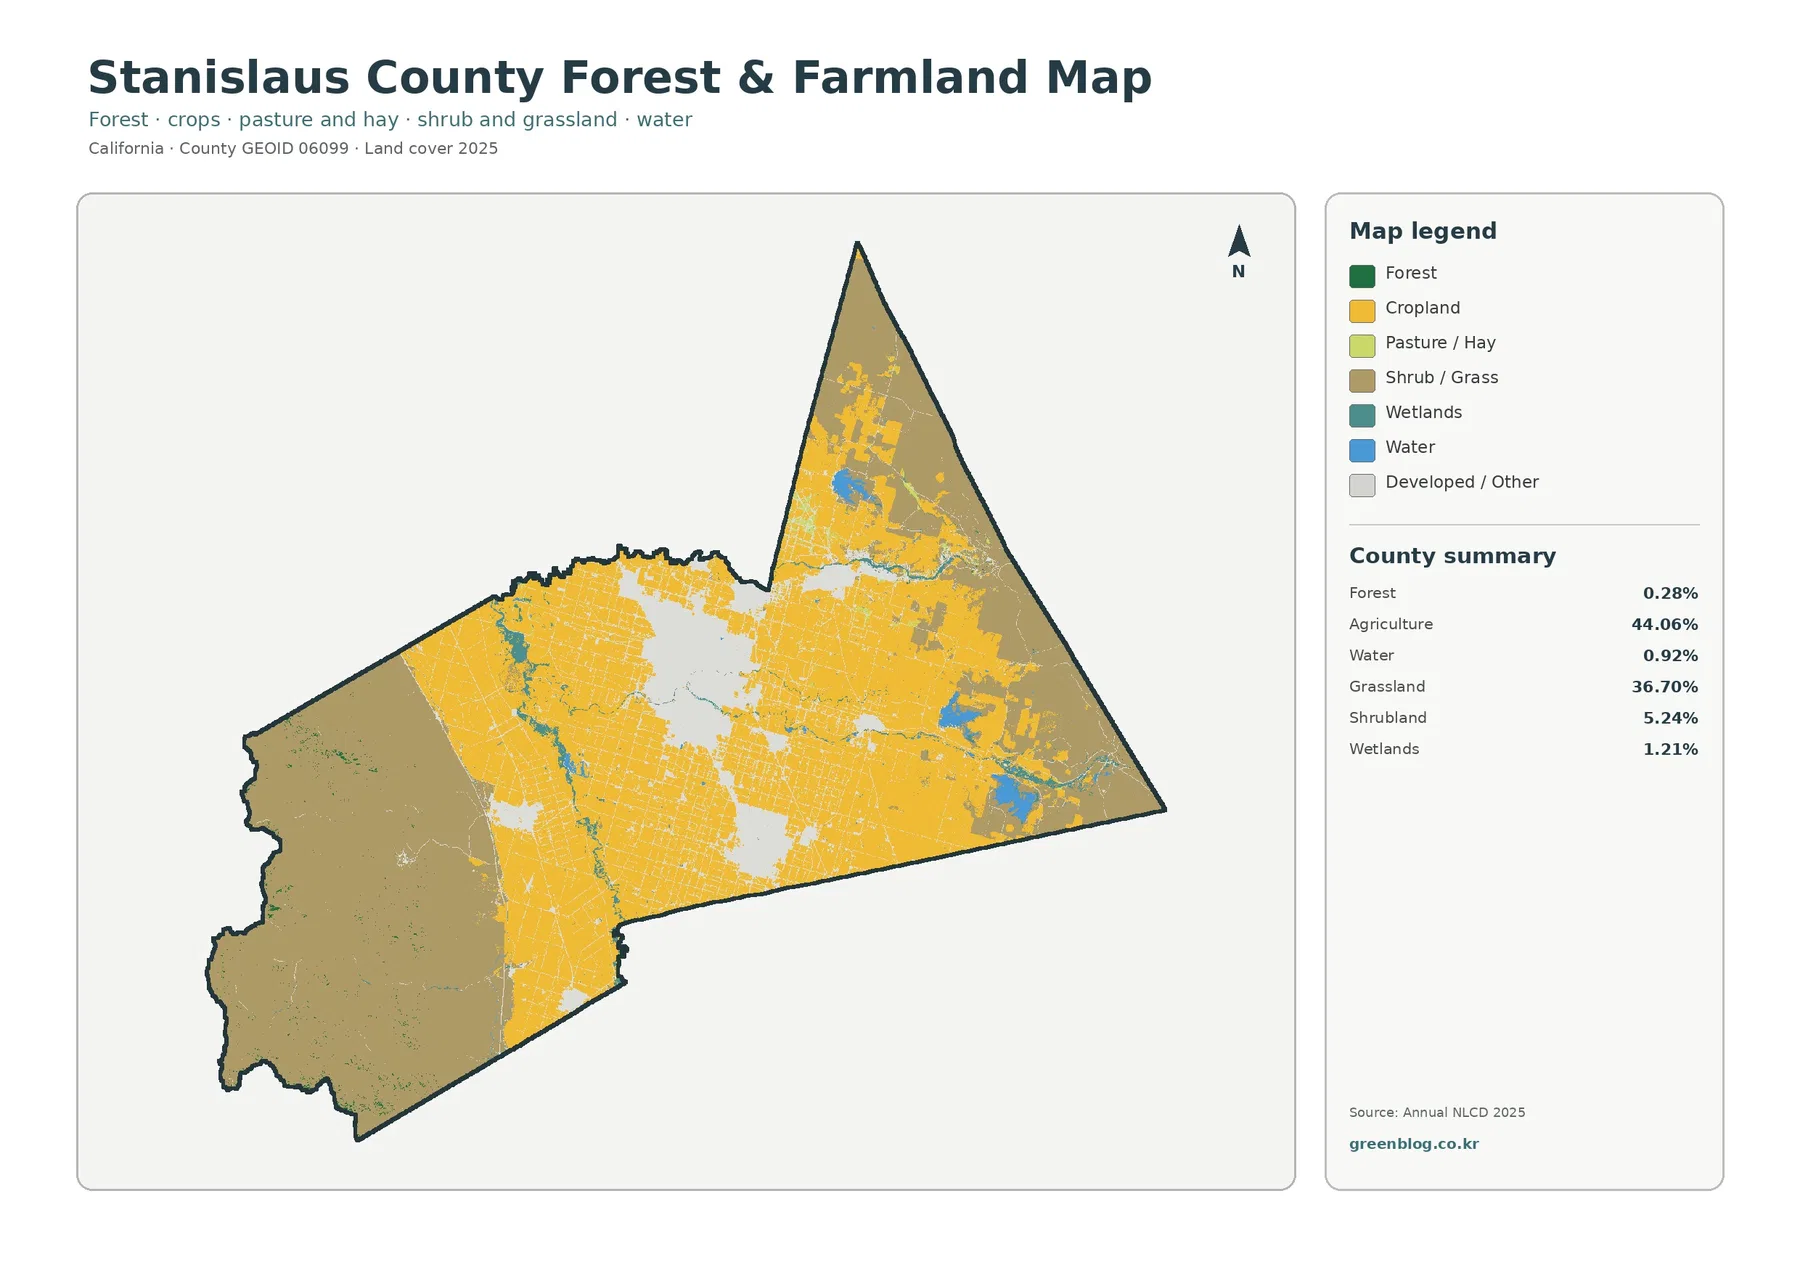
The forest-and-farmland view simplifies the same county into classes that are easier to compare for agricultural and open-land questions. Agriculture remains 44.06% and grassland 36.70%. Shrubland is 5.24%, wetlands 1.21%, water 0.92%, and forest only 0.28%. That last figure is important: the western uplands should not be described as a heavily forested landscape. They appear mainly as grass and shrub cover, while true forest occupies only a small fraction of the county.
County Parks describes Frank Raines Regional Park, west of Patterson along Del Puerto Canyon Road, as rugged slopes of California’s Coast Range. The map reflects that transition. The bright agricultural pattern weakens toward the western edge, where open grass and shrub classes become much more continuous. Moving east into the valley, agricultural cells become dominant again and spread across broad, regular blocks. Farther toward La Grange and the eastern side of the county, the pattern becomes more mixed, with grass, shrub, agriculture, and mapped water features sharing the landscape.
This view is useful for a farm-oriented report because it separates cropland from the surrounding open hills without letting the urban colors dominate the page. It also prevents a common mistake: treating every nonurban area as farmland. Large areas west of the valley are open grass or shrub cover rather than mapped agriculture. On the other hand, the Modesto-Turlock corridor is not simply one continuous city; extensive agricultural blocks remain around and between developed areas.
Impervious Cover Concentrates Around Modesto and Turlock
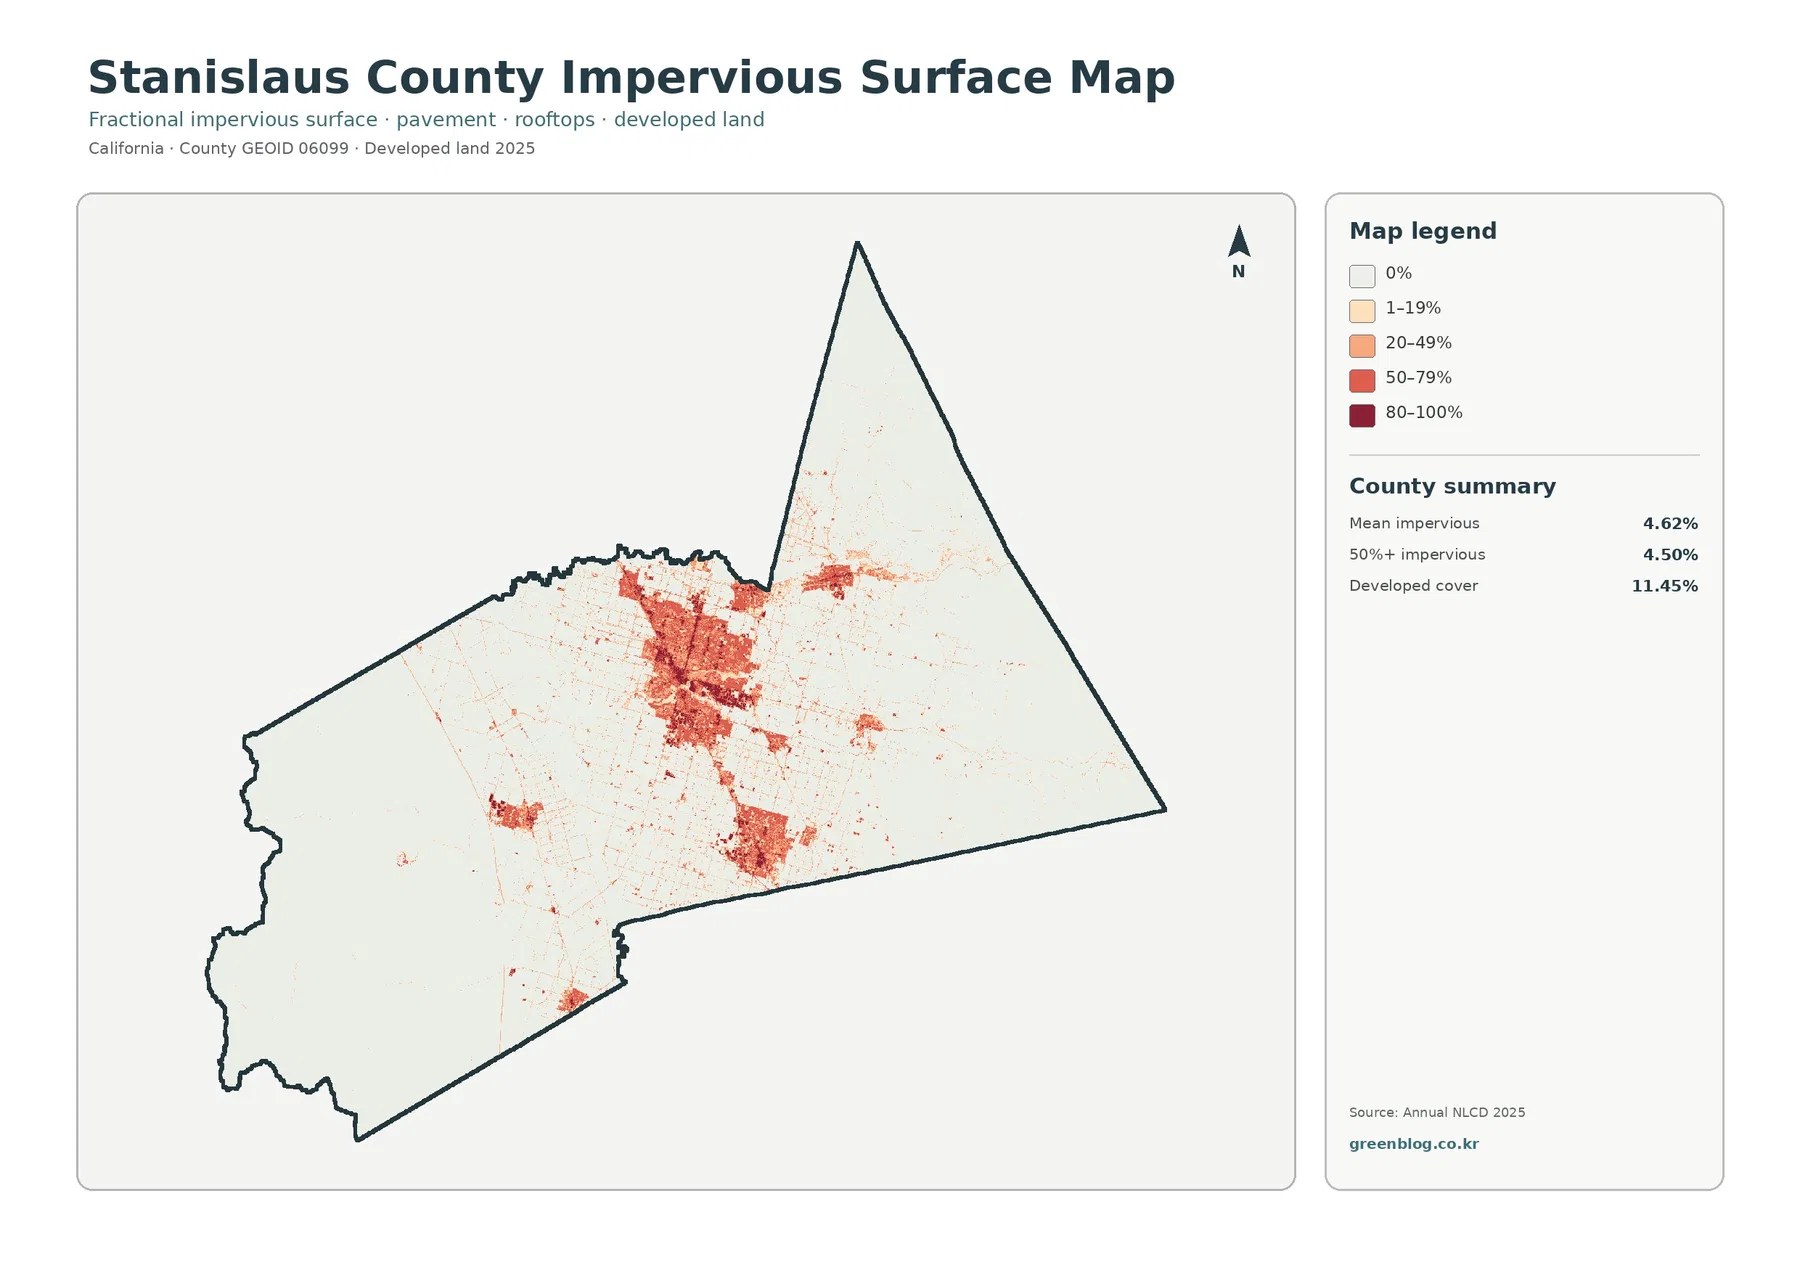
The impervious-surface map asks a narrower question than the general developed-land class. It estimates the fraction of each mapped cell covered by surfaces such as pavement and rooftops that do not readily absorb rainfall. The countywide mean is 4.62%, and 4.50% of the county falls in the 50%-or-more impervious category. Developed cover, by comparison, is 11.45%. Those figures differ because a developed land-cover class can still contain lawns, trees, exposed soil, and other pervious surfaces.
The strongest red cluster occupies the central Modesto-Ceres area. A second large concentration lies around Turlock farther south, while smaller patches correspond broadly to Oakdale, Riverbank, Waterford, Patterson, Newman, and other settled places. Thin lines and small cells extend from the cities along transportation and development corridors, but most of the farm grid remains pale. The western hills are even less impervious, which reinforces the sharp difference between the urban centers and the county’s open western landscape.
For watershed or stormwater discussions, this map is more informative than the simple developed/not-developed class because it indicates where hard surfaces are most concentrated. It should not be interpreted as a drainage design map, however. A high impervious percentage does not show pipe capacity, flood depth, stormwater infrastructure, or parcel-specific runoff. Those questions require engineering, floodplain, and local infrastructure data.
Water Corridors and Reservoirs Within the Farm Landscape
Water and wetlands occupy relatively small percentages, yet their shapes provide important landmarks in a county dominated by agriculture and grassland. The forest-and-farmland summary places water at 0.92% and wetlands at 1.21%. Blue reservoir shapes stand out in the eastern and northeastern portions of the map, while narrower blue-green lines follow river and riparian corridors through the valley. County Parks identifies Modesto Reservoir and Woodward Reservoir as major recreation facilities, giving useful real-world context for some of the mapped water surfaces.
Stanislaus County Public Works explains that the Tuolumne River and Dry Creek are both within the county and that the Tuolumne River meets the San Joaquin River west of Modesto. On a land-cover map, those features appear as water or wetland classes rather than as legal flood boundaries. That distinction matters. A blue or teal corridor can help a reader follow the regional water network, but it does not indicate the extent of a regulatory floodplain or current flood hazard.
The same water network also helps explain why a land-cover page is most useful when several layers of context are considered together. Agricultural land may reach close to a river corridor, a developed area may sit nearby, and small wetland cells may follow low ground. The map records the surface classification, not the legal or hydrologic relationship among those places. For flood decisions, Stanislaus County directs residents to FEMA and local floodplain information rather than general land-cover products.
What the 1985-2025 Comparison Actually Shows
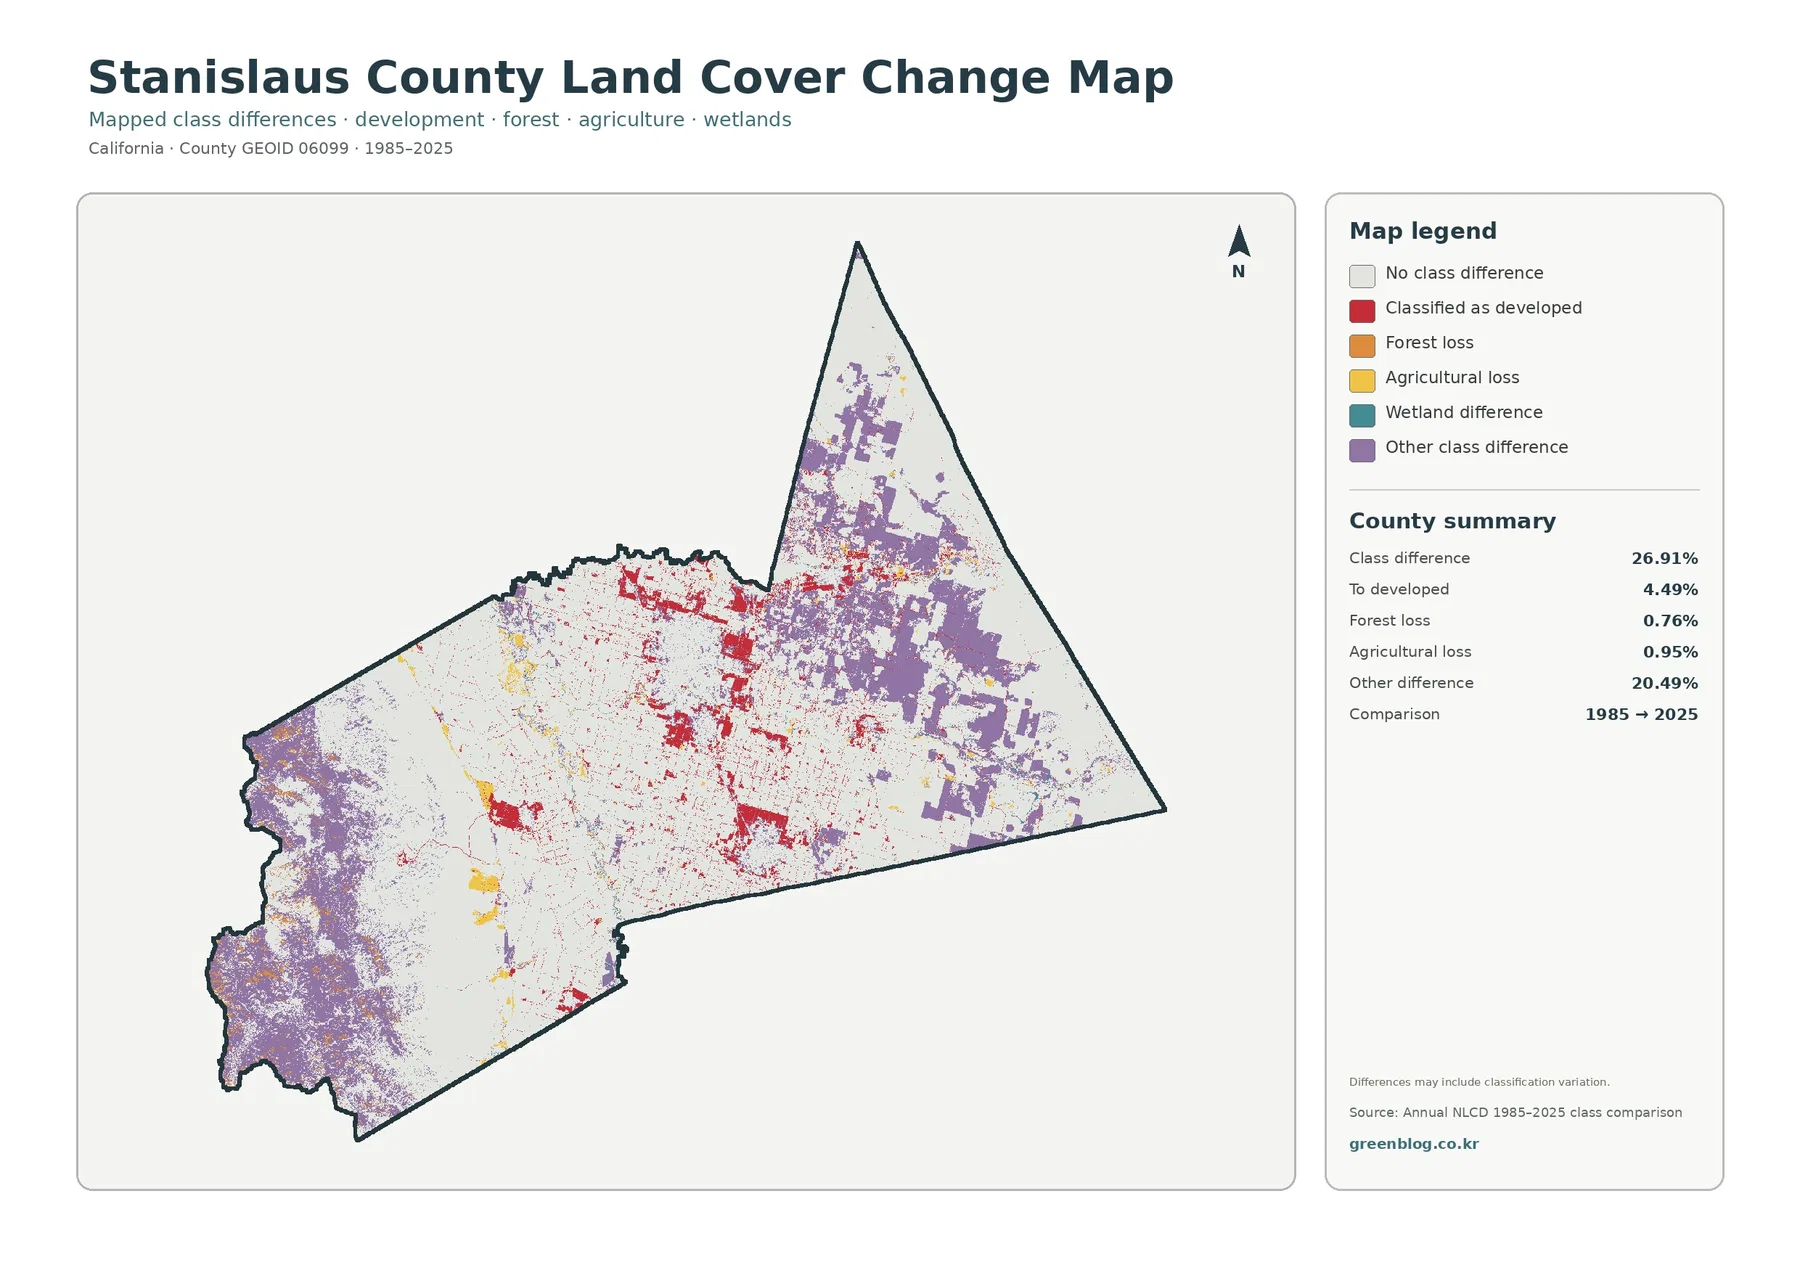
The change map marks 26.91% of the county as having a class difference between 1985 and 2025. Areas classified as developed in the comparison account for 4.49%, agricultural-loss classification 0.95%, forest-loss classification 0.76%, and other class differences 20.49%. Red development differences are especially noticeable around the central urban region and other settled corridors. Purple “other class difference” areas cover much broader portions of the western hills and the northeastern part of the county.
The 26.91% figure should not be read as a direct measure of land physically converted by human activity. The map itself warns that differences may include classification variation. Satellite conditions, processing methods, mixed pixels, and changes between similar vegetation classes can all alter the assigned class. This is particularly important here because “other class difference” is far larger than the specific developed, agricultural-loss, or forest-loss categories.
A practical way to use this map is to treat it as a screening layer. It can identify where a closer look may be worthwhile, such as the edges of the Modesto urban area or large purple zones in the hills, but it does not establish why a particular cell changed. Historical aerial imagery, agricultural records, planning documents, and project-level data would be needed before describing a location as urbanized, abandoned, burned, restored, or converted from one use to another.
Land Cover Is Not the Same as Zoning or Agricultural Designation
“Agriculture” on this map is a remotely sensed land-cover category. It is not the same thing as an Agriculture designation in the Stanislaus County General Plan. The county’s General Plan guides development, preservation, and conservation in unincorporated areas and includes a separate Agricultural Element. NLCD, by contrast, classifies what the surface looks like at the raster-cell scale. A location can therefore require completely different documents depending on whether the question is about visible cover, legal land use, zoning, a Williamson Act contract, or development rights.
The distinction is especially relevant in Stanislaus County because agriculture is both a dominant mapped surface and an important planning subject. The county’s Agricultural Element is designed to address agriculture, environmental resources, and the pressures of urban development. That policy context helps explain why farmland matters locally, but it does not convert the land-cover image into a planning map. Anyone evaluating a specific property should use county GIS, zoning, General Plan, and parcel records rather than relying on the colors shown here.
Choosing the Right Map for the Question
For a quick county overview, start with the general land-cover image because it places agriculture, grassland, developed land, shrubland, water, and wetlands in one frame. The forest-and-farmland version is better when the main question is how the farm belt differs from the western open hills. Use the impervious map when pavement and rooftops around Modesto, Turlock, and the smaller cities are the focus. The change map is most useful when the goal is to locate areas whose classifications differ between 1985 and 2025.
Using two maps together often gives a clearer answer than relying on one. Pair the general map with the impervious view to separate developed land from heavily paved surfaces. Pair the farmland view with the change map to see whether an area identified as a class difference lies inside the modern agricultural belt or in the western grass-shrub landscape. For a river or reservoir topic, use the general map to locate water and wetlands, then consult official watershed or flood sources for details the land-cover product does not contain.
Resolution, Date, and Classification Limits
Annual NLCD is designed for consistent regional and national comparison. That makes it useful for showing county-scale patterns, but the raster classification generalizes small features. A single cell may contain a road, trees, a building, and bare soil at the same time, while the dataset still assigns one land-cover class. Narrow canals, small wetlands, field-edge vegetation, and isolated structures may therefore be simplified or absorbed into a neighboring dominant class.
The 2025 label also refers to the dataset period represented by the map, not a guarantee that every site looks the same today. New construction, crop rotation, vegetation change, reservoir levels, and other later conditions may not appear. If the map is used in a presentation or report, identifying it as an Annual NLCD 2025 county land-cover product helps readers understand both its value and its limits.
Download the Four Original JPG Maps
The download archive contains one original JPG for each map discussed on this page. Each image measures 2480 × 1754 pixels. The package does not mark these files as meeting the A3 high-resolution reference, so they should be used at a size appropriate to the actual pixel dimensions rather than advertised as an A3 high-resolution set. They work well for screen reference, document graphics, classroom material, and moderate-size printing where the original resolution is sufficient.
Frequently Asked Questions
Does the 44.06% agriculture figure explain why farming is dominant in Stanislaus County?
No. It shows that agriculture is the largest 2025 mapped land-cover class and shows where that class occurs. Explaining why farming is so extensive requires other evidence about water supply, soils, agricultural economics, planning policy, and historical development.
Are all red areas around Modesto and Turlock completely paved?
No. The general map’s red developed class can include vegetation and soil within developed settings. The impervious map separately estimates hard surfaces such as pavement and rooftops, which is why developed cover is 11.45% while mean imperviousness is only 4.62%.
Does the 26.91% change value mean that more than a quarter of the county was physically converted?
Not necessarily. The comparison includes mapped class differences and may include classification variation between years. Because 20.49% is labeled as other class difference, the map should be used to locate differences for further review rather than as a direct conversion rate.
Map File Information
The ZIP contains four original JPG maps covering 2025 land cover, forest and farmland, impervious surface, and mapped class differences from 1985 to 2025.
- Printable Size: 2480 × 1754 pixels each
- File Type: Four JPG files in one ZIP archive
Related Maps
- Alameda County California Land Cover Map
- Alpine County California Land Cover Map
- Amador County California Land Cover Map
Sources
- MRLC Annual NLCD Data — official access point for Annual NLCD land-cover products
- USGS Annual NLCD Land Cover Classification — classification definitions and interpretation guidance
- Stanislaus County General Plan — county planning, conservation/open-space, and agricultural policy context
- Stanislaus County Public Works: San Joaquin River and Regional Watershed — county watershed and river background
Green Map creates custom-edited map images using open geographic data sources such as geoBoundaries, Natural Earth, OpenStreetMap, and government open data.
These maps are edited visual materials, not raw data files, and are provided for education, documents, presentations, and graphic reference.