Farmland dominates San Joaquin County in the 2025 land-cover classification, but the county does not read as one uninterrupted agricultural plain. Agriculture accounts for 63.89%, while distinct developed clusters sit around Stockton and other cities, open grassland occupies parts of the eastern and southwestern edges, and a branching network of water and wetlands cuts into the western Delta side. Those contrasts make the county easy to examine at several scales without leaving the same boundary.
Four map views are included here: current land cover, forest and farmland, impervious surface with developed land, and mapped class differences between 1985 and 2025. The four original JPG files are available together in one ZIP below. Using them side by side makes it easier to compare fields with city edges, Delta channels with nearby agriculture, hard-surface intensity inside developed areas, and locations where the two endpoint classifications differ.
Table of Contents
Farmland covers most of the county, but water and cities interrupt the pattern
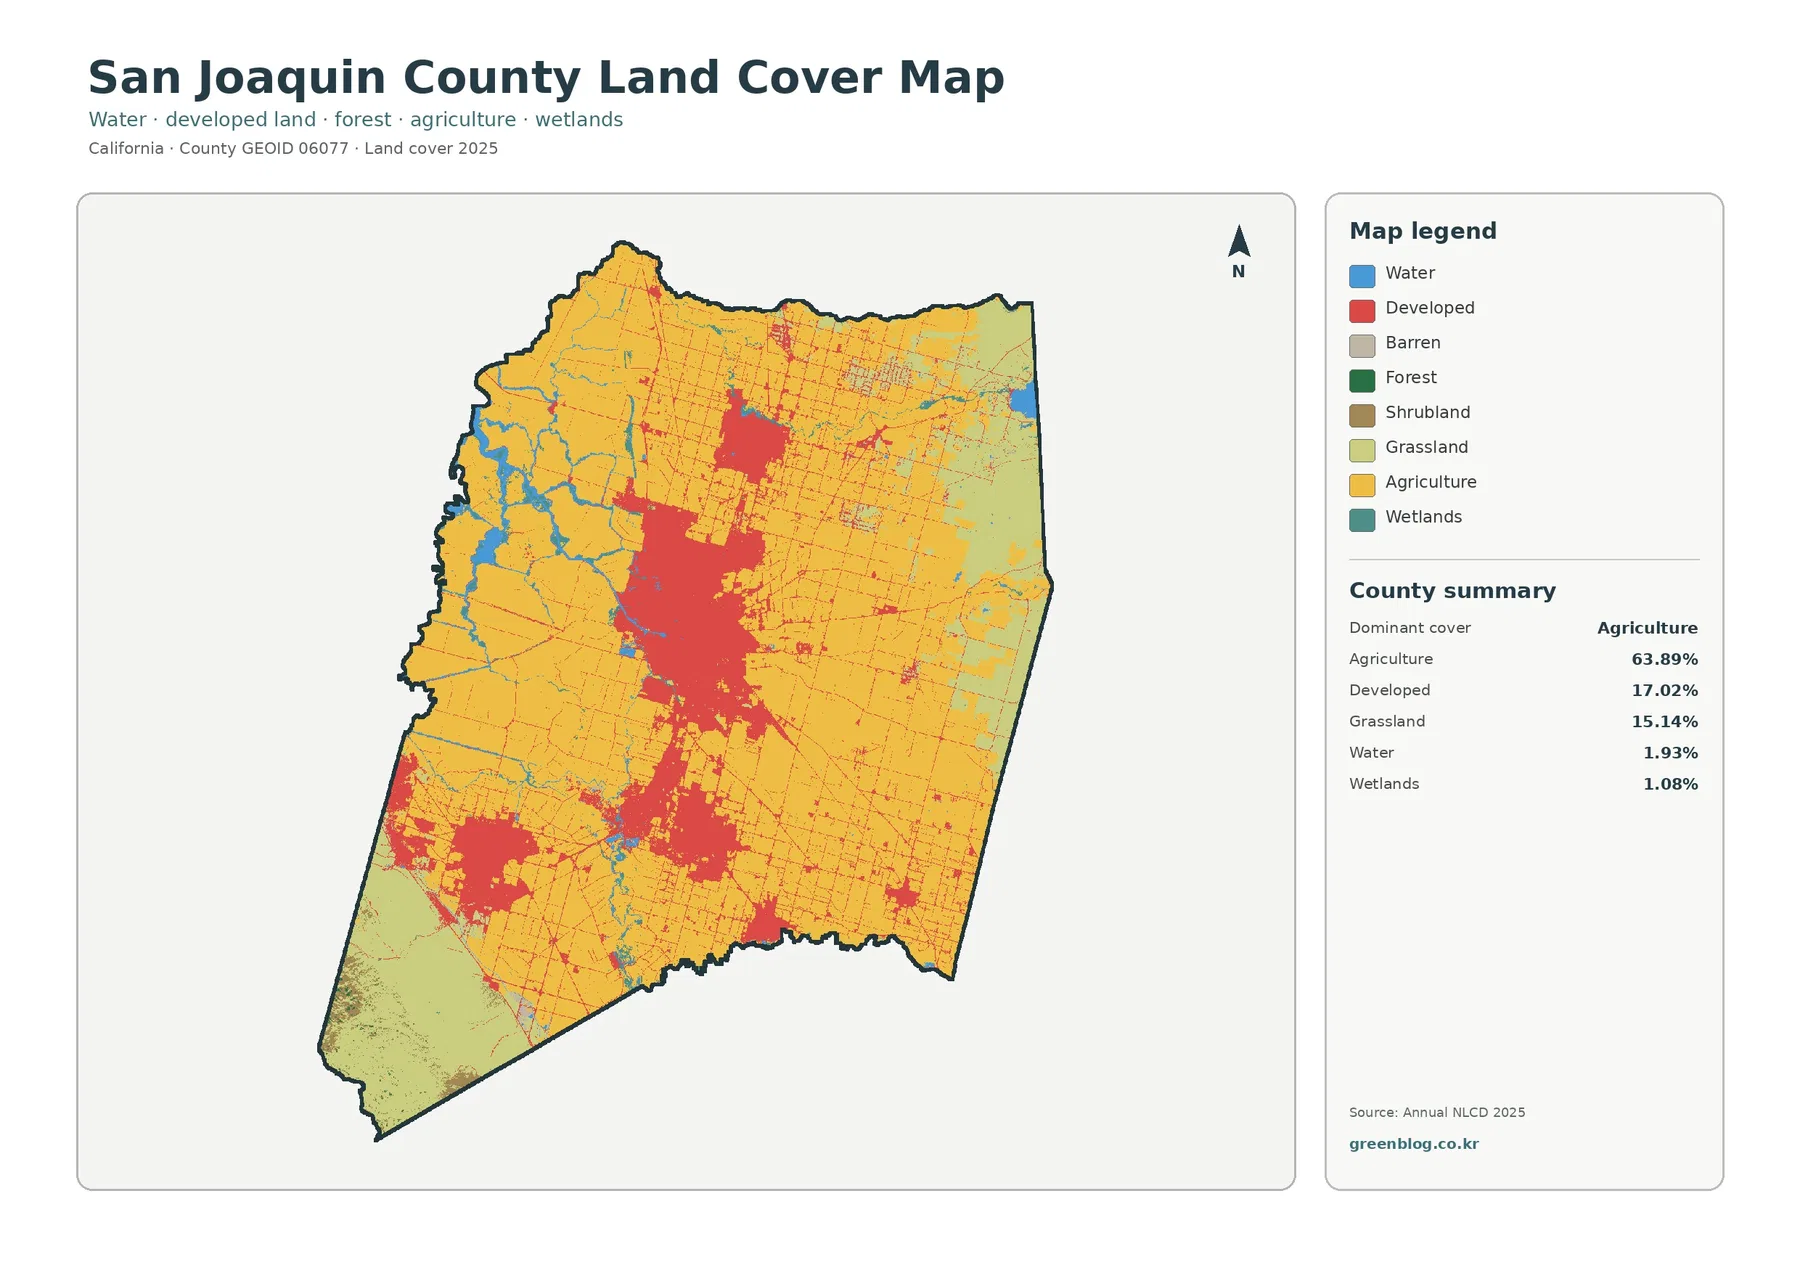
Yellow agricultural cover fills much of the north, center, and south on the current map. Red developed land is not spread evenly across that background. The largest concentration lies in the central county around Stockton, with separate clusters to the north, south, and southwest. Blue water and teal wetlands become much more intricate along the western boundary, while light-green grassland becomes more noticeable toward the east and in the far southwest. The result is a county where three very different landscapes—farmland, urban areas, and the Delta edge—sit close together.
The county summary puts numbers behind that visual balance. Agriculture is 63.89%, developed cover 17.02%, grassland 15.14%, water 1.93%, wetlands 1.08%, shrubland 0.72%, and forest 0.06%. Agriculture, development, and grassland therefore account for nearly all of the mapped surface. Water and wetlands occupy much smaller shares, yet their concentration in the west makes them far more conspicuous on the map than their countywide percentages might suggest.
San Joaquin County also has a strong agricultural economy, but the land-cover percentage should not be substituted for an economic statistic. The county Agricultural Commissioner’s 2024 Crop Report release describes agricultural production worth more than $3.1 billion and identifies milk, almonds, and grapes among leading commodities. That context explains why agriculture is central to the county, while the 63.89% figure answers a different question: it is the share classified as agricultural cover in this 2025 map, not farm revenue, planted acreage for a specific crop, or the number of operating farms.
At the cell level, agricultural cover is generalized. Annual NLCD uses a raster grid at roughly 30 meters, so a single cell can contain a field edge, a farm road, a building, a tree row, or another nearby surface. The classification assigns a broad cover category rather than tracing surveyed parcel boundaries. For a countywide view, the raster clearly captures the extent and fragmentation of agricultural cover, but it should not be used to decide whether a particular parcel is actively farmed.
The western Delta turns the agricultural edge into a patchwork of channels and wetlands
The western side has a shape and color pattern unlike any other part of the county. Water branches into multiple channels rather than following one simple river line, and wetland cells appear beside both water and agricultural cover. San Joaquin County’s official overview notes roughly 35 square miles of water and waterways within the county, while the General Plan 2035 materials treat the Delta as a distinct planning subject. Those local references provide context for the complicated blue-and-teal fringe visible on the land-cover map.
Only 1.93% of the county is classified as water and 1.08% as wetlands. Their visual importance comes from concentration rather than total area. Along the Delta edge, agricultural cells extend between waterways, producing short-distance switches among yellow fields, blue water, and teal wetland cover. A description that focuses only on the dominant 63.89% agriculture would miss this defining western contrast.
Narrow channels, levees, roads, and field margins can also be simplified by the 30-meter grid. A water edge may look wider, narrower, or less precise than it would on a navigation, levee, or parcel map. The image is therefore best read as a broad surface classification. Legal water boundaries, water rights, navigation, and levee management require purpose-built official sources rather than a land-cover raster.
Grassland, not forest, is the main open-cover contrast to agriculture
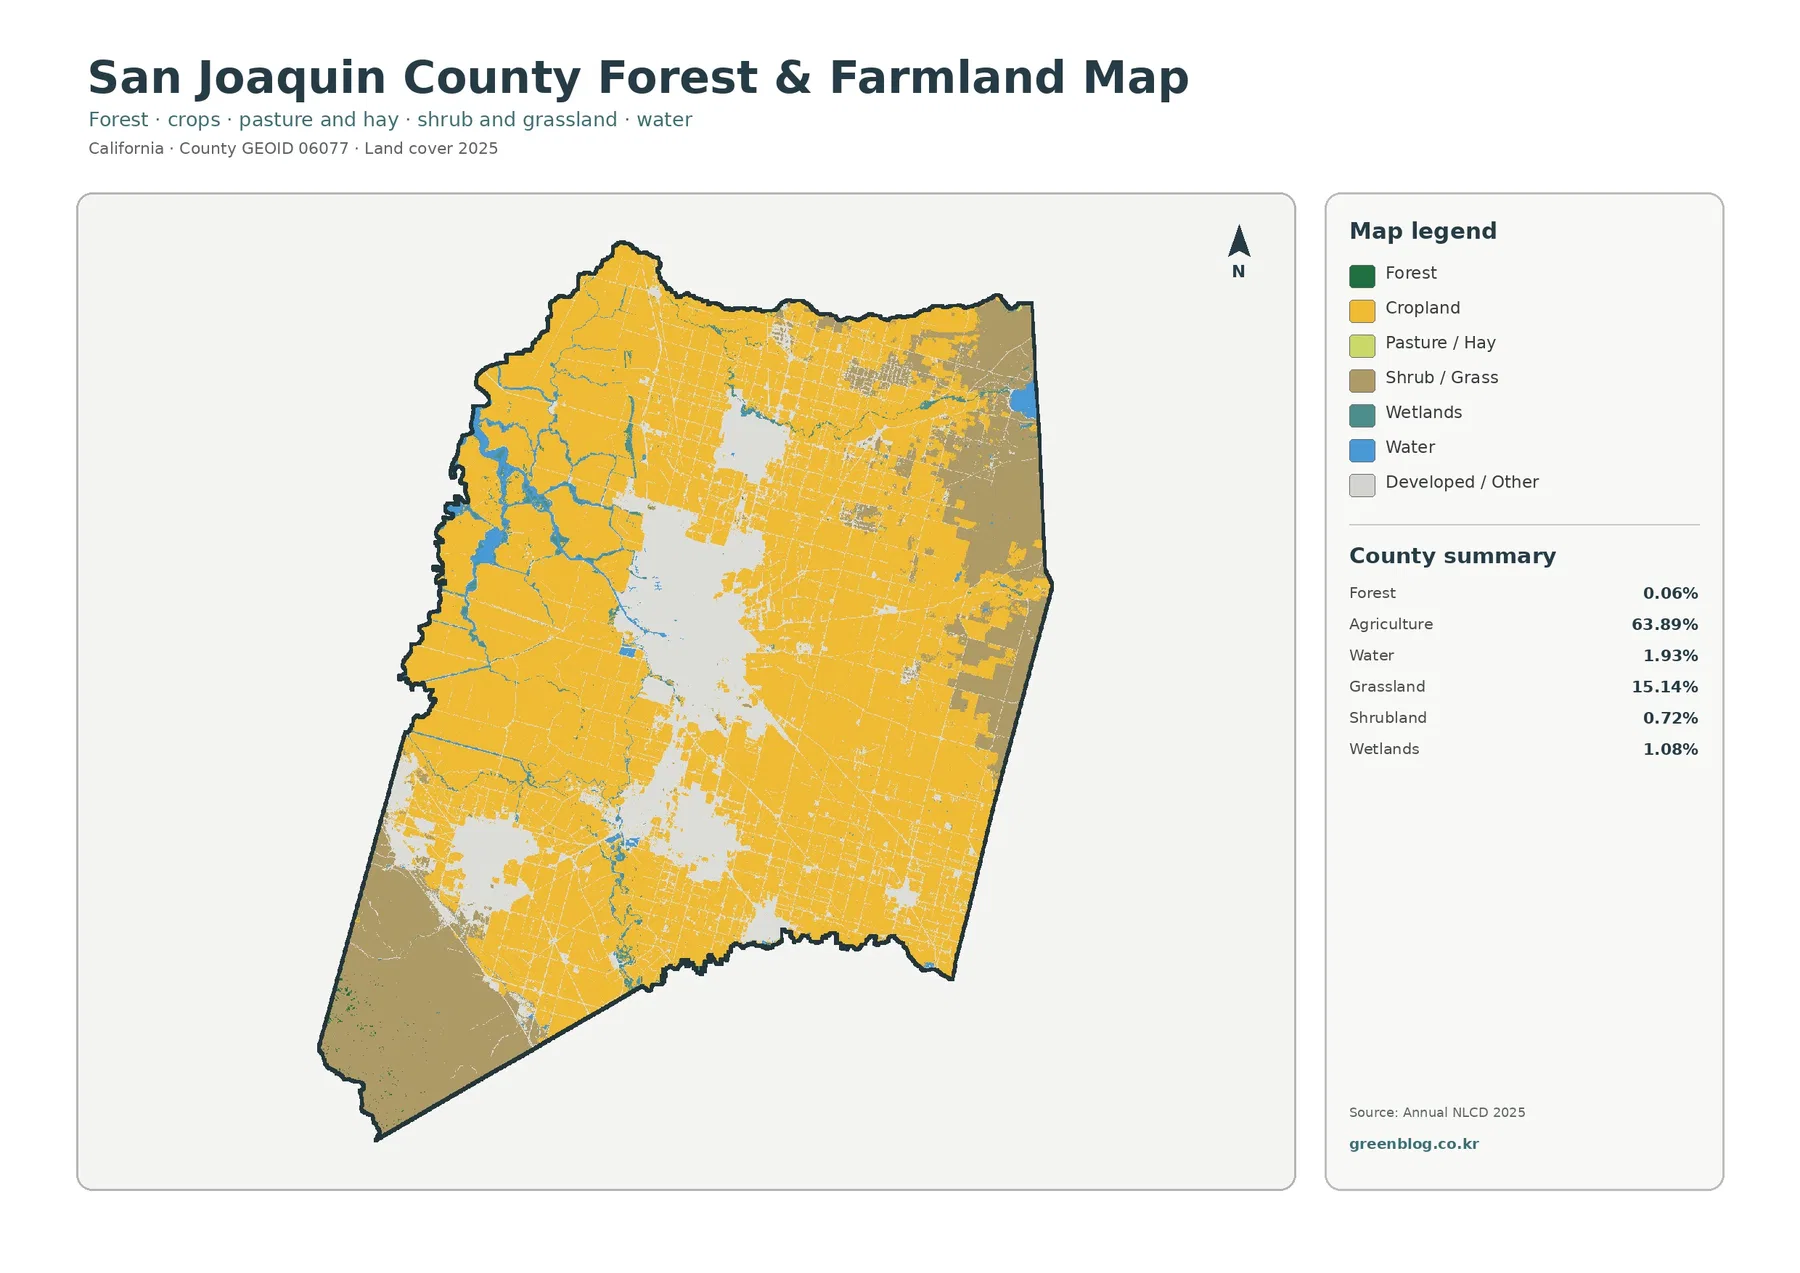
Removing some of the competition from the general map makes the open-land categories easier to separate. Agriculture remains dominant, but grassland at 15.14% becomes an important part of the eastern and southwestern margins. Shrubland adds another 0.72%. By comparison, mapped forest is only 0.06%, so San Joaquin County does not have the large forest blocks that characterize many mountain counties elsewhere in California.
That distinction matters because open land is easy to describe too broadly. A pale area with few buildings is not automatically farmland. In this classification, grassland is a separate cover type and occupies enough area to influence the countywide pattern. A classroom map, report, or presentation that describes San Joaquin County simply as “farms and cities” would leave out a substantial grassland component, especially away from the most intensively cultivated central areas.
The 0.06% forest figure is not a tree census. Orchard trees, riparian trees, street trees, landscaping, and small groves may fall within agricultural, developed, or mixed cells rather than forming a dominant forest class. Forest here refers to cells classified primarily as forest cover. It should not be converted into a statement that trees are absent from the county.
Development is split among several urban centers instead of forming one continuous belt
The central developed footprint aligns with Stockton and is the largest urban cluster on the map. A separate concentration lies around Lodi to the north. Farther south, developed areas appear around Manteca and Lathrop, while the southwest has another large cluster around Tracy and Mountain House. The county website lists eight cities—Escalon, Lathrop, Lodi, Manteca, Mountain House, Ripon, Stockton, and Tracy—which provides a geographic frame for the separated red areas without implying that the raster follows municipal boundaries.
Large stretches of agricultural cover remain between those centers. That spacing is important: 17.02% developed cover does not mean the county contains a single urban surface covering one-sixth of its territory. Instead, development is concentrated in several major footprints, with smaller settlements and linear developed features crossing an agricultural background. The pattern is especially clear between the Stockton area and the southwestern urban cluster.
Developed land is broader than pavement and rooftops. Annual NLCD developed classes can include residential areas with lawns and trees, lower-density built environments, roads, commercial or industrial surfaces, and other mixtures of constructed and vegetated ground. A red cell therefore does not mean the entire 30-meter square is hard surface. Impervious cover provides a narrower measure for that question.
Impervious surface separates hard urban cores from lower-density edges
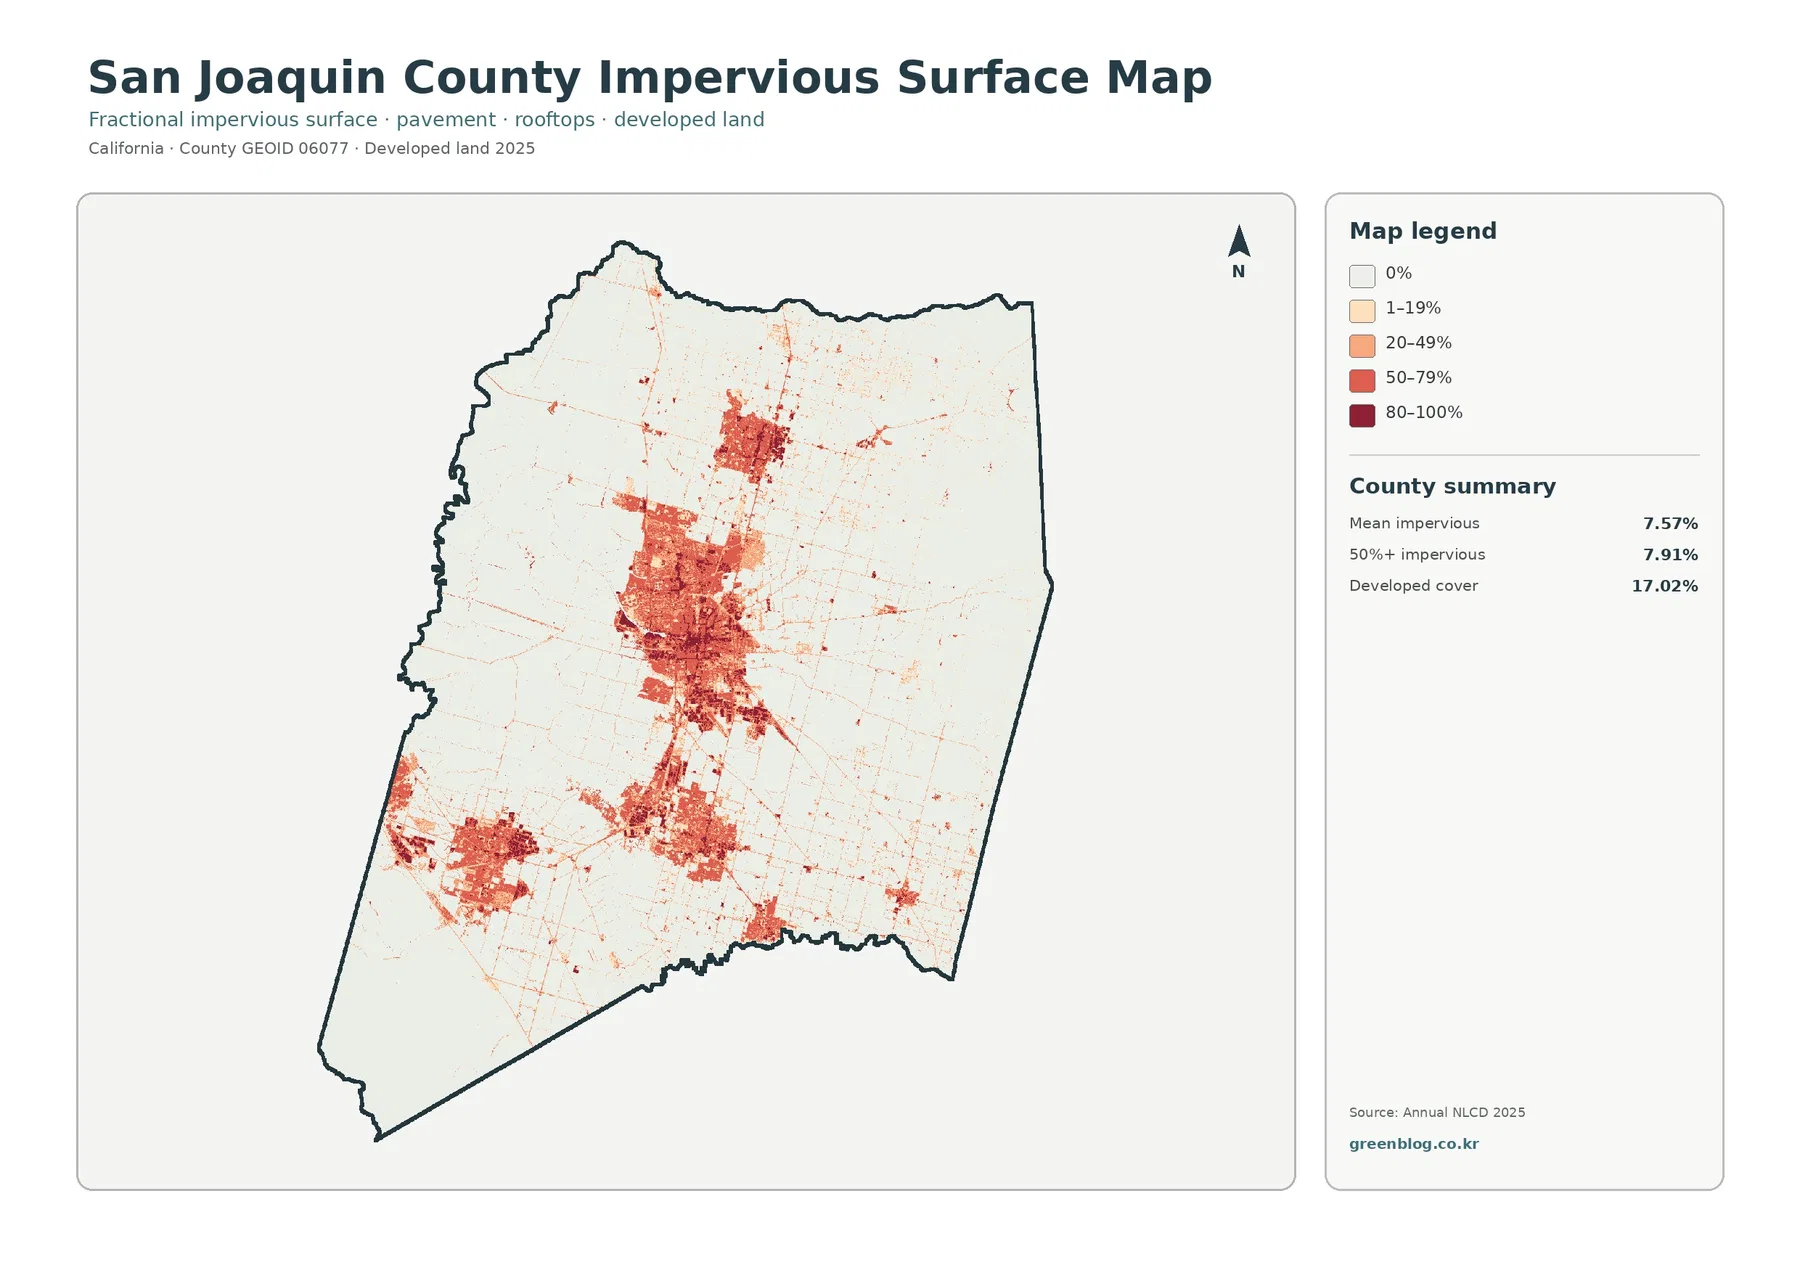
Impervious surface means rooftops, pavement, parking areas, and similar surfaces that do not readily absorb water. The countywide mean is 7.57%, and 7.91% of the county is mapped at 50% impervious or higher. Both figures are lower than the 17.02% developed share because developed neighborhoods and city edges often contain yards, trees, soil, and other permeable ground mixed with built surfaces.
The darkest tones cluster through the Stockton footprint and appear again in Lodi, the Manteca-Lathrop area, and the Tracy side of the county. Moving away from those cores, the map fades through lower impervious classes before returning to mostly zero or very low values across broad agricultural areas. This gradient is the key difference from the general land-cover map: two places may both be classified as developed, yet one can contain far more hard surface than the other.
Thin linear features also extend through rural areas. They coincide with transportation and developed corridors in places, but the map does not establish why development occurred along a particular route. Spatial overlap is not the same as cause. Historical growth, transportation policy, zoning, and subdivision timing require planning records or time-specific imagery.
Impervious cover should not be treated as a stand-alone flood-risk layer either. Flooding depends on rainfall, terrain, rivers, levees, drainage systems, soil, and other conditions. San Joaquin County’s Delta waterways and agricultural drainage make that distinction especially important. The impervious map is appropriate for comparing hard-surface intensity; flood or drainage decisions need dedicated Public Works and hydrologic information.
The 1985–2025 comparison separates mapped development from other class differences
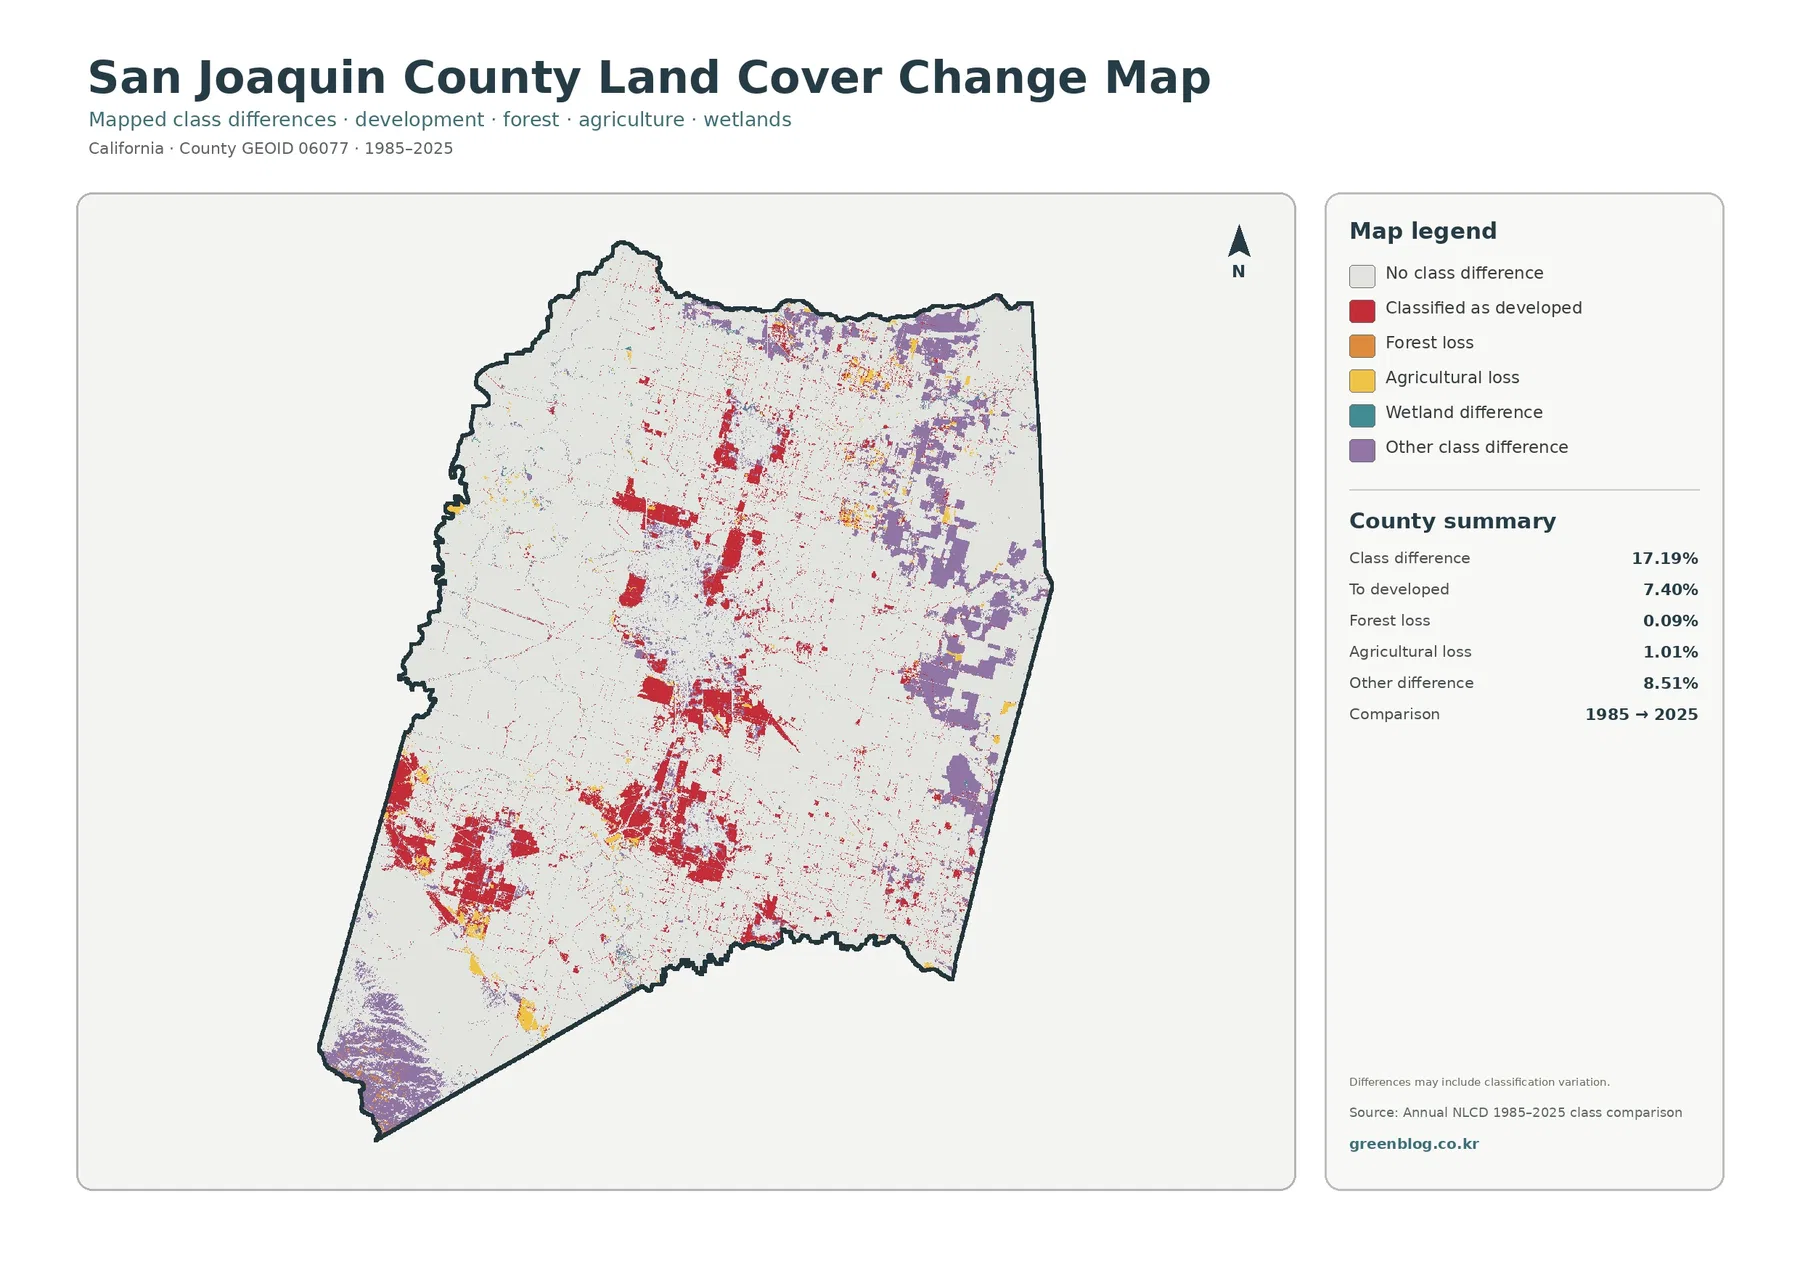
The endpoint comparison marks class differences across 17.19% of the county. Cells classified as developed account for 7.40%, agricultural loss for 1.01%, forest loss for 0.09%, and other class differences for 8.51%. White still covers most of the map, while red change cells gather around several present-day urban footprints. Purple “other” differences are much more noticeable in parts of the east and northeast and also occur in the far southwest.
Around Stockton, red cells extend beyond portions of the current developed footprint and form multiple blocks along its edges. Similar red concentrations appear around the southwestern and southern urban areas, with smaller patches elsewhere. Comparing this layer with current land cover is a practical way to locate places that deserve closer historical review, but the red category does not supply construction dates or explain the policy decisions behind growth.
Purple cells need a different interpretation. “Other class difference” is not a synonym for urban growth, farmland loss, habitat recovery, or any single land-use transition. It simply groups locations where the broad endpoint classes differ in another way. The large eastern patches therefore cannot be assigned a specific story from this layer alone. Intermediate Annual NLCD years or more detailed source data are needed to determine what changed and whether the difference persisted.
The 17.19% class-difference total also should not be described as 17.19% permanent land-use conversion. The map warns that classification variation may be included. Crop cycles, vegetation condition, image timing, mixed pixels, and classification methods can change the assigned class at an endpoint. Likewise, the 1.01% agricultural-loss value is a mapped classification result, not a decline in farm income, crop output, or farm count.
Pair the maps around one question instead of shrinking all four onto one page
For an urban–agriculture comparison, current land cover and impervious surface make the strongest pair. The first identifies the broad developed footprint, while the second reveals where hard surfaces are most concentrated inside it. Stockton can then be compared with the smaller urban centers without assuming that every developed pixel has the same density.
For the Delta, current land cover works better beside the forest-and-farmland view. Water and wetlands can be followed through the western agricultural edge, while grassland remains visible as a separate open-cover category toward the east and southwest. A long-term question calls for a different pairing: place the current map beside the 1985–2025 change map and compare red change cells with today’s urban edges.
Two large maps are often easier to read in a report or slide deck than four small maps squeezed into the same frame. The county boundary is consistent across the set, so locations line up naturally, but each legend answers a different question. Keeping the legends large enough to read is particularly important for the narrow Delta channels and the lower impervious-surface classes.
Map File Information
The download ZIP contains four original JPG files for San Joaquin County: current land cover, forest and farmland, impervious surface with developed land, and the 1985–2025 land-cover class comparison. Because every image uses the same county boundary, the set is convenient for matching farmland, city clusters, Delta waterways, grassland, hard-surface intensity, and endpoint differences at the same locations.
Each source JPG in this package is 2480 by 1754 pixels. The asset manifest identifies them as the original supplied images, but it does not mark them as meeting an A3 high-resolution reference. For a large print, check the legend text and narrow western waterways at the intended output size before committing to a final layout. Enlarging the image does not create finer land-cover data than the underlying roughly 30-meter classification.
What a 30-meter land-cover raster can and cannot answer
Annual NLCD represents the landscape as a raster grid. At roughly 30 meters, a cell summarizes the dominant mapped surface within a small square rather than tracing a surveyed line. A canal bank, field edge, road, yard, tree row, and building can sit close enough to mix within one cell. The resulting boundary is intentionally more generalized than parcel, engineering, or navigation data.
Land cover is also different from zoning, ownership, legal land use, and development entitlement. An agricultural cell does not prove that a parcel is legally restricted to farming, and a developed cell does not establish what buildings are permitted there. San Joaquin County General Plan, zoning, and parcel systems are the appropriate sources for those questions. These maps are better suited to countywide surface patterns and broad comparisons among cover classes.
The 2025 layer is a snapshot of that classification year. Construction, fallowing, crop rotation, vegetation change, or water-level changes after the observation period may not appear. Current aerial imagery and county records are more appropriate when a recent site condition matters. For a trend, intermediate Annual NLCD years are preferable to relying only on the 1985 and 2025 endpoints, especially where the change layer contains large “other difference” areas.
Frequently Asked Questions
Why do the Delta waterways stand out when water and wetlands cover only a small share of the county?
Water is 1.93% and wetlands 1.08% countywide, but both are concentrated along the western Delta edge rather than spread evenly. Their channels repeatedly cut through agricultural cover, so blue and teal features are visually prominent even though they occupy far less area than farmland.
Why is developed cover 17.02% while mean impervious cover is only 7.57%?
Developed classes can contain both built and permeable surfaces, including lawns, trees, yards, and lower-density neighborhoods. Impervious cover narrows the measurement to hard surfaces such as rooftops and pavement. The two percentages therefore describe related but different properties of the same urban landscape.
Does the 7.40% “to developed” value equal actual urban expansion since 1985?
The 7.40% value should not be treated as a direct measure of actual urban expansion. It summarizes locations classified as developed in the endpoint comparison, and classification variation or mixed pixels may contribute to the result. Construction dates and actual conversion histories require intermediate imagery, planning records, and parcel-level evidence rather than this two-date layer alone.
Map File Information
Download the four original San Joaquin County land-cover JPG maps together in one ZIP file.
- File Type: ZIP containing four JPG files
Related Maps
- Alameda County California Land Cover Map
- Alpine County California Land Cover Map
- Amador County California Land Cover Map
Sources and official references
These links document the Annual NLCD classification, county boundary data, and local agricultural, Delta, and planning context. These references cover subjects beyond surface classification, so economic or legal information should not be substituted for land-cover percentages, and the raster should not be substituted for parcel or zoning records.
- MRLC Annual NLCD Data — Annual NLCD products and year-based data access
- USGS Annual NLCD Land Cover Classification — class definitions and classification background
- U.S. Census Bureau TIGER/Line Shapefiles — county boundary reference
- San Joaquin County Official Website — official county overview, cities, and waterways
- San Joaquin County Agricultural Commissioner — 2024 Crop Report — local agricultural production context
- San Joaquin County General Plan 2035 Documents — planning materials covering land use, natural resources, and the Delta
Green Map creates custom-edited map images using open geographic data sources such as geoBoundaries, Natural Earth, OpenStreetMap, and government open data.
These maps are edited visual materials, not raw data files, and are provided for education, documents, presentations, and graphic reference.