San Diego County has a sharp land-cover split between its heavily developed western side and a much larger shrub-dominated interior. In the 2025 summary, shrubland covers 63.55% of the county while developed land accounts for 17.94%; forest, grassland, barren land, wetlands, water, and agriculture make up much smaller shares.
Four views are provided here: overall land cover, forest and farmland, impervious surface with developed land, and mapped class differences from 1985 to 2025. The WebP images are for on-page viewing, and the four original JPG maps are available together in one ZIP from the download section below.
Table of Contents
The hard-surfaced west stands out even before the countywide percentages are considered
Developed cover is 17.94% countywide, but it is not spread evenly. The broadest concentration sits along the western and southwestern side, where developed cells form a large connected area. Another noticeable cluster appears in the northwest. Farther inland, the developed pattern breaks into smaller patches and narrow lines rather than continuing as one broad urban field.
That concentration becomes clearer in the impervious-surface view. Mean imperviousness is 7.40%, and 7.40% of the county is mapped at 50% impervious or higher. Impervious surface means roofs, pavement, parking lots, and other hard areas where water does not readily soak into soil. It is a narrower measure than developed land, which can also contain yards, trees, exposed soil, and other permeable surfaces.
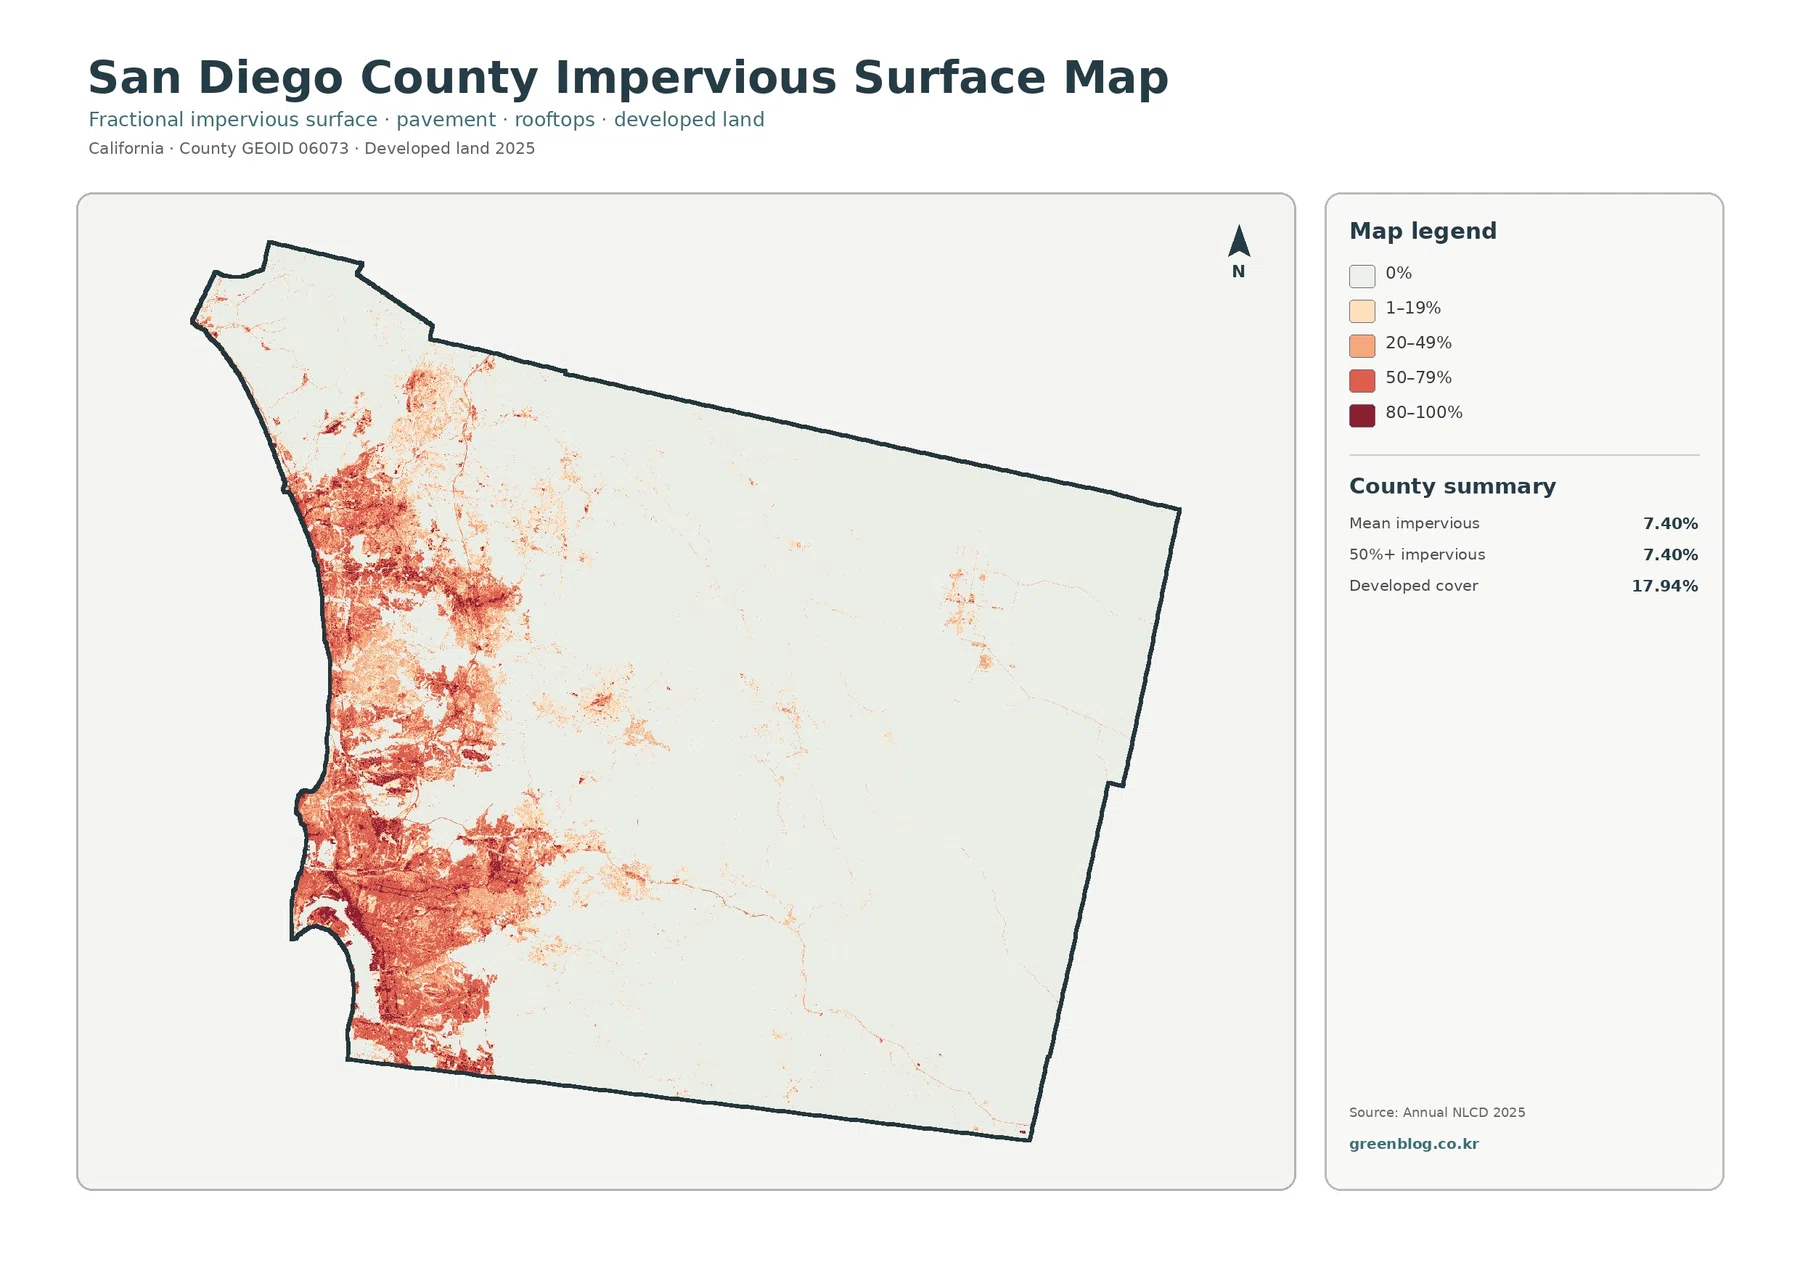
Within the western developed area, several impervious classes sit next to one another. Darker 50–79% and 80–100% cells mix with lighter 20–49% areas, so the map does not treat the urban side as uniformly paved. That makes it useful for separating a broad developed footprint from places where rooftops and pavement occupy a larger share of each raster cell.
Imperviousness alone is not a flood-risk map. Runoff also depends on slope, soils, drainage systems, channels, and rainfall. The layer is best used to compare surface hardness and development intensity, not to decide whether a property or neighborhood is safe from flooding.
Moving inland, shrubland becomes the dominant cover rather than a secondary class
The overall 2025 land-cover view puts the western development into countywide context. Shrubland accounts for 63.55%, far more than any other class. Developed land follows at 17.94%, then barren land at 5.55%, grassland at 5.43%, and forest at 4.72%. Wetlands are 1.64%, water 0.81%, and agriculture 0.36%.
Most of the central and eastern interior is filled by the shrubland class, interrupted by forested mountain patches, small grassland areas, and broader barren zones toward the east. The transition is visible rather than abrupt: development thins from west to east, while shrub cover occupies more of each successive area. This makes the county useful for comparing dense urban surfaces, vegetated uplands, and dry interior cover within one boundary.
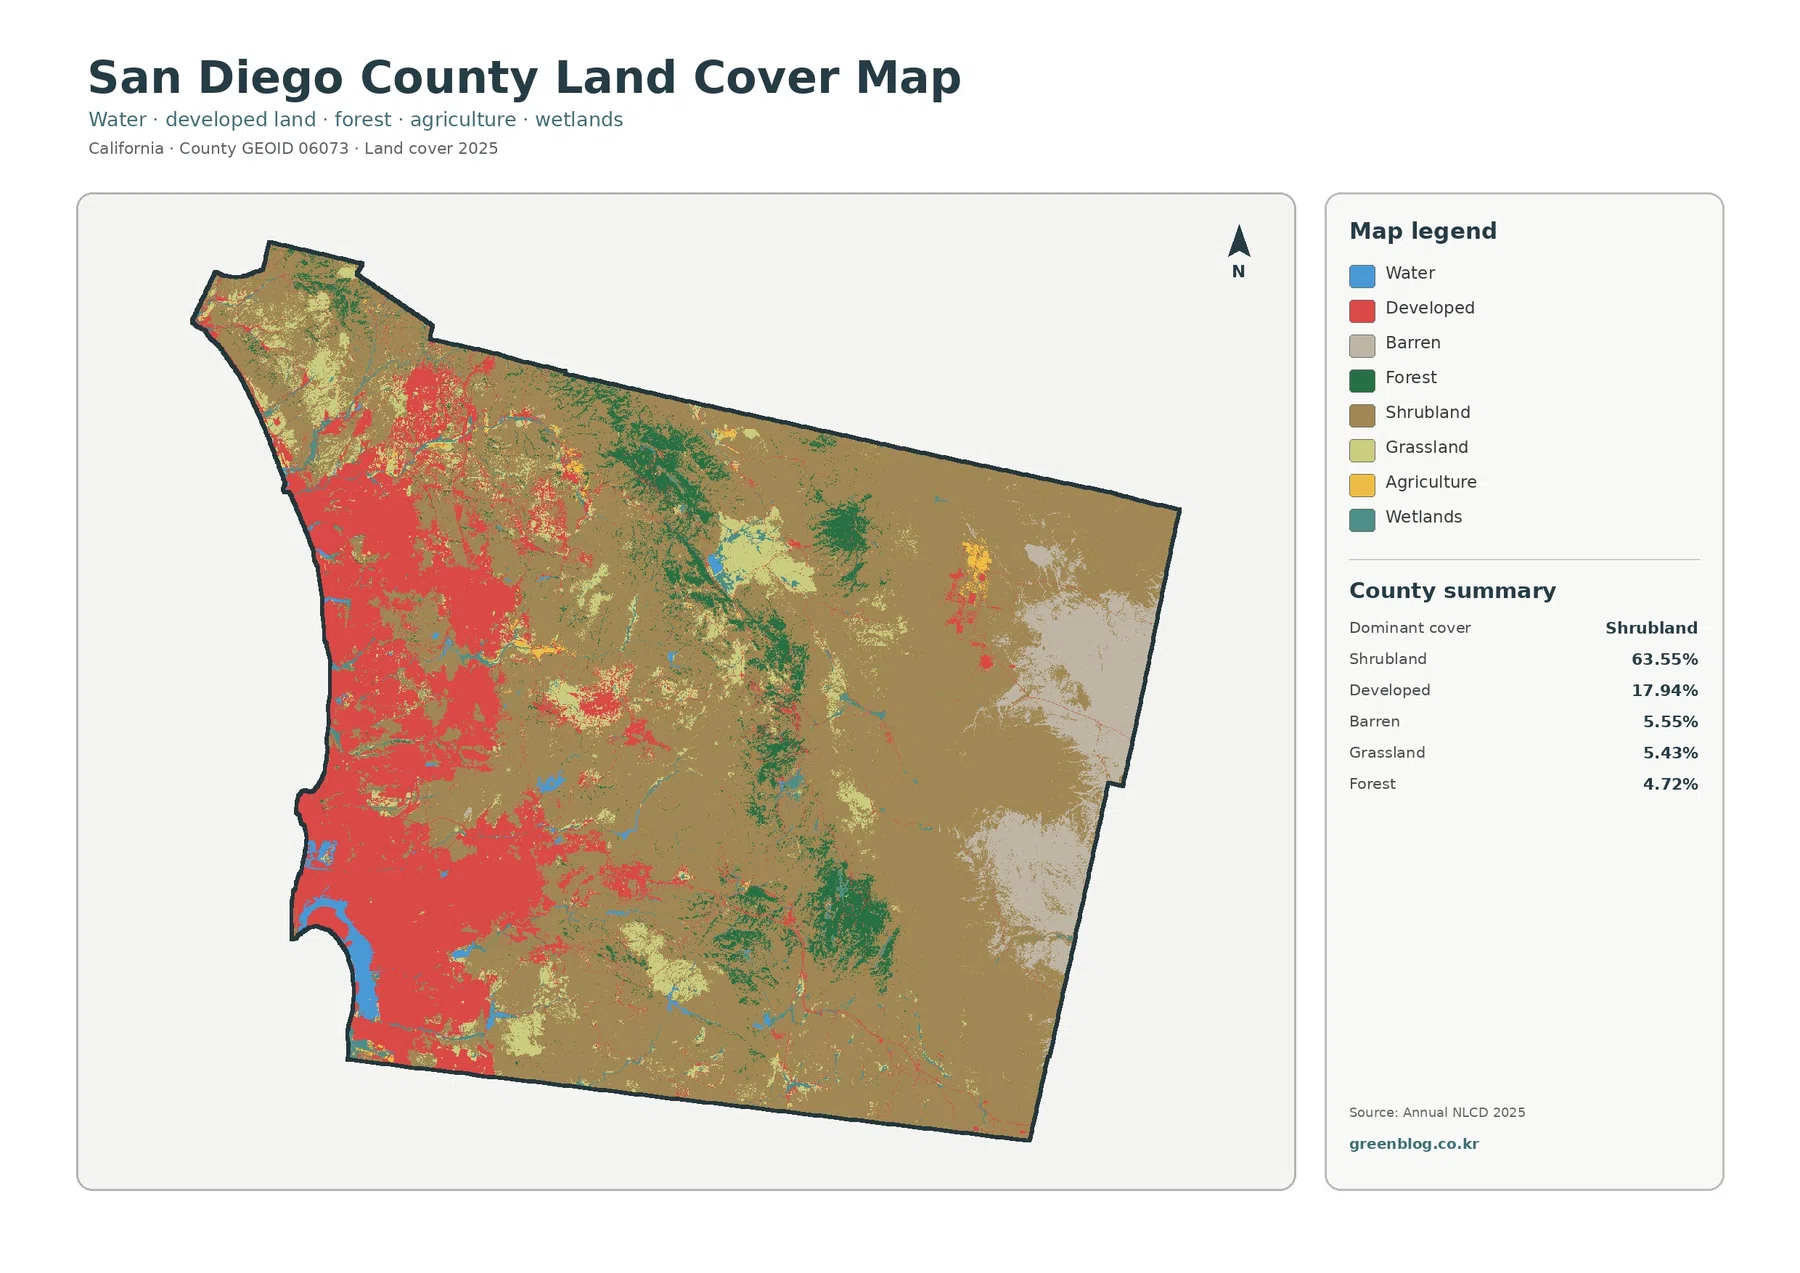
Barren land and grassland each account for a little more than 5% and appear as supporting classes rather than dominant ones. Barren areas are more noticeable in the eastern interior, while grassland is scattered among shrub and forest. Water and wetlands occupy smaller areas but remain useful visual reference points because they break up the large shrub-dominated regions.
Land cover describes what is physically covering the surface at the mapped time. It does not identify ownership, zoning, municipal boundaries, conservation status, or whether a parcel can be developed. A shrubland cell may fall on public or private land, and a developed cell does not define a legal planning district.
Forest patches trace the central uplands, while mapped agriculture remains limited
Forest makes up 4.72% of the county, yet its location is visually important. Green patches are concentrated through the central upland and mountain areas, forming several north-to-south groups between the western development and the broad inland shrubland. The forest-and-farmland view removes much of the urban color, making those wooded areas easier to compare with surrounding grass and shrub cover.
Grassland accounts for 5.43% and appears around parts of the forested interior as well as in smaller patches elsewhere. Shrubland still dominates this specialized view, which helps prevent a misleading impression that the green forest areas cover most of the county. Their placement is distinctive, but their countywide share remains below 5%.
Mapped agriculture is only 0.36%. Yellow agricultural cells occur in localized areas rather than in one continuous farm belt. The County of San Diego Agriculture, Weights & Measures department publishes separate crop and agricultural information, and those administrative statistics should not be treated as interchangeable with a satellite-based land-cover class.
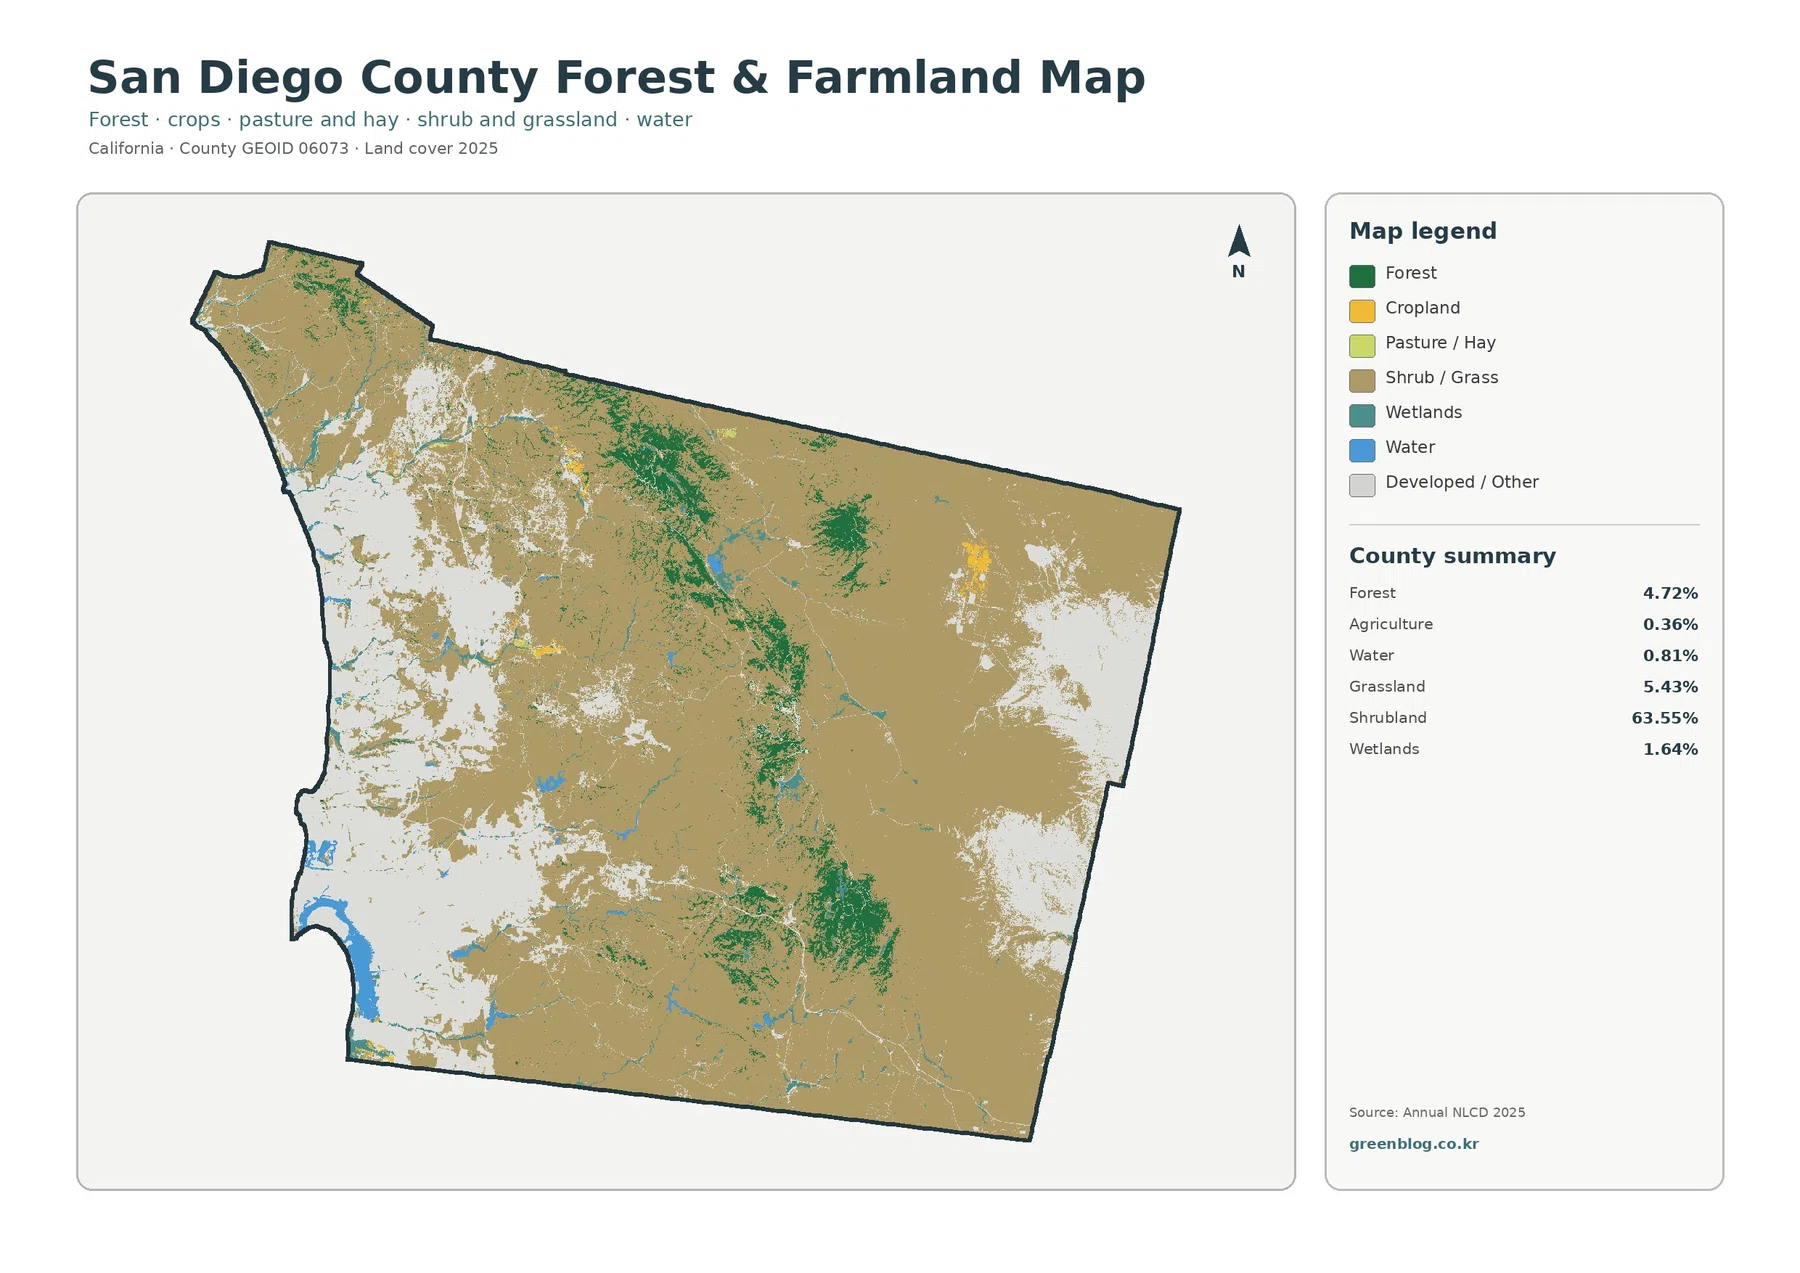
Water covers 0.81% and wetlands 1.64% in the summary. Small blue and teal features can help orient a reader, but the 30 m land-cover layer is not a legal wetland delineation or a stream-centerline dataset. Anyone studying habitat, water resources, or regulated wetlands should pair this map with the appropriate local or agency-specific source.
The 1985–2025 comparison highlights both development and classification differences
The change view compares broad land-cover classes between 1985 and 2025. A total of 20.15% is mapped with a class difference. Within that total, 4.98% is classified as a change to developed, 5.16% falls in the forest-loss category, 0.63% in agricultural loss, and 9.25% in other class differences.
Red change-to-developed areas are concentrated heavily in the west and southwest, often near the current developed footprint. Orange forest-loss cells are more common through parts of the central uplands, while purple other-class differences are scattered more widely across the north and interior. Looking back to the 2025 land-cover image helps connect each change color with the present-day cover around it.
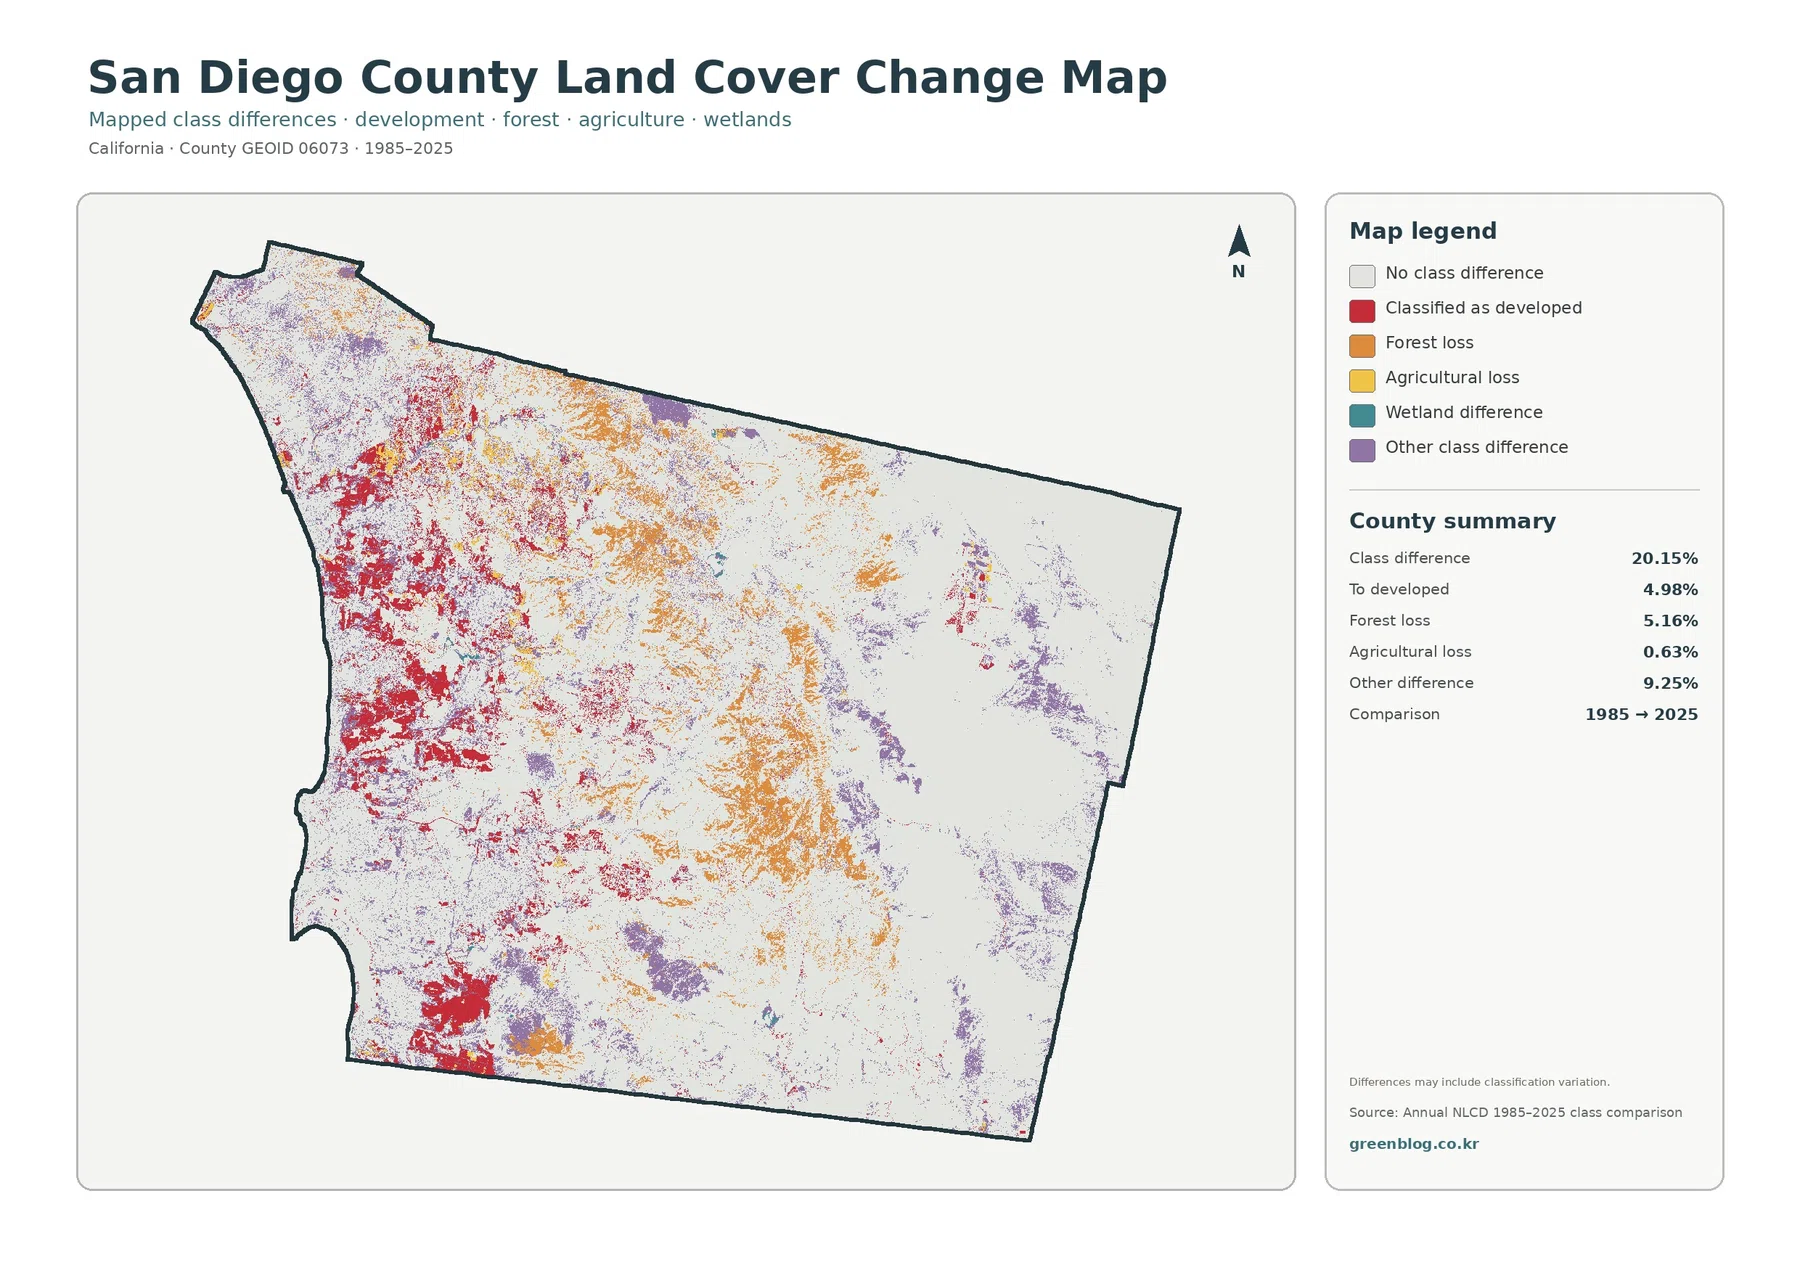
A class difference is not the same thing as a verified land-use conversion. Real development or vegetation change can be part of the result, but sensor conditions, classification methods, and mixed pixels can also shift a cell from one broad class to another. Shrub, grass, barren, and forest edges are especially important places to treat the comparison cautiously.
For a site-specific question, the change layer works best as a screening map. It can point to places worth checking with intermediate Annual NLCD years, higher-resolution imagery, fire or vegetation records, and local planning information. It should not be used by itself to assign a cause to a red, orange, or purple patch.
Frequently Asked Questions
Why does the western side look much more developed if shrubland is 63.55% countywide?
Developed cover is concentrated rather than evenly distributed. The west and southwest contain a large connected developed footprint, while shrubland spreads across a much larger central and eastern interior. A smaller countywide percentage can still dominate the appearance of one part of the map when it is tightly clustered.
What is the difference between 17.94% developed cover and 7.40% mean imperviousness?
Developed cover is a land-cover class that can include buildings, roads, lawns, trees, bare soil, and other surfaces within developed settings. Imperviousness measures the share of hard surfaces such as pavement and rooftops. Because developed areas are not completely paved, mean imperviousness can be much lower than developed cover.
Does the 20.15% class difference mean one-fifth of the county permanently changed land use?
No. It means broad land-cover classes differ between the 1985 and 2025 comparison for 20.15% of the mapped area. Real change can be included, but classification variation and mixed pixels can also contribute. Confirming a specific cause requires intermediate dates and more detailed local evidence.
Map File Information
The download ZIP contains four JPG files for San Diego County: overall land cover, forest and farmland, impervious surface with developed land, and the 1985–2025 land-cover class comparison. All four use the same county boundary, so they can be placed side by side in reports, classroom materials, presentations, or reference graphics.
For print use, choose the two maps that best match the question rather than shrinking all four onto one page. Overall cover plus impervious surface works well for an urban topic. Forest and farmland beside overall cover is clearer for natural-cover comparisons. If long-term change is the focus, place the change map next to the 2025 land-cover map and label both years prominently.
These JPGs are finished reference graphics, not analytical raster or vector files. If you need cell values, acreage calculations, custom classification work, or GIS overlays, use the source Annual NLCD data and an appropriate county boundary dataset rather than measuring the image itself.
Scale, mixed pixels, and planning boundaries set clear limits on interpretation
Annual NLCD uses raster cells of about 30 meters. A single cell can contain pavement, trees, soil, roofs, and shrubs, yet the land-cover image assigns a representative class. Mixed pixels are therefore unavoidable along urban edges, mountain transitions, narrow waterways, and small agricultural patches. The colored boundary on the map should be read as generalized, not as a survey line.
The 2025 layer also represents a specific observation period. Development, fire, vegetation recovery, or agricultural activity after that year will not appear until reflected in later data. The 1985–2025 comparison has the same limitation and adds the possibility that classification choices differ between the two periods.
Planning information is a separate layer of evidence. The County of San Diego General Plan applies to the unincorporated area and addresses infrastructure, housing, agriculture, communities, and open space. Those legal and policy questions cannot be answered from land-cover color alone. Likewise, the County Conservation program identifies conservation planning work that should not be inferred simply from the presence of shrubland, forest, or wetlands in this map.
Map File Information
Download the four original San Diego County land-cover JPG maps together in one ZIP file.
- File Type: ZIP containing 4 JPG files
Related Maps
- Alameda County California Land Cover Map
- Alpine County California Land Cover Map
- Amador County California Land Cover Map
Data sources and official references
These links provide the land-cover classification and boundary sources used for interpretation, plus official San Diego County pages that help keep agriculture, conservation, and planning questions separate from satellite land cover.
- MRLC Annual NLCD Data — source access for Annual NLCD land-cover products
- USGS Annual NLCD Land Cover Classification — class definitions and interpretation
- U.S. Census Bureau TIGER/Line Shapefiles — county boundary reference
- County of San Diego Conservation — official conservation programs and habitat-planning context
- County of San Diego General Plan — planning context for the unincorporated county
- San Diego County Agriculture, Weights & Measures — county agricultural programs and crop information
Green Map creates custom-edited map images using open geographic data sources such as geoBoundaries, Natural Earth, OpenStreetMap, and government open data.
These maps are edited visual materials, not raw data files, and are provided for education, documents, presentations, and graphic reference.