Orange County looks very different from most of the California counties in this map series because developed cover is the dominant 2025 class. Red developed land occupies much of the west and north, while a broad band of shrubland and grassland remains across the east and southeast. The four maps on this page separate that contrast into current land cover, forest and farmland, impervious surface, and mapped class differences between 1985 and 2025.
The four original JPG maps are available together in one download near the end of the page. Use the general map for a quick countywide view, the impervious map when hard urban surfaces are the main question, and the other two maps for vegetation, agriculture, water, or change. Land cover describes what is physically covering the ground in the mapped data; it is not a zoning map, property map, ownership record, or statement about what can legally be built on a parcel.
Table of Contents
A county where developed cover reaches 61.56 percent
Developed land accounts for 61.56% of the 2025 county summary, by far the largest single class. Shrubland follows at 26.39%, then grassland at 6.72%, forest at 2.40%, and wetlands at 1.33%. The forest-and-farmland view also reports water at 0.70% and agriculture at 0.68%. These numbers immediately distinguish Orange County from a forest-dominated, agricultural, or desert county, yet the map is not uniformly urban from boundary to boundary.
The broadest developed field covers the western side and extends through much of the north. Instead of isolated red towns surrounded by natural cover, large developed areas connect into one another across this part of the county. Moving toward the eastern boundary changes the picture quickly. Brown shrubland becomes the main color, pale grassland appears in larger patches, and small forest areas occupy selected upland pockets rather than forming a continuous forest belt.
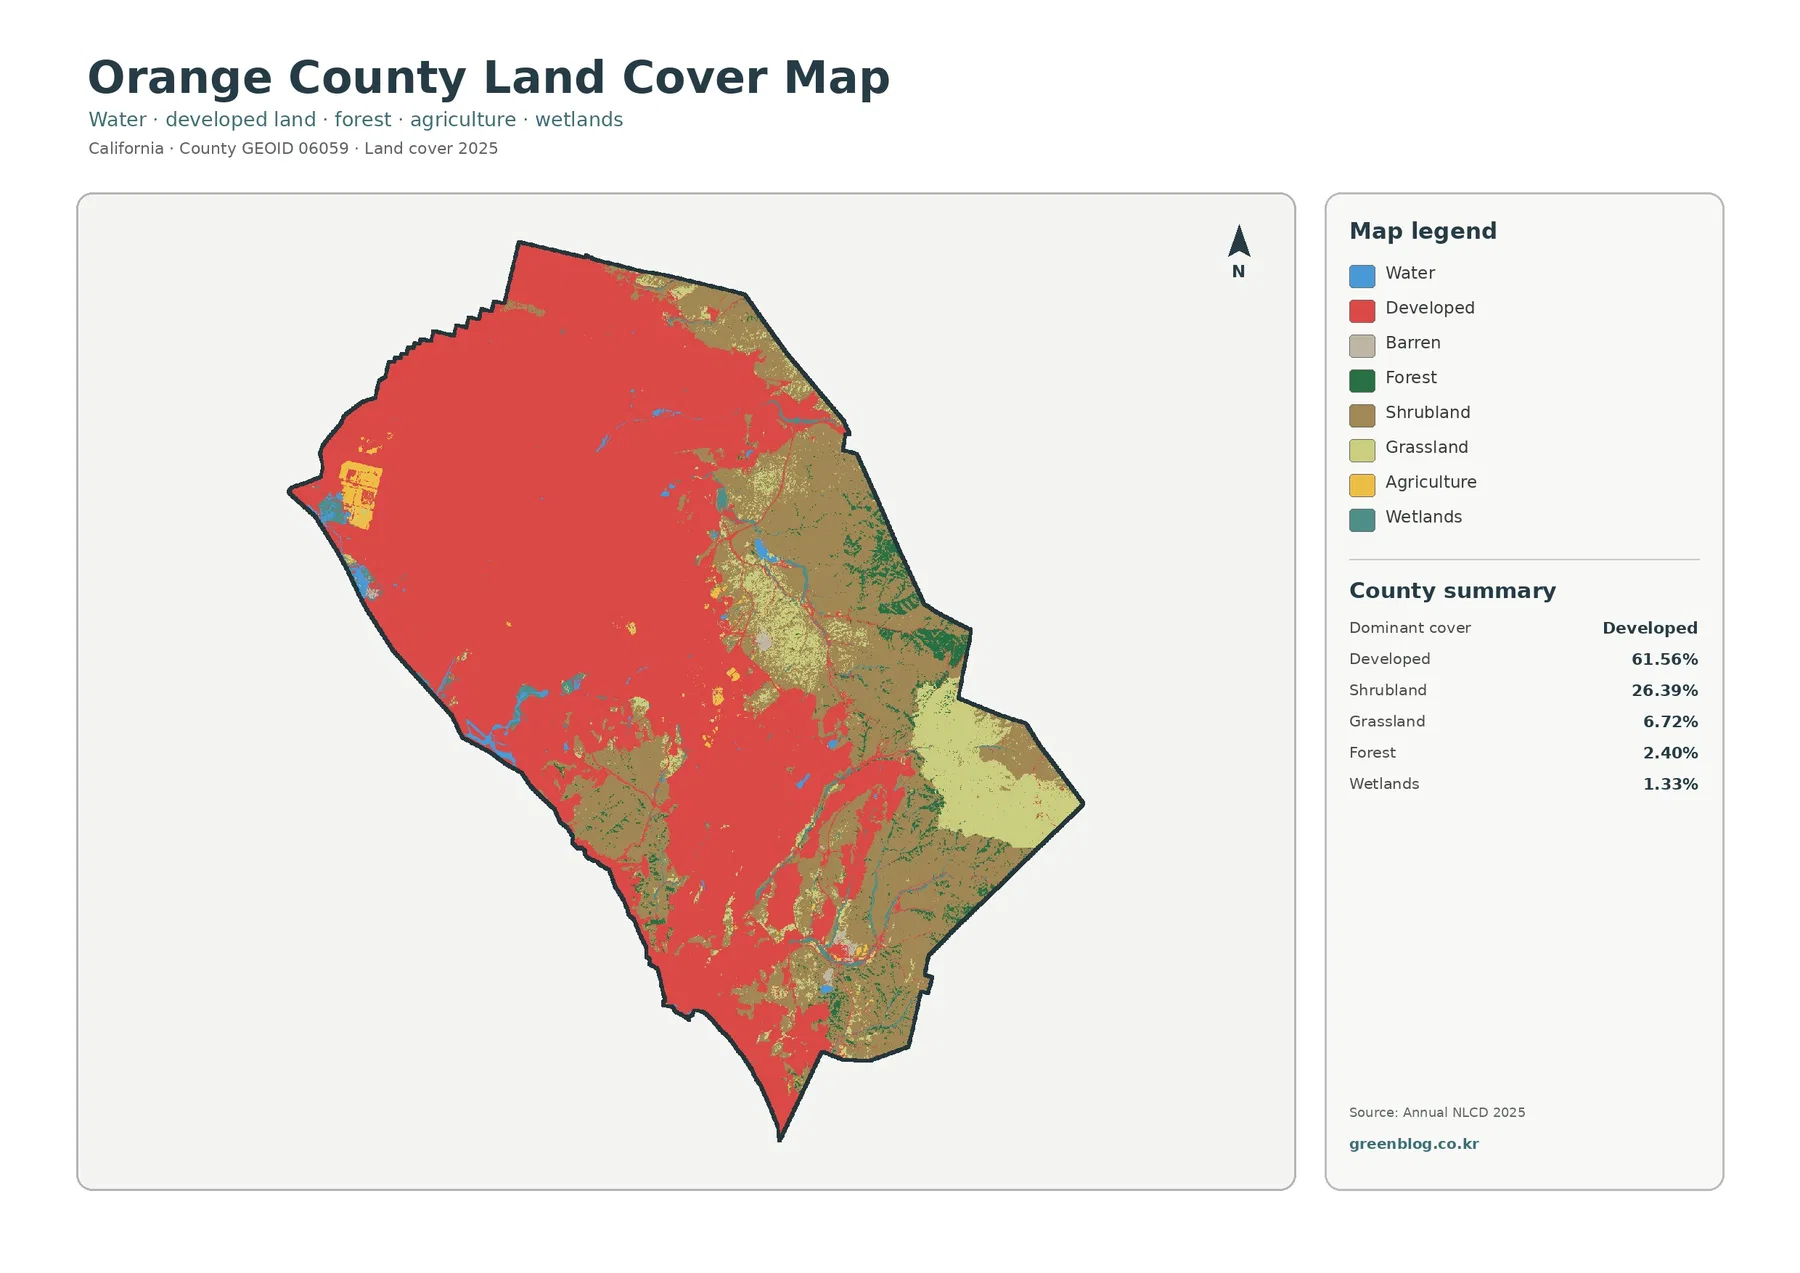
That red developed class should not be read as 61.56% pavement. NLCD development categories can include places where buildings and roads are mixed with lawns, trees, bare soil, and other permeable surfaces. The general map therefore tells us where developed land cover is dominant, while the impervious map answers the narrower question of how much hard surface is present. Keeping those two ideas separate is especially important in Orange County because both measures are high but they are not the same number.
The map also avoids a second common mistake: natural-cover colors do not automatically define parks or protected land. Orange County does have extensive official park and wilderness holdings. The county describes a regional system of 25 urban and wilderness parks covering 39,000 acres, including 7,000 acres of open space. Those administrative lands provide useful local context, but their boundaries should not be inferred from shrub, grass, forest, or wetland pixels on this land-cover graphic.
Impervious surface makes the west-east contrast even sharper
Impervious surface means hard material such as pavement and rooftops that prevents much of the rainfall from soaking directly into the ground. Orange County has a mean impervious value of 34.41%, and 42.93% of the mapped county is in cells with at least 50% impervious cover. Those figures are high enough that the impervious map is not just a small variation on the general map. It provides a second, more specific view of the urban footprint.
Dark red and orange shades spread across the west and north, with many connected areas reaching the higher impervious classes. The colors remain strong through much of the south-western developed zone as well. In contrast, the eastern third changes to white or very light values over large shrub- and grass-covered areas. The sharp transition shows that a county with more than sixty percent developed land can still contain extensive areas where hard surface is sparse.
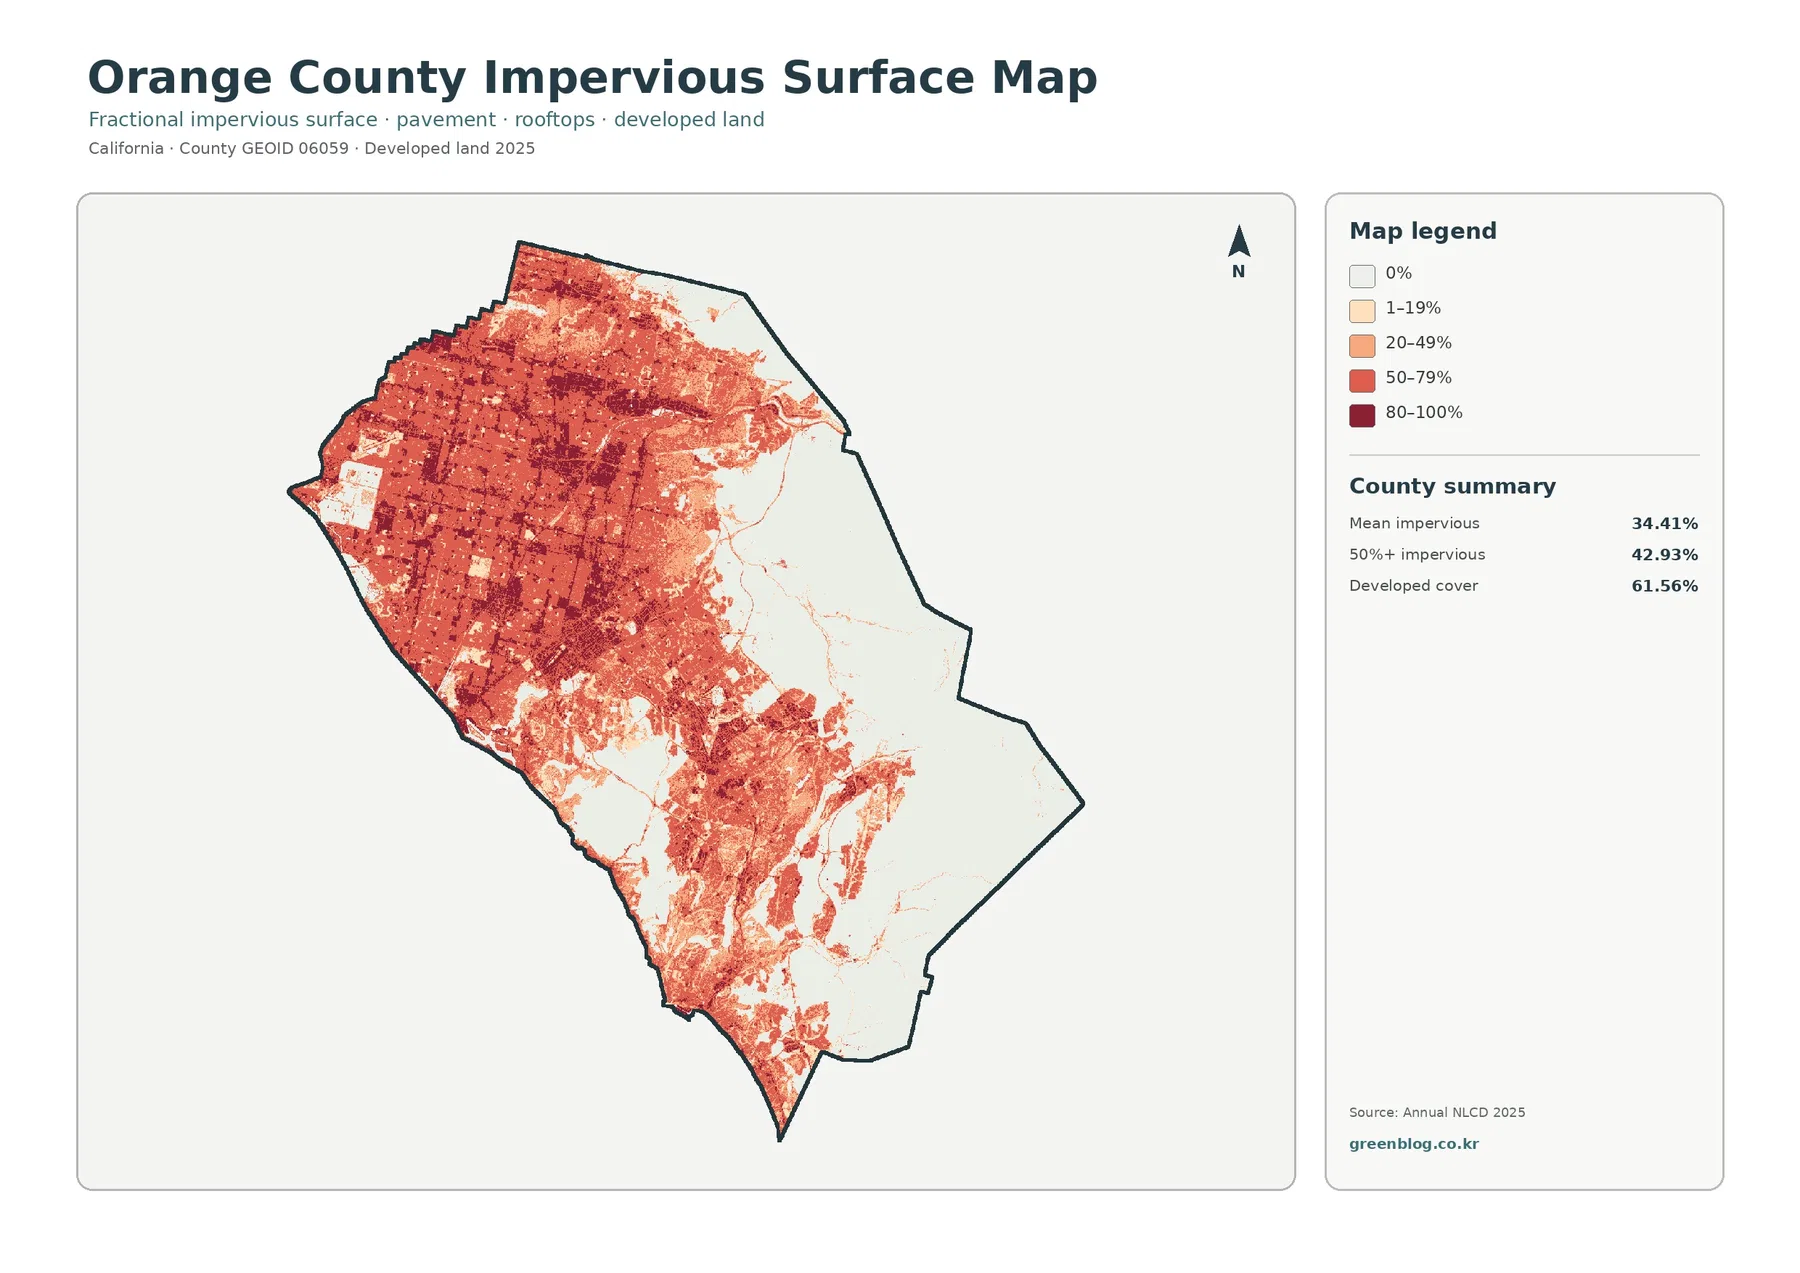
This view is useful for comparing urban surface intensity, but it does not provide a complete flood or drainage assessment. Runoff depends on more than pavement. Elevation, soil, storm drains, channels, rainfall, stream networks, and local engineering all matter. OC Watersheds maintains official county information on water quality and watershed conditions, so that program is a better next source when a map question turns into a stormwater or surface-water question.
Scale also matters. Annual NLCD is a raster product designed for consistent regional comparison, not a building-by-building survey. A grid cell can contain a road, tree canopy, lawn, and roof edge at the same time, and the mapped value generalizes that mixture. The impervious image is therefore strongest when used to compare broad neighborhoods of higher and lower hard-surface concentration, not when measuring a particular driveway or parcel.
Shrubland and grassland form the main natural-cover block in the east
Shrubland alone represents 26.39% of Orange County, and grassland adds another 6.72%. Together they make up 33.11% of the county summary. Their distribution is far from random: the largest connected areas lie along the eastern and southeastern side of the county, where the developed colors thin out. Smaller strips and patches also appear along the edges of urban land, creating visible transition zones between dense development and less developed uplands.
Forest is only 2.40%, so green areas are much smaller than the shrubland field. They appear mainly as scattered pieces within the eastern uplands and toward the southeast. Wetlands account for 1.33% and are more localized still. Water is only 0.70% in the forest-and-farmland summary, but blue pixels stand out because they contrast strongly with both urban gray and the tan natural-cover classes.
This distribution is useful for understanding why a single label such as “urban county” is incomplete. Western Orange County is dominated by connected developed cover, but the eastern side retains a large nonurban landscape made mostly of shrubs and grass rather than dense forest. The official county park system includes several regional and wilderness properties in these broader natural landscapes. Still, the map class itself should be treated as surface cover, not as a park designation or conservation boundary.
Forest and farmland are small percentages but still useful to isolate
The forest-and-farmland map removes much of the visual competition from developed land by grouping developed and other classes into a light background. That change in design makes the small 2.40% forest share easier to find. Green patches become visible within the eastern and southeastern uplands, while shrub and grass remain the broader natural-cover matrix. The map is especially helpful when the question is not “where is development?” but “where are the remaining tree-dominated areas within the nonurban side of the county?”
Agriculture is only 0.68% in the 2025 summary. Yellow agricultural pixels appear in a limited western area and in a few smaller pieces rather than forming a continuous valley-wide farm region. Because the percentage is so small, an agriculture-focused reader should avoid assuming that every open or grassy area is farmland. Shrubland and grassland dominate the nonurban land cover, and the agricultural class is a separate, much smaller category.
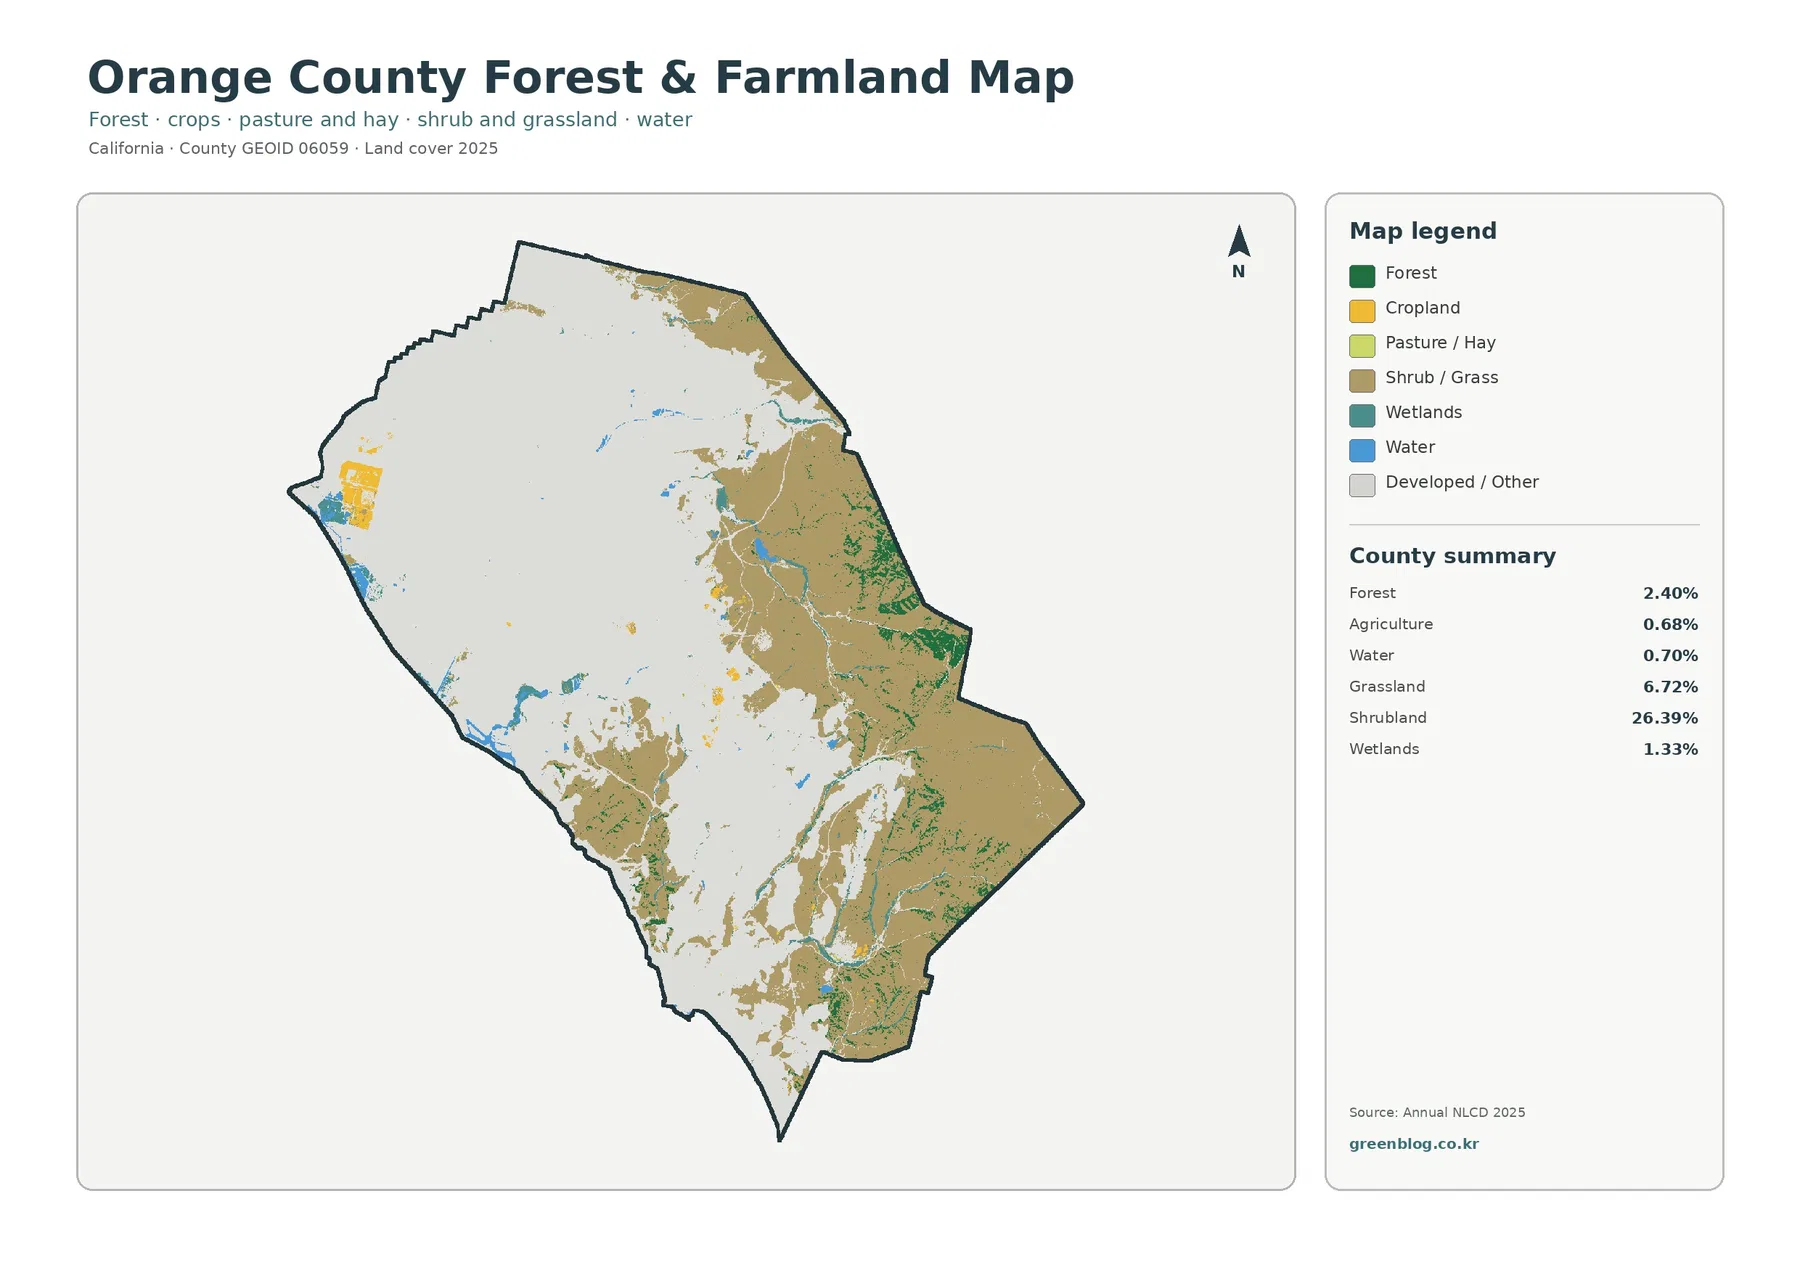
The agriculture class does not identify crops, farm ownership, agricultural zoning, or land-conservation status. It simply marks cells classified as agricultural cover in the supplied 2025 dataset. A yellow patch should therefore be used as a location clue, not as evidence of a particular crop or legal land use. County agricultural records, parcel data, or planning documents would be necessary for those more detailed questions.
The same rule applies to forest. A green cell indicates tree-dominated land cover at the map scale, not ownership by a forestry agency or the boundary of a wilderness area. This distinction is important in Orange County because formal parks, open spaces, neighborhoods, and natural vegetation can sit close together. The land-cover map and official administrative maps answer different questions and work best as complementary references.
The 1985–2025 comparison separates current urban land from mapped change
The change map reports a total class difference of 31.51% between 1985 and 2025. Within the summary, 12.24% is labeled as classified to developed, 3.13% as forest loss, 0.19% as agricultural loss, and 15.77% as other class difference. Wetland difference is also a legend category, although the side summary does not print a separate percentage for it. The total is a comparison of endpoint classifications rather than a simple measure of new construction.
A large part of the heavily developed west remains light on the change map, which means many cells kept the same broad class at the two endpoints. Red areas classified to developed are more prominent along southern and interior development edges and in several bands closer to the natural-cover side of the county. Purple other differences and orange forest-loss areas become more visible toward the east and southeast. That pattern helps separate long-established developed cover from places where the mapped class differs between the two selected years.
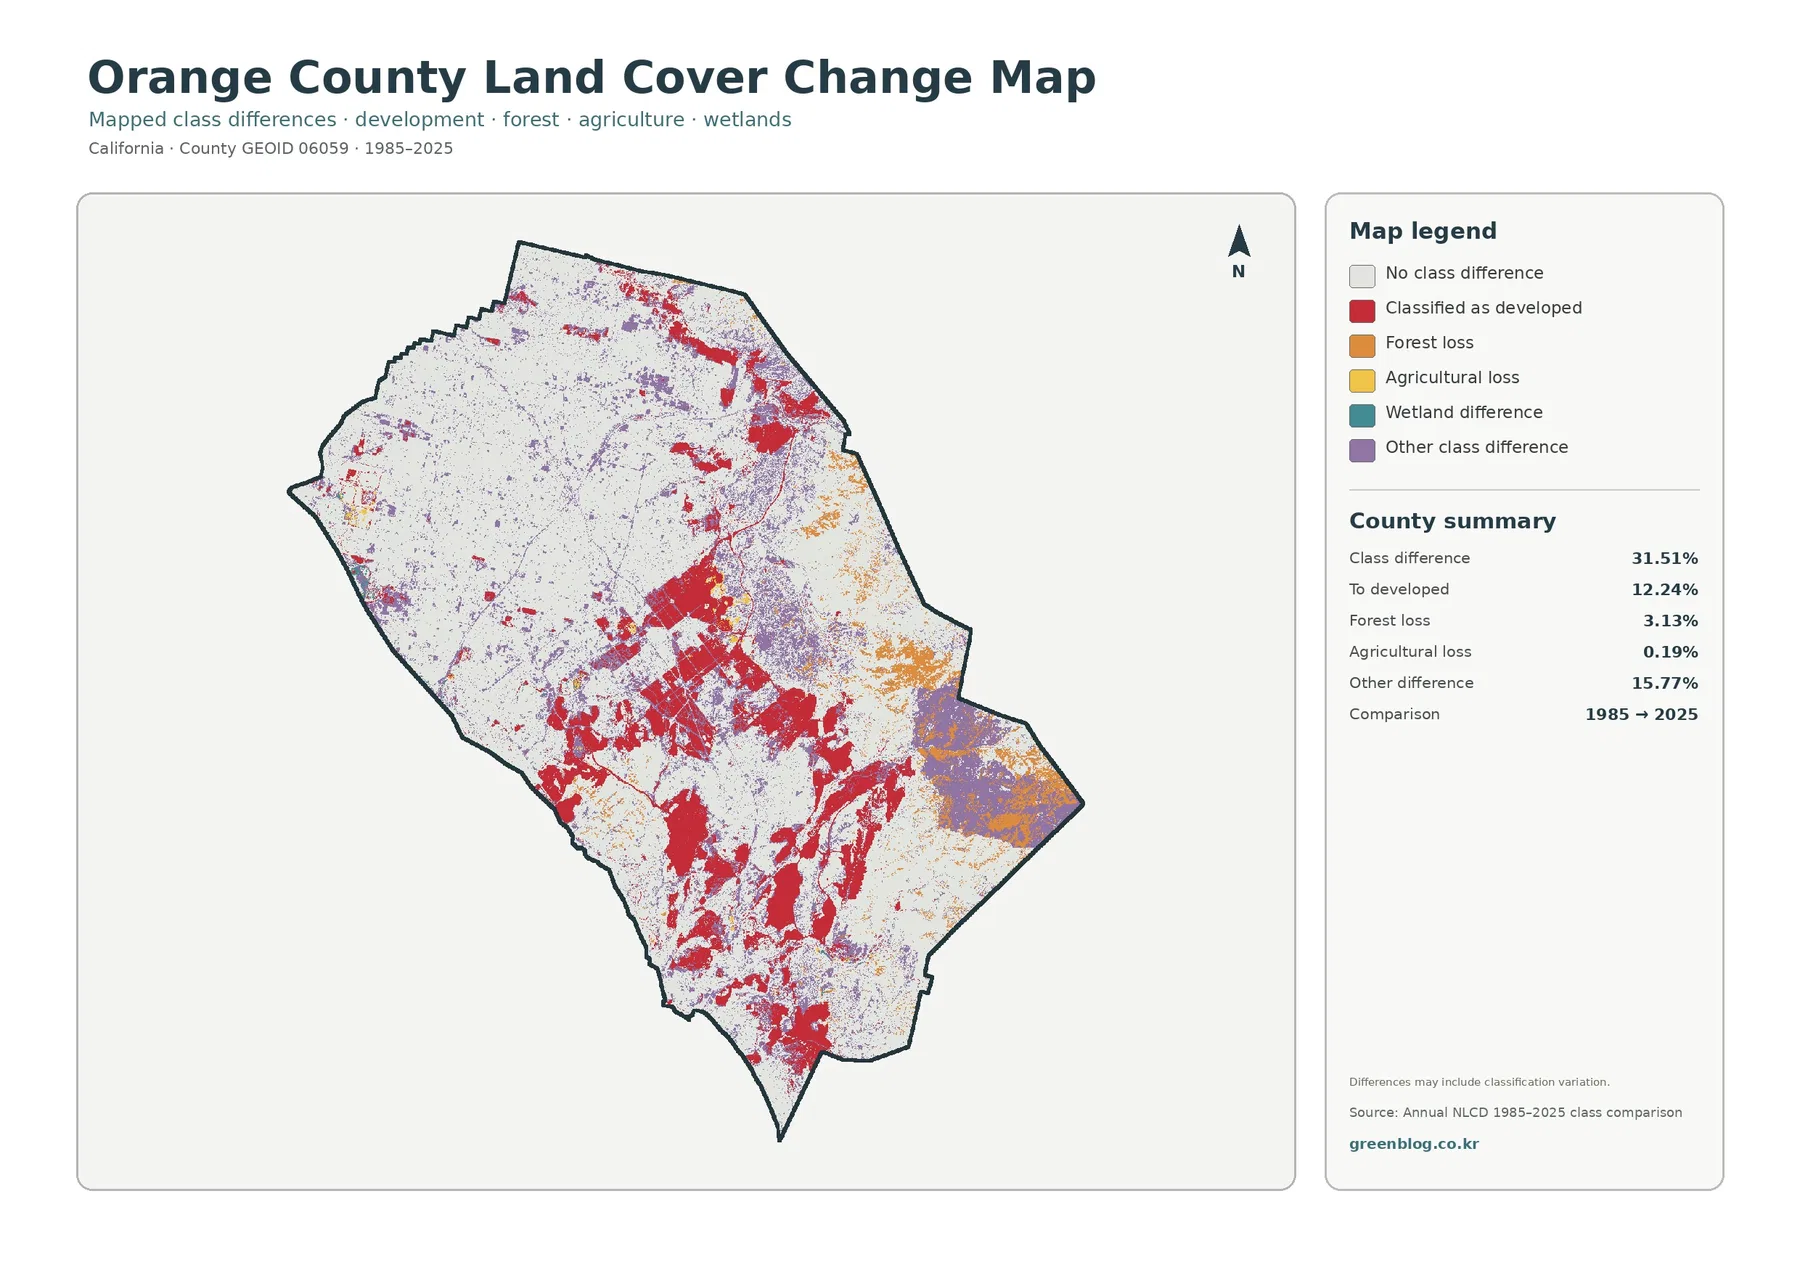
The 31.51% figure should not be rewritten as “31.51% of Orange County physically changed completely.” The map itself notes that classification variation can be included. Differences in imagery, seasonal vegetation, mixed pixels, and classification decisions can contribute to a different label at an endpoint. Real change is part of the signal, but the map does not identify the precise cause for every colored cell.
The same caution applies to the 12.24% classified-to-developed category. It does not mean that all of those cells changed in one year or that the map provides a construction date. Forest-loss pixels do not establish whether fire, clearing, drought, vegetation succession, or another process was responsible. A careful follow-up would compare intermediate NLCD years, aerial imagery, fire records, planning information, or other local evidence before assigning a cause.
How to use the four Orange County views together
For a quick description of the county, start with the general land-cover map. It establishes the most important fact: developed cover dominates the west and north, while shrubland and grassland occupy much of the east. The forest-and-farmland map is a useful second view because it removes much of the developed color and exposes the much smaller forest and agricultural classes. Together, those two images distinguish the broad urban-natural contrast from the details inside the natural side of the county.
The impervious map should come next when the subject is urban surface rather than land-cover category. Comparing 61.56% developed cover with a 34.41% mean impervious value makes it clear that developed land is not entirely roof and pavement. The 42.93% share mapped at 50% impervious or higher then identifies where harder surfaces are most concentrated. This is a useful distinction for environmental education, watershed discussions, and presentations about urbanization.
Use the change map last if the question involves time. A place that is red on the 2025 land-cover map may have been developed at both endpoints and therefore show no major class difference on the change image. Conversely, a colored change cell identifies a different endpoint classification but does not reveal the exact year or cause. Reading the maps in this order reduces the risk of confusing current land cover with historical transition.
The four JPG files also work well as separate reference graphics. A presentation about urban surfaces may need only the general and impervious maps. A classroom comparison of natural cover can pair the general map with the forest-and-farmland view. A preliminary landscape-change exercise can use all four images to select areas for deeper research, then move to official datasets or higher-resolution imagery when precise analysis is required.
Map File Information
The WebP images on the page are previews. The download contains four original JPG files for Orange County, one for each theme: general land cover, forest and farmland, impervious surface and developed land, and the 1985–2025 class-difference map. Each file can be used on its own or placed beside the others for a consistent county-outline comparison.
Keep the legend and map year attached when using a JPG in print or presentation material. The current-cover maps are based on the supplied 2025 classification, and the change image compares 1985 with 2025. Removing those labels can make a later viewer assume the map is current to a different year or that the change colors represent a different time span. The downloadable images are finished reference graphics, not raw GIS layers.
Reading 30-meter raster classes without over-interpreting them
Annual NLCD uses raster cells to describe land cover consistently across large areas. A raster divides the landscape into a regular grid and stores a representative value for each cell. At the 30-meter scale used by these products, small features can be generalized. A cell near the edge of a neighborhood might contain pavement, a roof, trees, and grass, yet it still receives a mapped class or impervious value that summarizes the cell.
Mixed pixels matter along the eastern urban edge, narrow wetland strips, small water bodies, and boundaries between shrubland and grassland. A crisp line on the finished county map may hide a more gradual transition on the ground. The change map has the same limitation because a boundary cell can receive different labels in two endpoint years. Small isolated change patches deserve closer inspection before they are treated as confirmed physical change.
Legal land use is outside the purpose of these maps. A developed class does not say whether a parcel can be redeveloped. Shrubland or forest does not prove that land is protected, and the 0.68% agricultural class does not define agricultural zoning or ownership. Parcel, zoning, permit, conservation, and regulatory questions should be checked against the appropriate Orange County or city records.
Frequently Asked Questions
Why is developed cover 61.56% while mean impervious surface is only 34.41%?
The two values measure different things. Developed land is a land-cover classification that can include vegetation and other permeable ground mixed with buildings and roads. Impervious surface estimates the share of hard material such as pavement and rooftops. Orange County can therefore have 61.56% developed cover while the countywide mean impervious value is 34.41%. Reading both maps together gives a more complete picture of the urban landscape.
Which map best shows the contrast between urban western Orange County and the eastern natural-cover area?
Start with the general 2025 land cover map. It places the developed western area and the shrub and grass cover in the east on the same map. Use the forest and farmland map when you want to locate the smaller forest patches.
Does the 31.51% class difference mean that nearly one-third of the county definitely changed land use?
No. It means that 31.51% of mapped cells have different land-cover classes at the 1985 and 2025 endpoints. Real land-cover change can be included, but classification variation, imagery differences, mixed pixels, and seasonal vegetation can also affect the comparison. The map is best used to locate areas for follow-up, not to assign a cause without intermediate data and other evidence.
Sources and reference material
These links provide official background for the land-cover classes, county boundaries, Orange County park and open-space context, and local watershed information. They answer different questions, so land-cover colors should not be substituted for legal or administrative boundaries.
- MRLC Annual NLCD Data — annual land-cover and related data products
- USGS Annual NLCD Land Cover Classification — land-cover classes and legend documentation
- U.S. Census Bureau TIGER/Line Shapefiles — county boundary reference data
- Orange County Regional & Wilderness Parks — official county park, wilderness, and open-space context
- OC Watersheds State of the Environment Reports — official Orange County watershed and water-quality resources
Map File Information
The ZIP includes all four original JPG land-cover maps for Orange County, California.
- File Type: ZIP containing four JPG files
Related Maps
- Alameda County California Land Cover Map
- Alpine County California Land Cover Map
- Amador County California Land Cover Map
Green Map creates custom-edited map images using open geographic data sources such as geoBoundaries, Natural Earth, OpenStreetMap, and government open data.
These maps are edited visual materials, not raw data files, and are provided for education, documents, presentations, and graphic reference.