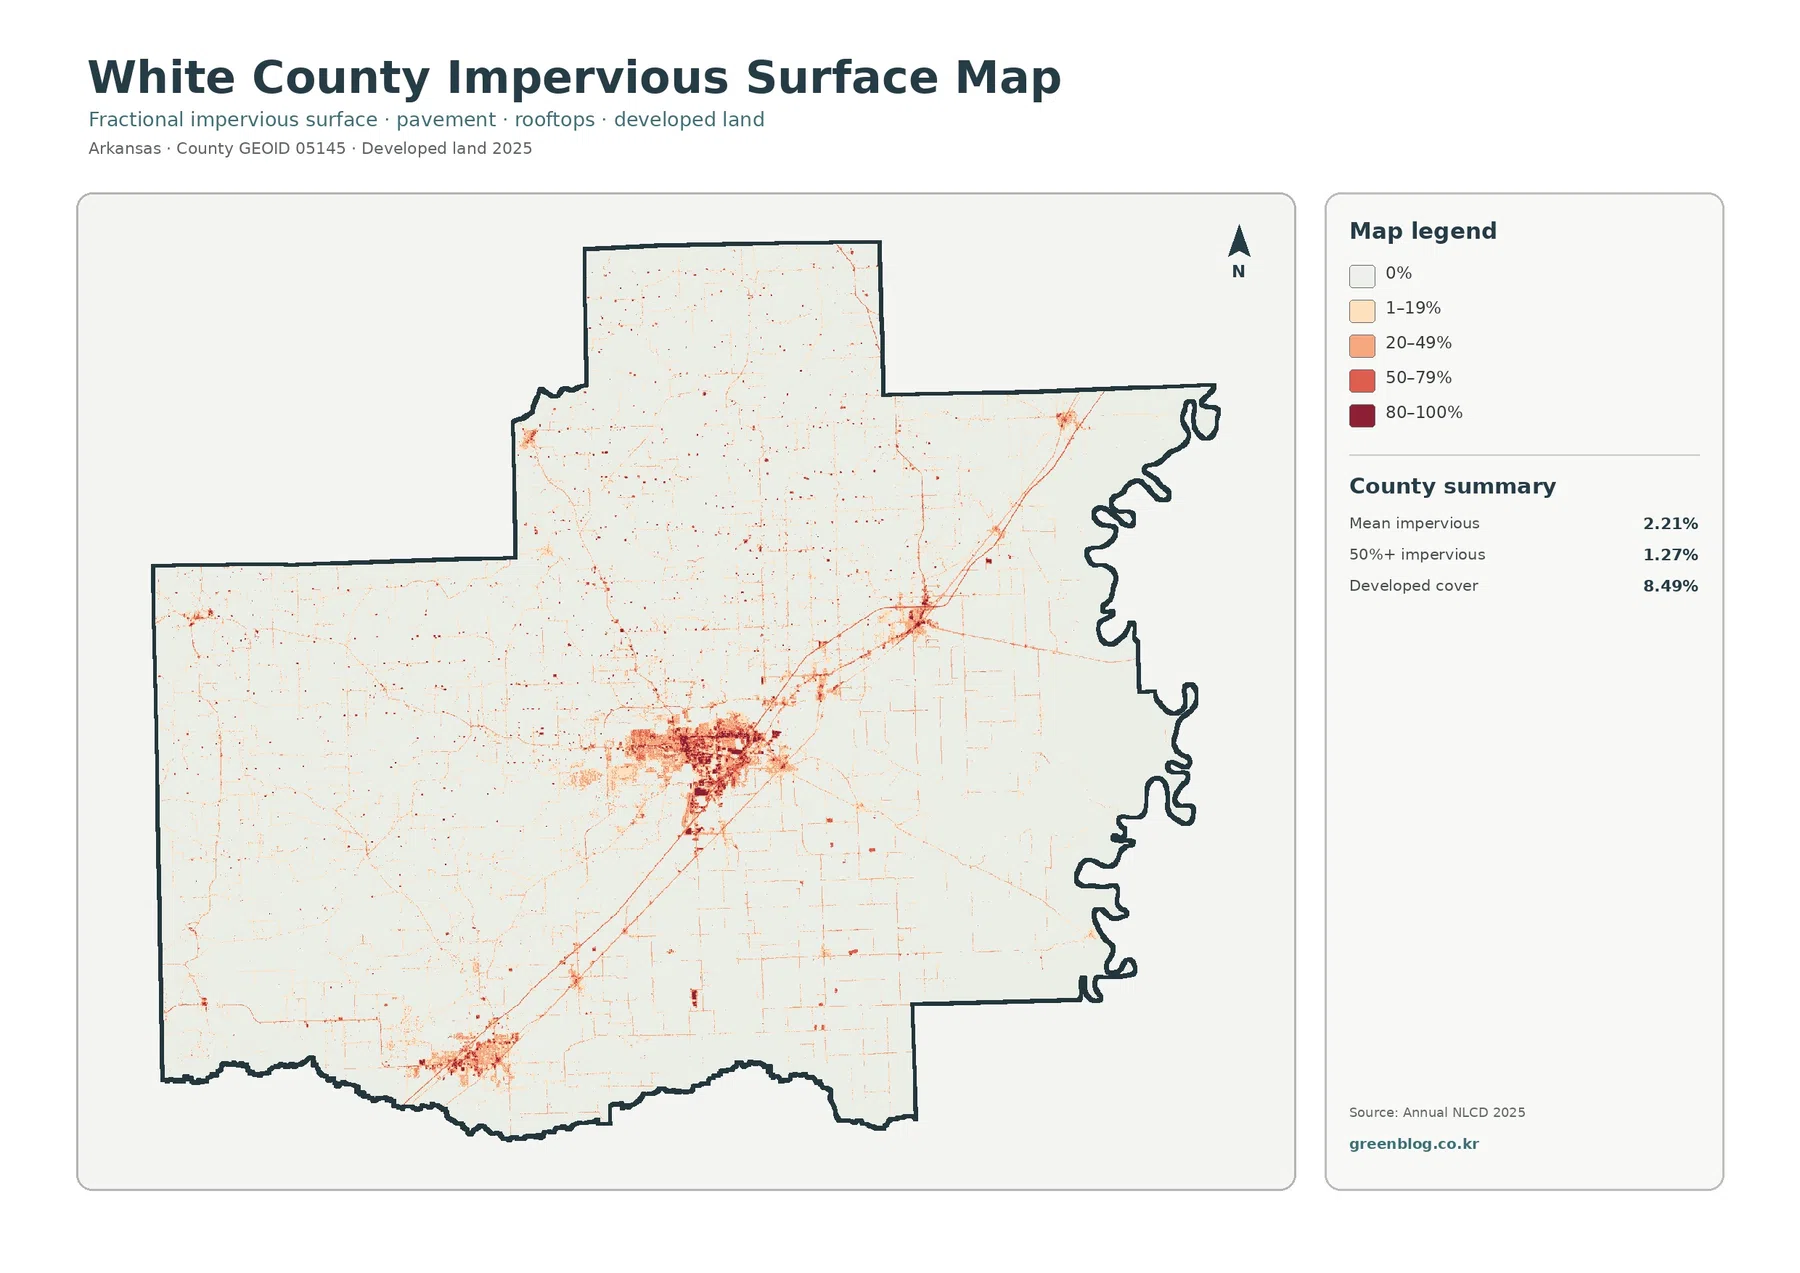
White County has one of the clearest east-west land-cover contrasts in this Arkansas map set. Agriculture accounts for 49.50% of the 2025 summary, forest for 26.75%, wetlands for 11.89%, and developed land for 8.49%. Broad farm and wetland areas dominate the eastern lowlands, while more forest and pasture-like cover appears toward the west and north. Searcy stands out as the largest developed concentration near the middle of the county.
The page includes four views of the same county: current land cover, forest and farmland, impervious surface and developed land, and mapped differences between 1985 and 2025. The WebP images are intended for quick viewing, while the four original JPG maps are available together in one download. Comparing them side by side makes it easier to separate broad land-cover classes from hard urban surfaces and long-term classification change.
Table of Contents
Agriculture covers nearly half the county, but it does not look the same from east to west
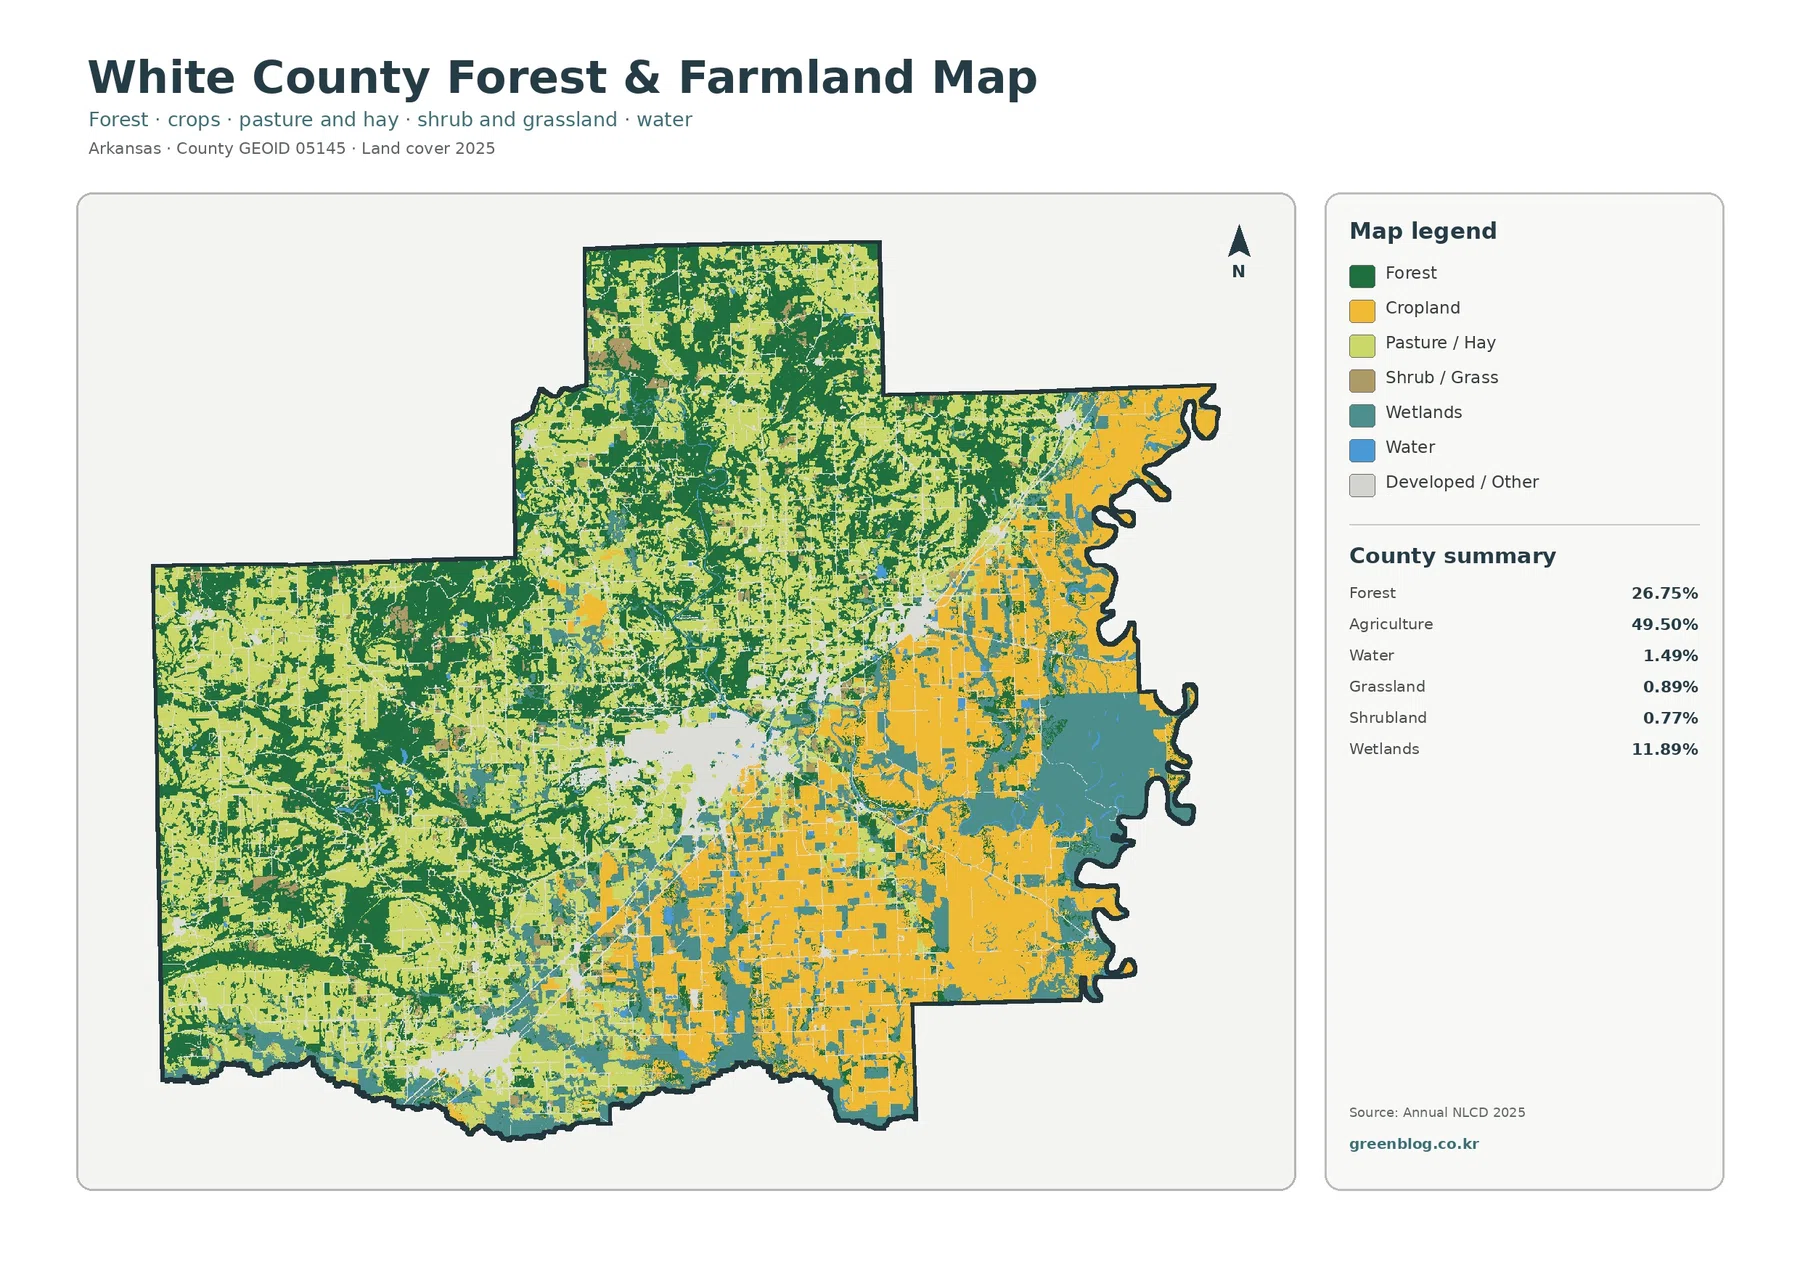
The general 2025 map is dominated by yellow agricultural cover, especially across the eastern and southeastern parts of White County. Those areas form large, relatively continuous blocks. Farther west, agricultural cover breaks into smaller pieces among forest and lighter open-land classes. The contrast matters because the countywide figure of 49.50% agriculture can sound uniform even though the mapped pattern is anything but uniform.
Arkansas Heritage describes eastern White County as alluvial lowland used extensively for farming and timber production, while the western half has rockier, higher ground associated with cattle and dairy farming. That regional description matches the broad pattern visible here without requiring the land-cover map to act as a topographic map. The east has more large cropland blocks and wetlands; the west contains more forest interspersed with open agricultural cover.
Searcy is easy to locate when the map switches from land cover to hard surfaces
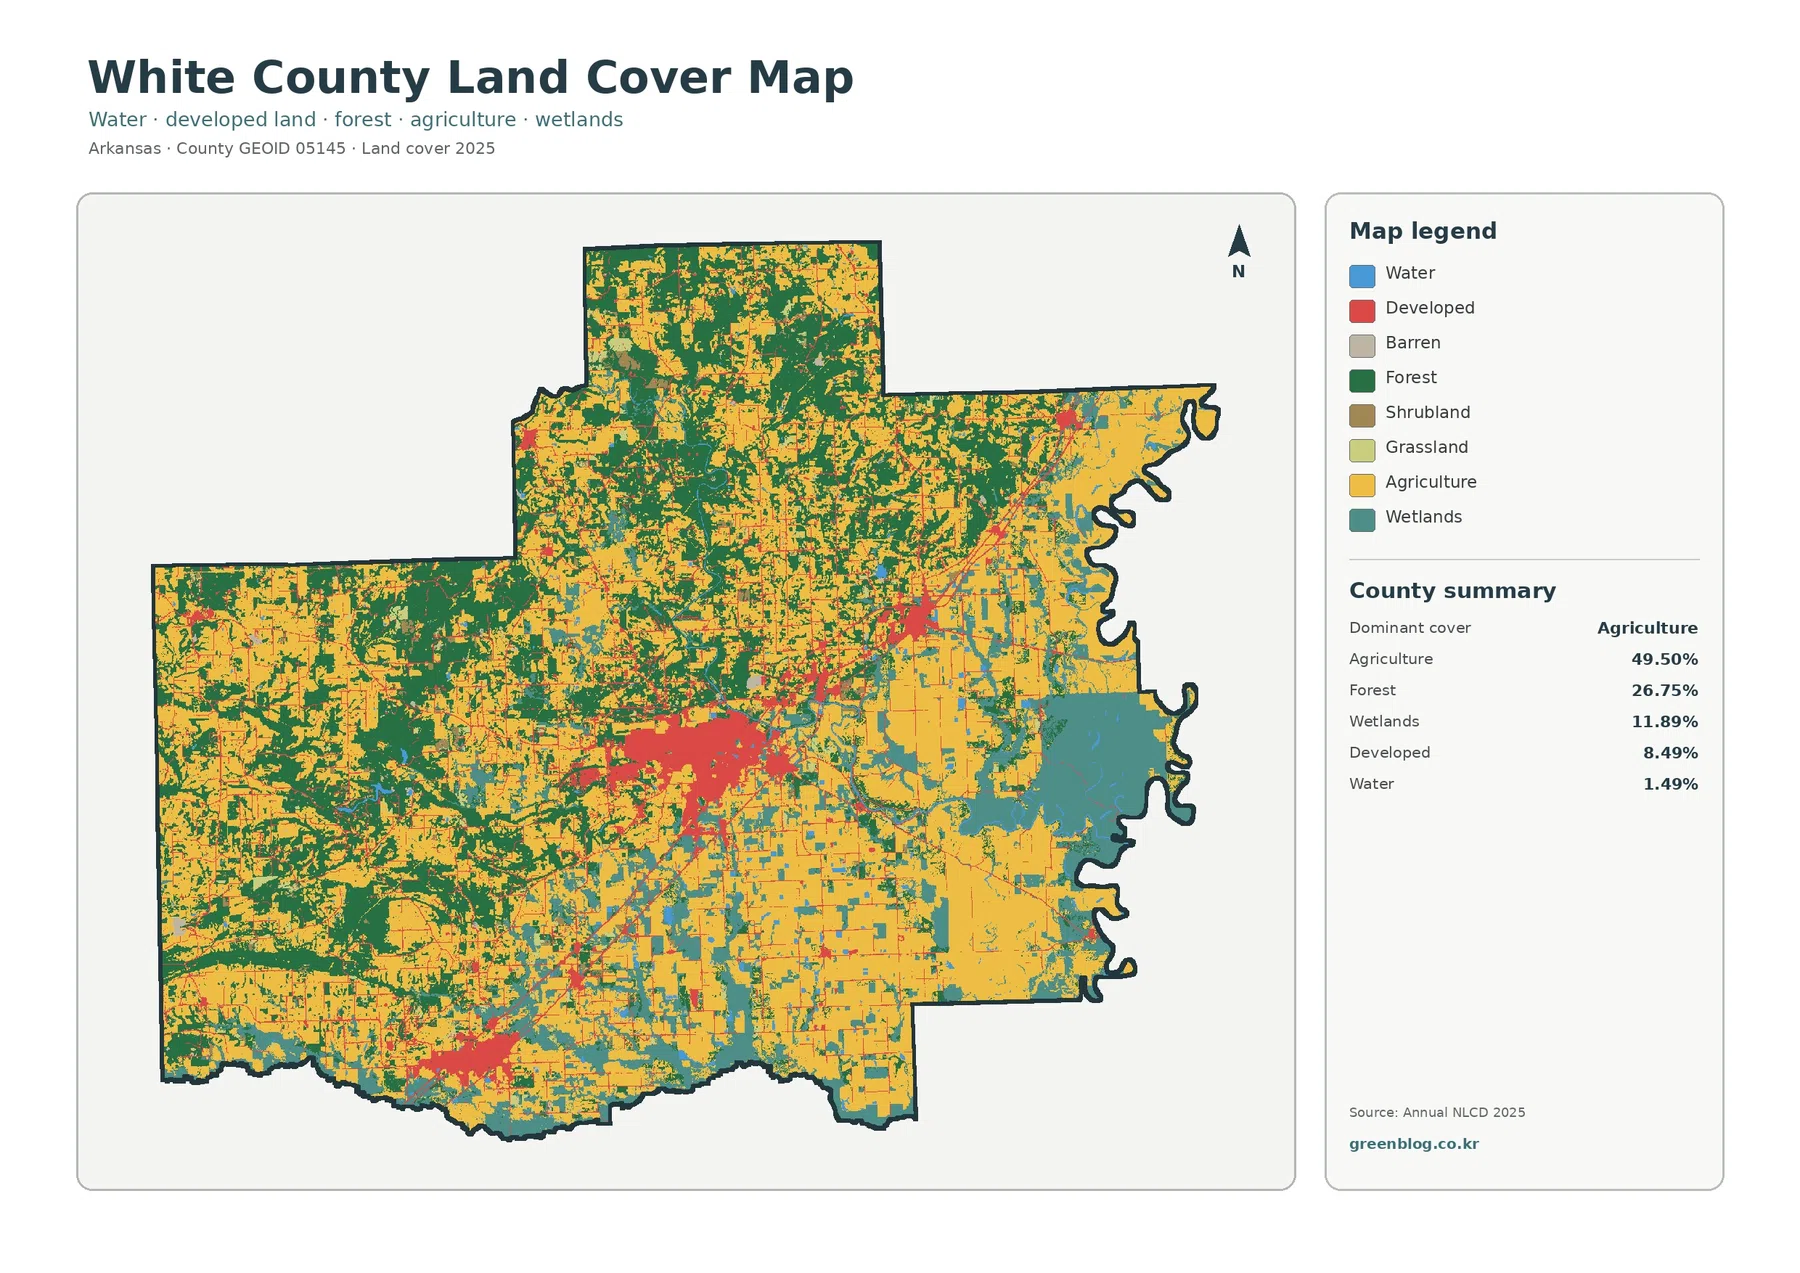
The impervious-surface view changes the visual emphasis completely. Instead of coloring every developed class as one broad category, it highlights surfaces such as pavement, rooftops, and parking areas where water has difficulty soaking into the ground. Searcy becomes the strongest concentration on the map. The dense center fades outward into lighter developed areas and narrow lines that follow the built network beyond the city core.
White County averages 2.21% impervious surface, and only 1.27% of the county is shown with imperviousness of 50% or more. Those figures are much smaller than the 8.49% developed-cover share because a developed land-cover class can include lawns, trees, soil, and other surfaces that still absorb water. The distinction is useful when comparing a suburban or small-city landscape with the truly hard-surfaced portions inside it.
The forest-and-farmland view separates eastern cropland from western open pasture country
Removing much of the visual competition from developed and minor classes makes the agricultural pattern easier to read. The eastern side contains large cropland blocks, while the western side has more forest mixed with pasture and hay. The north also shows a strong forest presence broken by agricultural openings. This is more informative than treating all 49.50% of the agricultural summary as a single kind of farm landscape.
Wetlands become a major part of the story near the White River side of the county
Wetlands cover 11.89% of the 2025 summary, a substantial share that is concentrated mainly in the east and southeast. Arkansas Heritage notes that the White River forms the county’s eastern boundary. The Little Red River crosses the county from northwest to southeast before joining the White River. With that geographic context, the broad teal areas along the eastern lowlands are easier to place within the county’s river setting.
The 1985–2025 comparison spreads change well beyond the urban centers
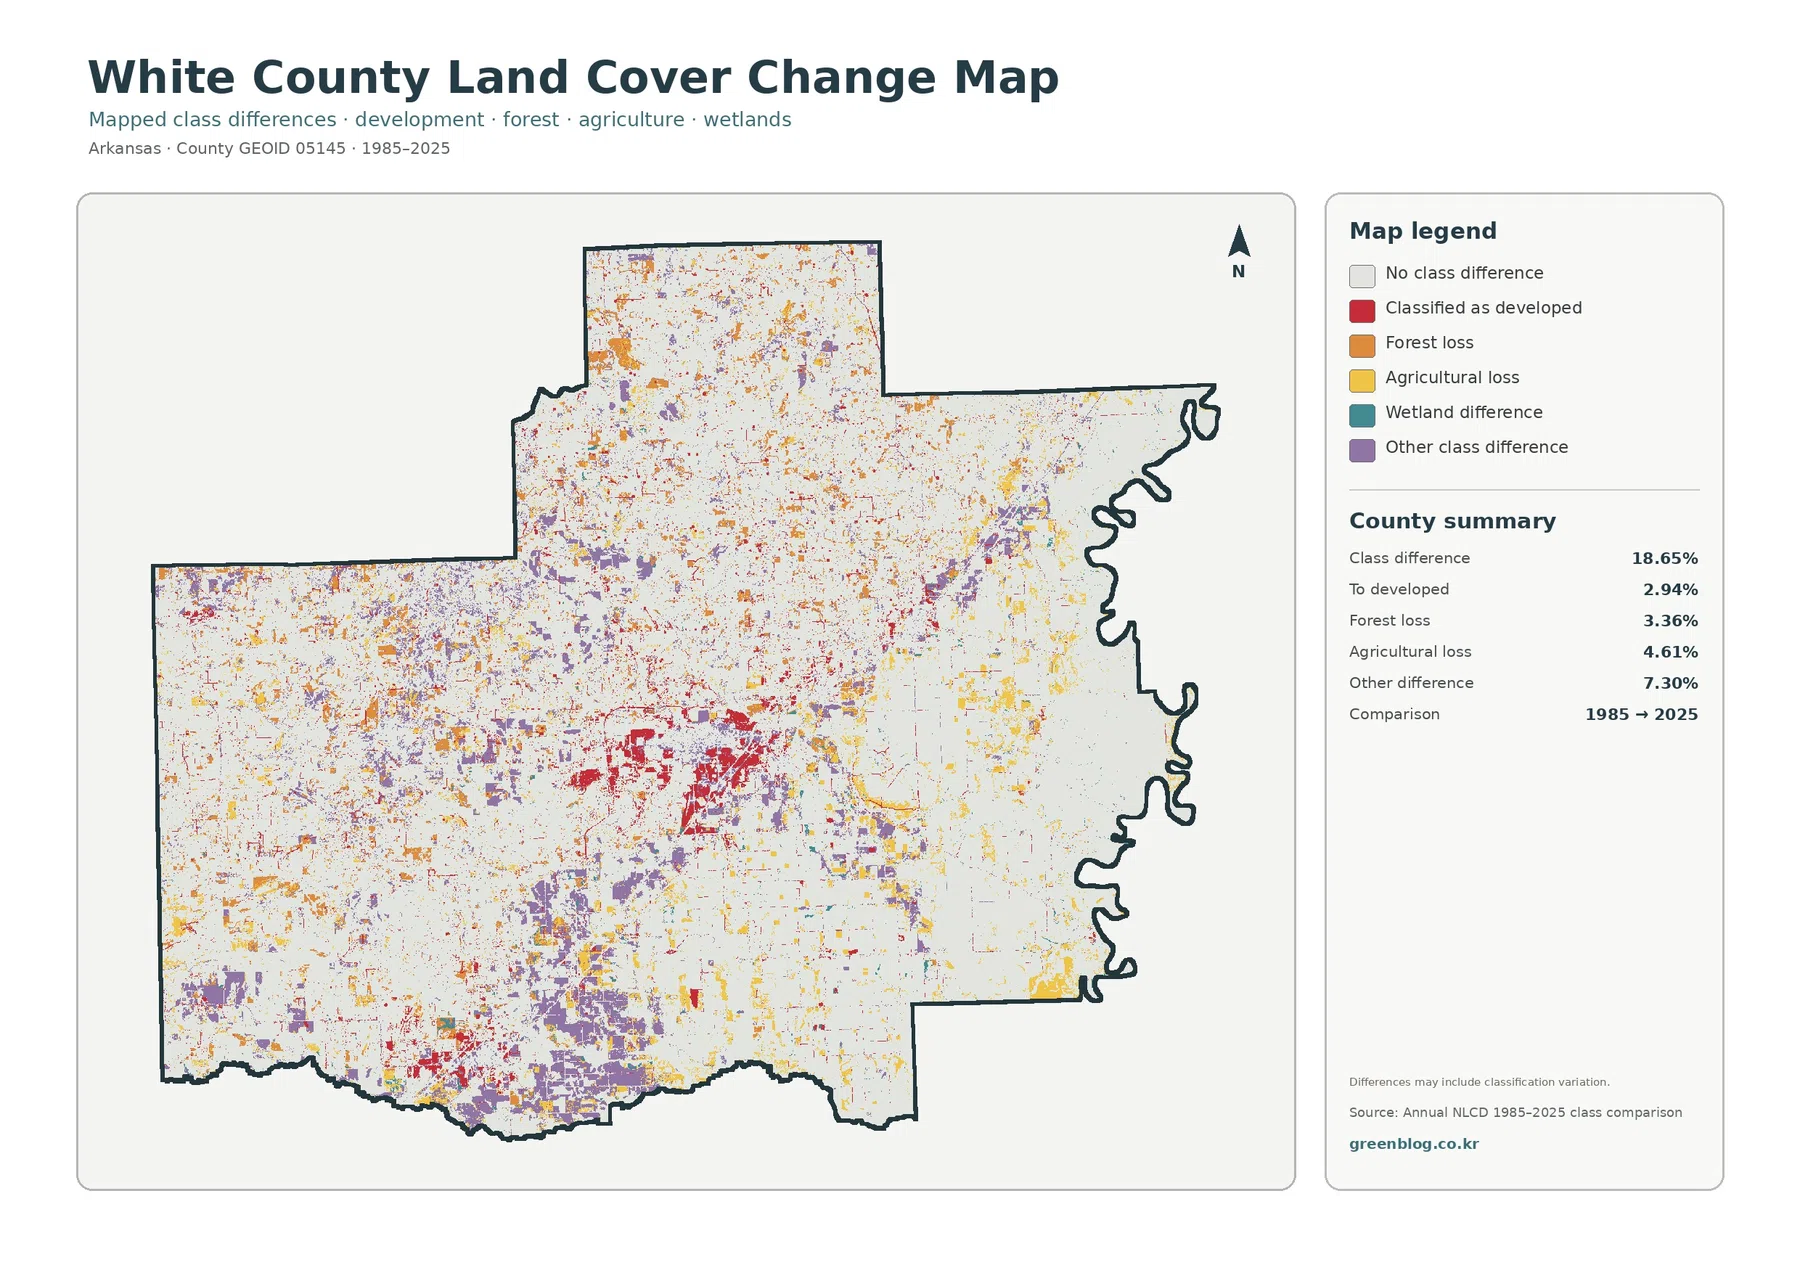
The change map reports a total class difference of 18.65% between 1985 and 2025. Its summary breaks that figure into 7.30% other class difference, 4.61% agricultural loss, 3.36% forest loss, and 2.94% change to developed. These values should not be compared directly with the current 2025 percentages as if they measured the same thing. One map describes present cover; the other marks locations whose classifications differ between two dates.
Change to developed is most conspicuous around Searcy and the southwest urban cluster, with smaller red areas extending along other settled routes. Agricultural-loss and forest-loss colors are more dispersed. The southern and western portions contain many small patches, while the eastern lowlands show scattered differences among agricultural, wetland, and other classes. Looking back at the current map helps identify what those changed locations are classified as today.
A land-cover class describes the surface, not the legal use of a parcel
Land cover answers a basic surface question: is the ground mainly forest, agriculture, developed cover, water, wetland, grass, or another mapped class? It does not show zoning, ownership, tax status, building permission, or a parcel survey. A yellow agricultural cell is not a legal agricultural designation, and a red developed cell does not establish what future development is allowed there.
Use the four maps as a sequence when comparing the same place
A practical comparison starts with the general map. Locate the broad eastern farm-and-wetland zone, the more wooded west, and Searcy’s developed center. Then switch to the forest-and-farmland map to separate cropland from pasture and wooded openings. Because each view uses the same county outline, a location can be carried from one map to the next without relying on a different boundary or scale.
A 30-meter raster is strong for county patterns and weak for small boundaries
Annual NLCD uses raster cells of about 30 meters so land cover can be classified consistently across large areas. A single cell can contain a field edge, trees, a narrow road, grass, and part of a building. The classification assigns one representative category, which means real-world edges can appear simplified or blocky. Mixed pixels are especially important around narrow waterways, suburban edges, and small wetland pockets.
Download the four White County JPG maps for closer comparison
The on-page WebP versions are convenient for browsing, while the download contains four JPG files at the original resolution supplied with this package. Each image is 2480×1754 pixels, so the files should not be described as meeting an A3 high-resolution reference without checking the intended print size. The JPGs are more convenient when small wetland patches, thin impervious lines, or scattered change areas need to be enlarged on screen.
Frequently Asked Questions
Why does eastern White County contain so much agriculture and wetland cover?
The map shows large farm and wetland areas in the east, and Arkansas Heritage describes that part of the county as alluvial lowland along the White River side. The map supports the location of the pattern, while the regional source provides geographic context. It does not by itself prove the cause of every field or wetland patch.
Why is developed cover 8.49% when mean impervious surface is only 2.21%?
Developed land-cover classes can include lawns, trees, soil, and other permeable surfaces around buildings and roads. Impervious data focuses more directly on pavement, rooftops, and similar hard surfaces. That is why the impervious percentage is smaller and more concentrated around places such as Searcy.
Does the 18.65% change figure mean that amount of the county definitely changed on the ground?
No. It is the share with different mapped classes between 1985 and 2025. Real land change can contribute to the difference, but classification variation, mixed pixels, and imagery conditions can also matter. A specific location should be checked with historical imagery or local records before drawing a firm conclusion.
Map File Information
Download the four original JPG maps for White County in one ZIP. The set compares current land cover, forest and farmland, impervious and developed surfaces, and mapped class differences between 1985 and 2025 within the same county boundary.
- File Type: ZIP containing four JPG files
Related Maps
- A Craighead County Arkansas Land Cover Map
- Arkansas County Arkansas Land Cover Map
- Ashley County Arkansas Land Cover Map
Sources and references
The 2025 percentages and 1985–2025 change values used above come from the supplied White County map package. The links below provide official or trusted background for the land-cover classes, county boundary, agriculture, and White County river geography.
- MRLC Annual NLCD Data — official access to Annual NLCD land-cover products and related datasets.
- USGS Annual NLCD Land Cover Classification — definitions and guidance for major mapped land-cover classes.
- University of Arkansas Cooperative Extension – White County — county-specific agriculture, natural-resources, livestock, forage, and horticulture information.
- Arkansas Heritage – Edgar Wright Farmstead — White County geographic background including the White River boundary, Little Red River, and flatter eastern farmland.
- U.S. Census Bureau TIGER/Line Shapefiles — official geographic boundary data used for county mapping.
Green Map creates custom-edited map images using open geographic data sources such as geoBoundaries, Natural Earth, OpenStreetMap, and government open data.
These maps are edited visual materials, not raw data files, and are provided for education, documents, presentations, and graphic reference.