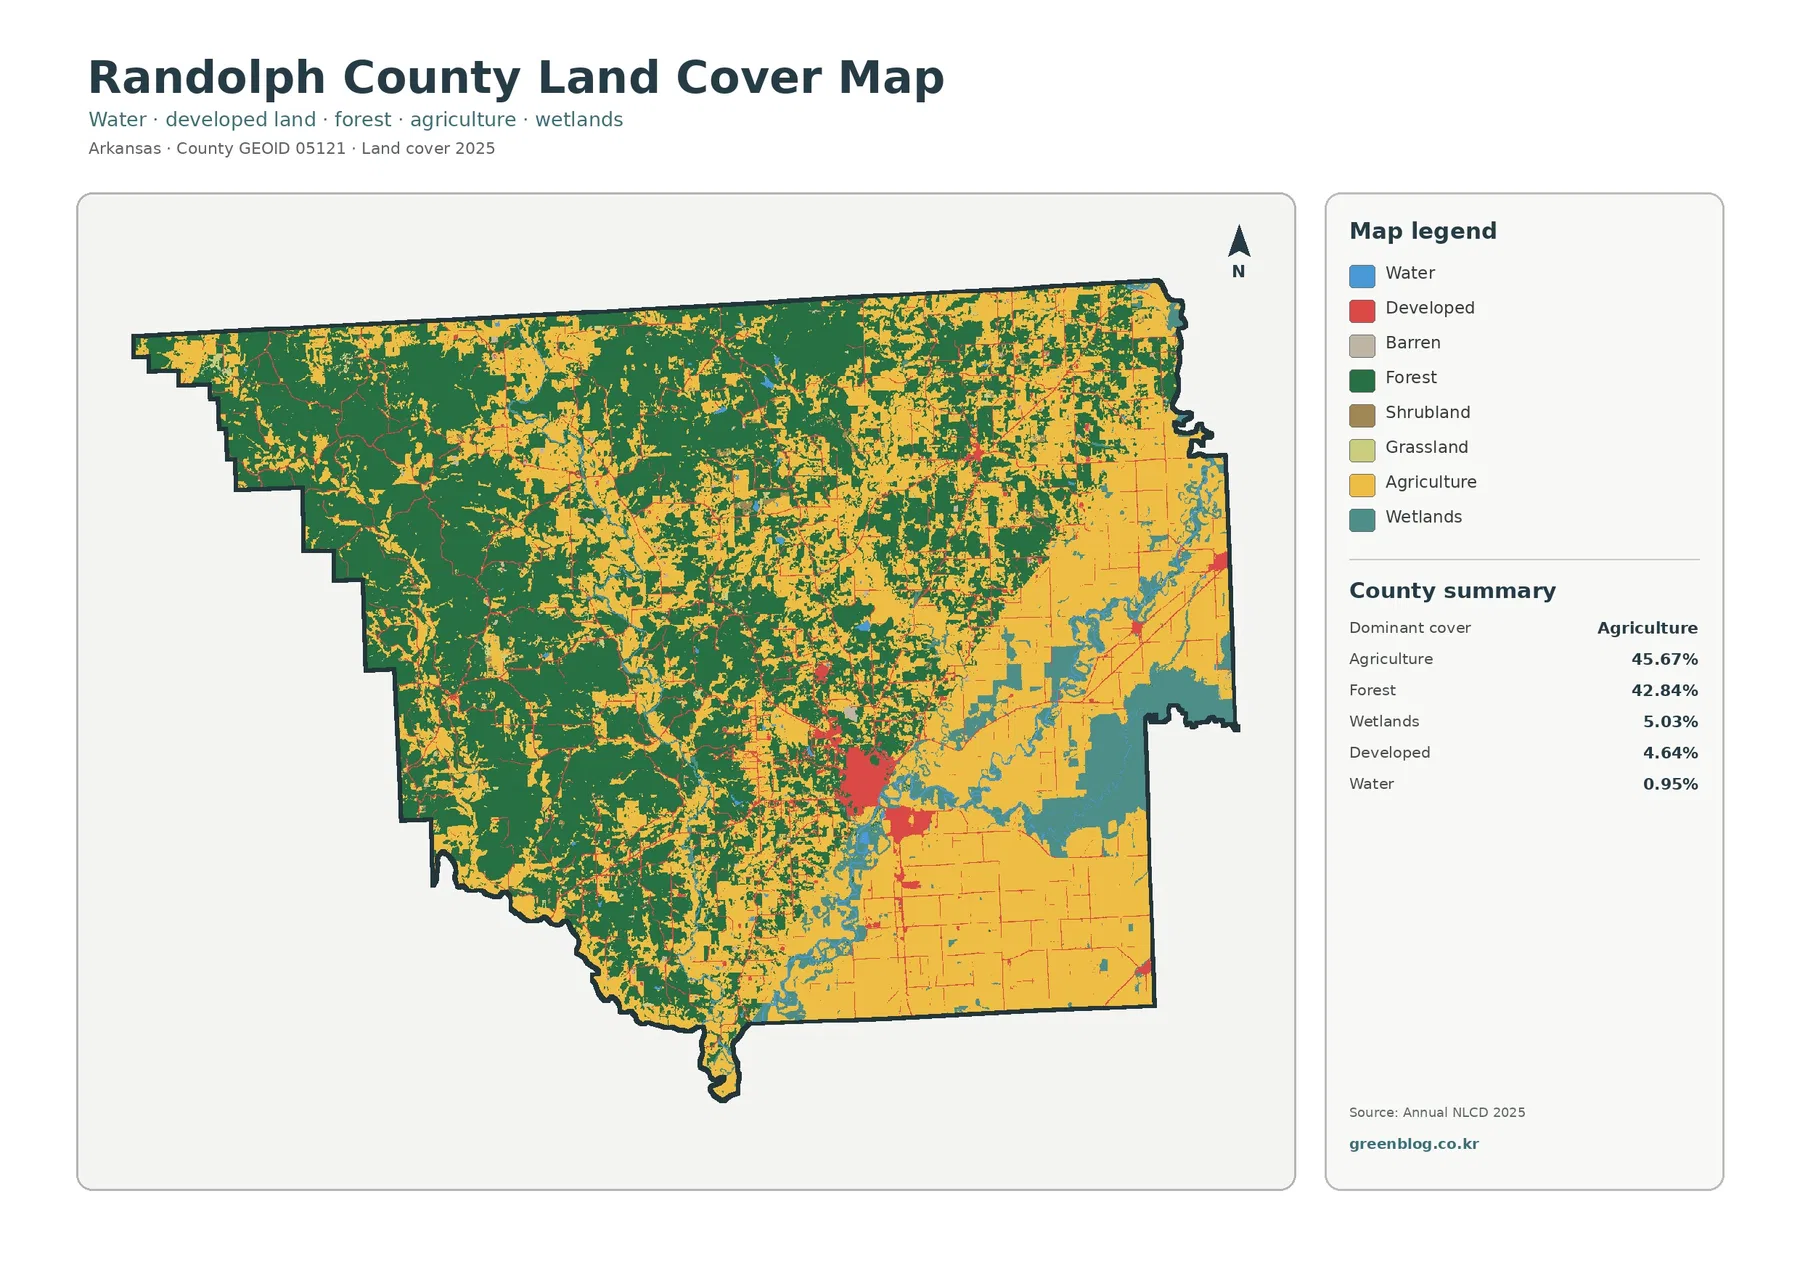
Randolph County has one of the more balanced 2025 land-cover summaries in this Arkansas series: agriculture accounts for 45.67% of the county and forest for 42.84%. The map is not evenly mixed, however. Broad agricultural cover dominates much of the eastern and southeastern side, while forest forms the main cover across the west and northwest. Wetlands thread through the middle and eastern lowlands, and the strongest developed cluster appears around the Pocahontas area. The four maps on this page separate those patterns so the county can be read as more than a single percentage table.
The in-page WebP images are designed for quick comparison. A single download farther down the page contains the four original JPG maps: general land cover, forest and farmland, impervious surface/developed land, and the 1985–2025 land-cover change comparison. Land cover describes what is physically covering the ground, not who owns a parcel or what a zoning code permits. A field, wooded tract, wetland, road, or built area can be mapped from satellite-based classification without saying anything about property rights or legal development status.
Table of Contents
Randolph County is nearly split between agriculture and forest, but the split is geographic
The general 2025 map makes the county’s east-west contrast immediately visible. Large green forest blocks cover much of the western half, especially toward the northwest and southwest. Yellow agricultural cover becomes more extensive toward the east, where it forms broad, connected areas rather than a scatter of small fields. That pattern matters because the countywide totals are close: agriculture leads forest by only 2.83 percentage points. The map shows that the similarity in percentages comes from two large zones occupying different parts of the county, not from every part of Randolph County having the same mix of land cover.
The smaller classes fill in the transition between those two dominant covers. Wetlands make up 5.03%, developed land 4.64%, and water 0.95% of the supplied 2025 summary. Wetland colors appear repeatedly through the central and eastern portions of the county and along river-related corridors, while open water is much narrower. Developed land forms a pronounced concentration in the south-central area and smaller clusters elsewhere. Because these classes occupy less acreage, their placement is more informative than the rank alone: a five-percent wetland class can strongly shape the appearance of one part of the county even though it is far smaller than agriculture or forest.
Pocahontas provides the clearest urban reference point without turning the county into an urban landscape
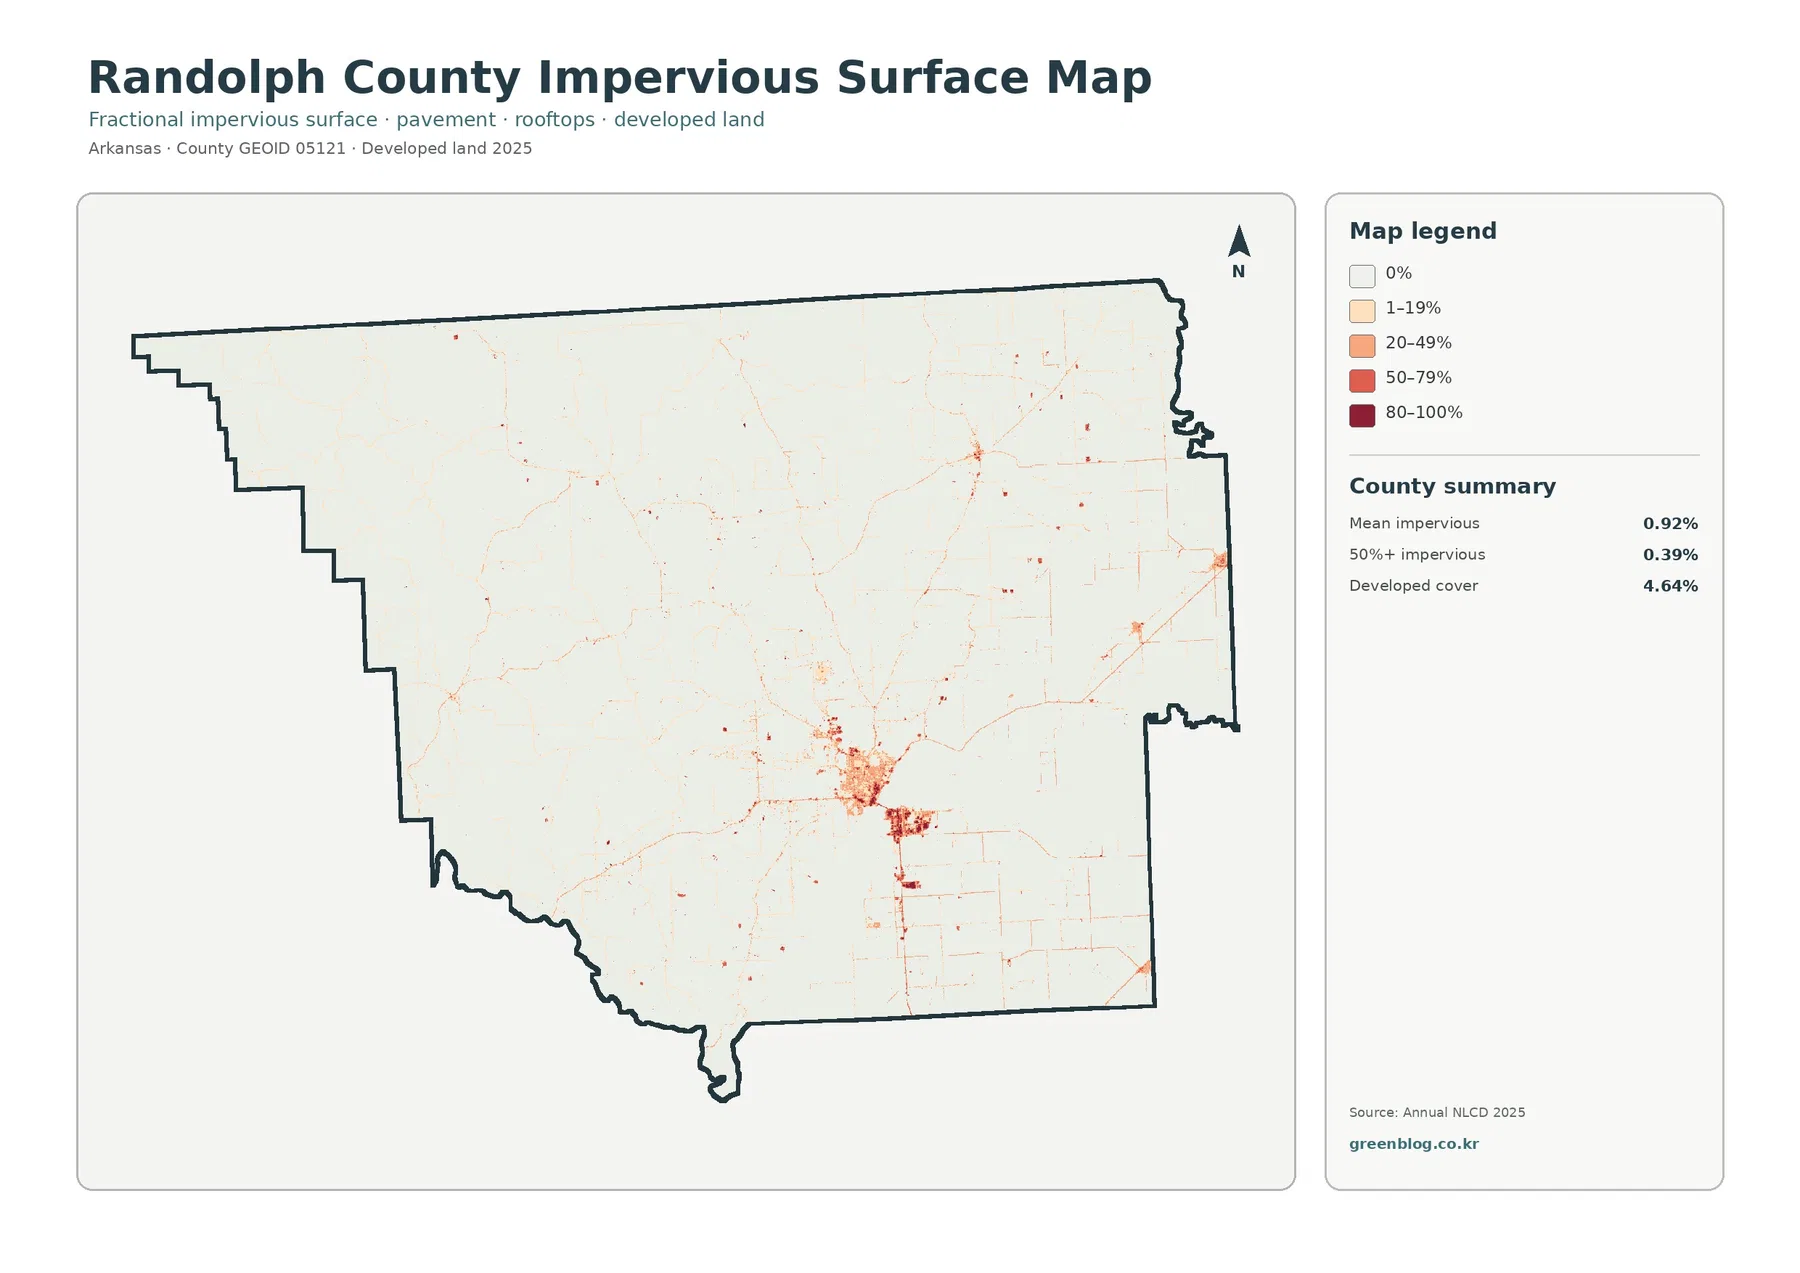
Pocahontas is the county seat, and state and local sources place the city on the Black River. That gives a useful reference for the most visible developed concentration on the maps. The red developed area and the stronger impervious values are centered in the Pocahontas vicinity, with thinner lines and smaller nodes extending away from it. Outside that core, most of the county does not have a continuous urban footprint. The surrounding landscape returns quickly to forest, agricultural cover, wetlands, and water, which is consistent with the low countywide impervious values.
This distinction is easier to see on the impervious-surface map than on the general land-cover map. Impervious surface means pavement, rooftops, parking areas, and other hard surfaces that allow little water to soak into the ground. Randolph County’s mean impervious value is 0.92%, and only 0.39% of the county is mapped at 50% or greater imperviousness. Those figures are much smaller than the 4.64% developed-land share because a developed class can still contain lawns, trees, bare ground, or other permeable surfaces. The two measurements describe related but different aspects of the built environment.
The darkest impervious colors occur around the main south-central developed cluster, while most forest and farm areas remain white or very lightly shaded. Smaller concentrations appear at other settlement points and along transportation lines, but they do not merge into a broad urban field. For presentation or planning context, this map is useful when the question is not simply “where is developed land?” but “where are hard surfaces most concentrated within developed places?” It should not be treated as a stormwater or flood-risk map, because drainage, elevation, rainfall, soils, and river levels require separate datasets.
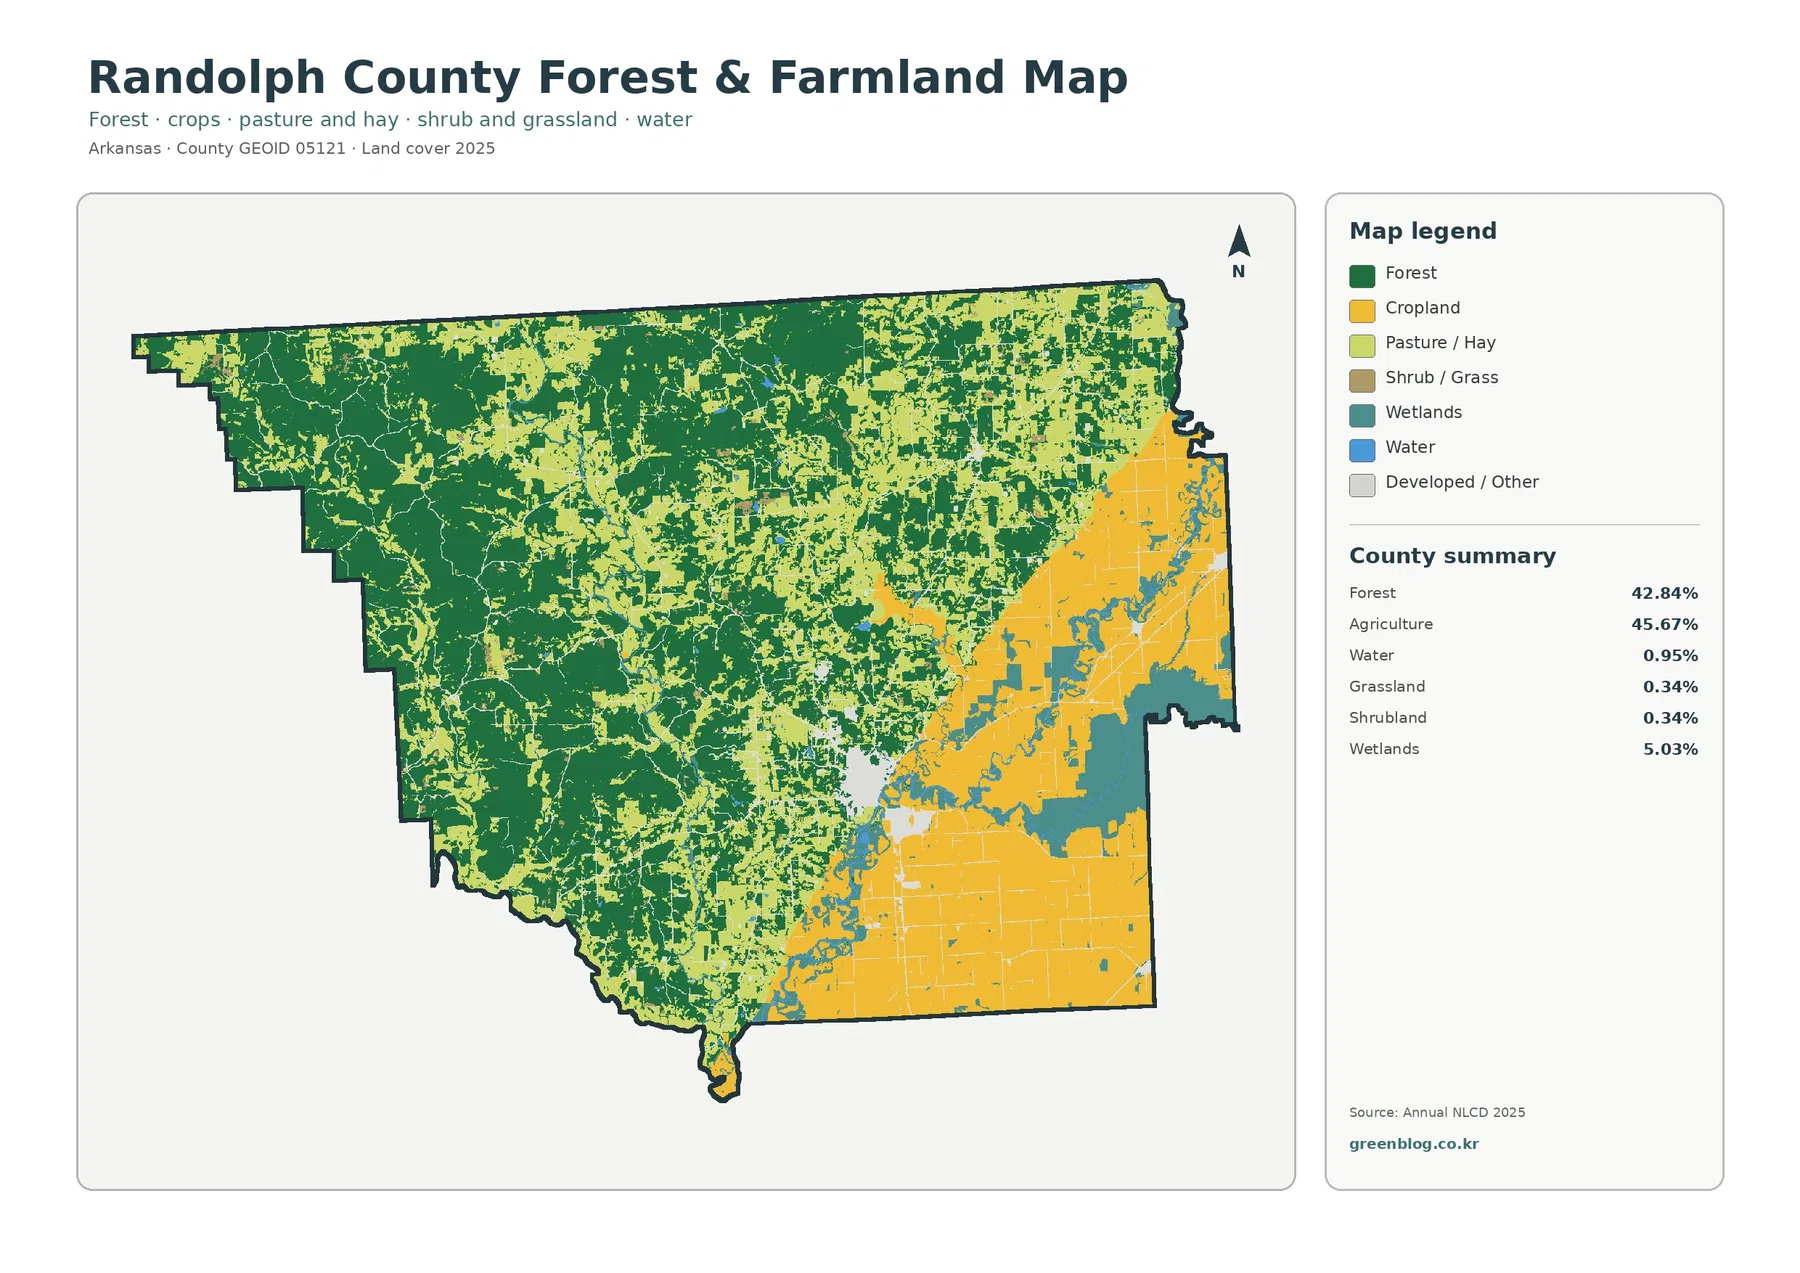
The forest-and-farmland view clarifies where the two dominant covers meet
Removing much of the visual competition from the developed classes makes the western forest and eastern farmland easier to compare. Forest remains the main color from the western boundary toward the center, although it is broken by lighter pasture/hay, agricultural, and open-cover patches. East of that transition, cropland becomes more continuous and wetlands interrupt the agricultural blocks along lower, wetter terrain. The map is especially useful for seeing that the county does not change from forest to agriculture at a single straight line; instead, there is a broad transition zone with mixed cover before agriculture becomes dominant farther east.
The supplied forest-and-farmland summary reports grassland at 0.34% and shrubland at 0.34%. Those are small shares, but they help explain some of the lighter patches inside the forested west and along farm-forest edges. Wetlands remain 5.03% and water 0.95%, so the map also keeps the water-related classes visible instead of forcing everything into “forest” or “farm.” That matters in Randolph County because wetland cover is not confined to one tiny corner. It reappears across the center and east, creating a third landscape element that separates and borders some of the larger farm blocks.
University of Arkansas Cooperative Extension material for Randolph County lists row-crop programs that include rice, soybeans, corn, grain sorghum, wheat, and specialty crops, along with livestock and forage production. That local agricultural context fits the map’s broad agricultural footprint, but the land-cover image does not identify individual crop species. A yellow agricultural cell should therefore be read as agricultural cover, not automatically as rice or soybeans. Crop type, acreage, and production require agricultural statistics or field-specific data rather than the general land-cover legend.
Rivers and wetlands add structure to the agricultural side of the county
Water covers less than one percent of the county summary, yet river corridors are an important part of the landscape. Black River passes Pocahontas, and Randolph County is also associated with the Current, Eleven Point, and other rivers in regional sources. The map does not label every channel, so the safest approach is to use those verified names as regional context while reading the blue and teal classes as water and wetlands. The wetland share of 5.03% is large enough to appear repeatedly through the agricultural side of the county rather than as a single isolated patch.
Water and wetlands should not be merged into one number when comparing maps. Open water represents visible water bodies, while wetland classes describe land cover associated with persistently or seasonally wet conditions and characteristic vegetation. A narrow blue channel and a broad teal wetland can sit next to the same farm area but represent different surface conditions. For watershed study or environmental education, keeping those categories separate makes it easier to understand why the eastern agricultural landscape is not simply a continuous dry plain.
These classes also show why a county-scale land-cover map has limits. A 30-meter raster cell can contain a stream bank, trees, crop cover, and a road at the same time. The classification simplifies that mixture, and narrow channels or small wet areas can be underrepresented or blended into neighboring classes. The maps are therefore strong for regional patterns and side-by-side comparison, but not for delineating a regulated wetland, parcel boundary, or exact river edge. Site-level work needs more detailed imagery, surveys, and the appropriate agency records.
The 1985–2025 comparison is dominated by scattered class differences rather than one sweeping conversion
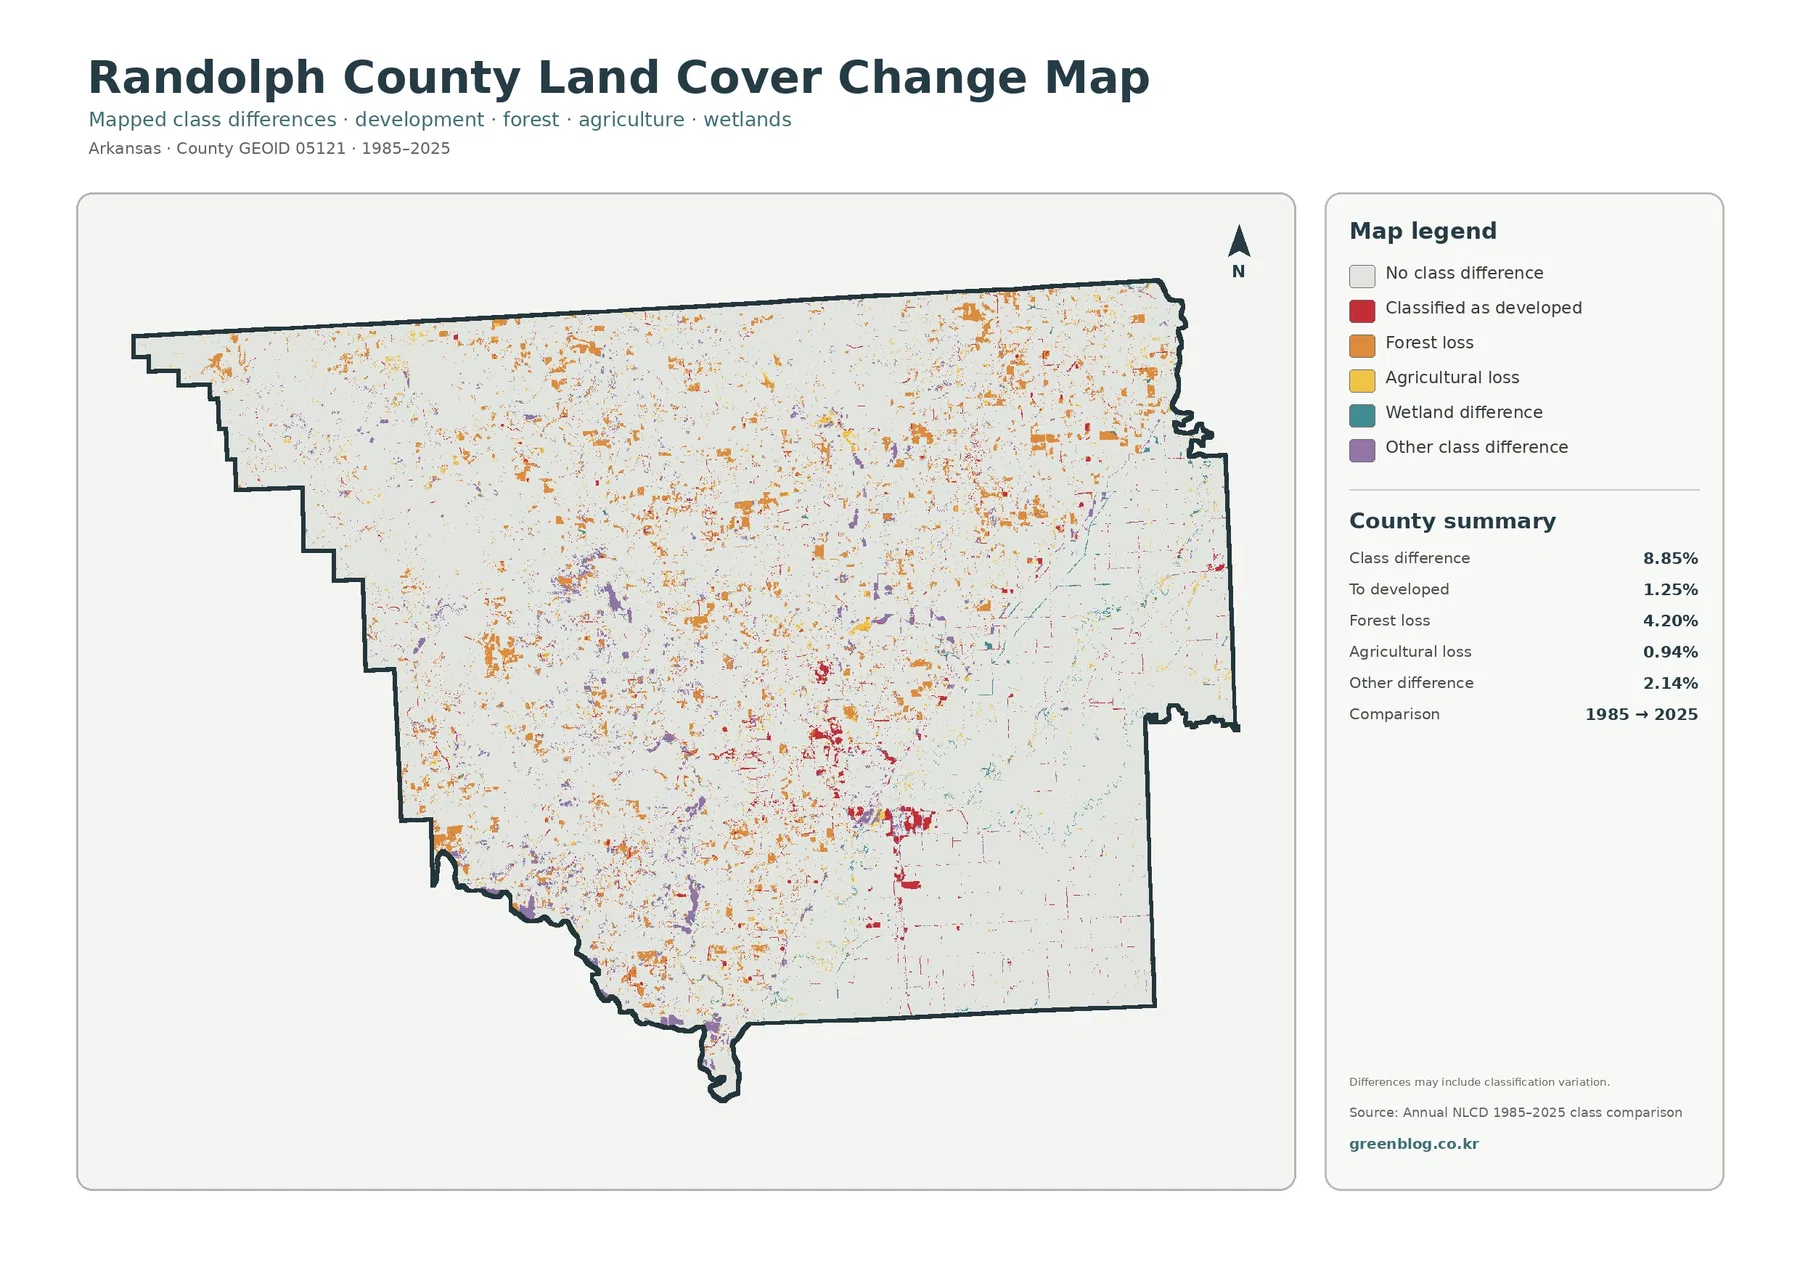
The change map compares broad land-cover classifications from 1985 and 2025. Its county summary reports a class difference across 8.85% of Randolph County. Within that comparison, 4.20% is marked as forest loss, 1.25% as classified to developed, 0.94% as agricultural loss, and 2.14% as other class difference. Most of the county is shown as having no class difference between the two comparison years. The colored changes appear as many small patches and lines rather than one countywide block of change.
Forest-loss colors are scattered through the western and northern forested areas, while red “classified as developed” cells are easier to notice around the main developed center and selected corridors. Agricultural-loss and other-difference colors are more dispersed. This does not mean that every orange patch documents a permanent clearing or every red cell proves new construction. The map is a classification comparison, and the source note specifically warns that classification variation may be included. Mixed pixels, seasonal conditions, imagery differences, and classification methods can all contribute to differences between years.
A useful way to read the change map is to start with the current 2025 map. Locate a colored change patch, then check what cover occupies the same general area today. If a red change cluster aligns with a developed area and elevated impervious values, the three maps provide consistent context for a built-surface interpretation. If a forest-loss patch falls in a mixed farm-forest transition zone, the current forest-and-farmland view helps show what replaced or now surrounds that cell. This cross-check reduces the temptation to assign a cause from the change color alone.
Which Randolph County map should you use?
Use the general land-cover map when you need one image that explains the county’s overall east-west pattern and the relationship among agriculture, forest, wetlands, water, and developed land. Choose the forest-and-farmland version when the main question is where woodland gives way to agricultural cover or where wetlands interrupt those two dominant classes. The impervious map is the better choice for Pocahontas and other built areas because it distinguishes lightly developed ground from surfaces with a high proportion of pavement or rooftops. Save the change map for questions about how the 1985 and 2025 classifications differ.
For county comparisons, pair percentages with the visible distribution. Randolph County’s 45.67% agriculture and 42.84% forest might be summarized as “nearly balanced,” but that phrase misses the geographic split that makes the county distinctive. Likewise, 4.64% developed land sounds minor until the concentration around Pocahontas is visible, and 5.03% wetlands become more meaningful when their repeated position through the central and eastern landscape can be seen. The map set works best when the numeric summary and the spatial pattern are read together rather than treated as separate pieces of information.
Scale, observation year, and classification limits
Annual NLCD products are generalized raster datasets, commonly organized in 30-meter cells. That resolution is appropriate for county and regional patterns, but it cannot reproduce every fence line, narrow stream, small structure, field edge, or parcel boundary. A cell at the edge of a forest or town may contain several surfaces at once and still receive one dominant land-cover class. The same limitation applies to change mapping: a difference between two classified cells is not automatically proof of a legal land-use conversion or a surveyed change on the ground.
The current maps in this package represent the supplied 2025 classification, while the change map compares 1985 with 2025. Construction, timber activity, cropping changes, or other surface changes after 2025 may not be present. When the task depends on an exact county line, Census TIGER/Line boundaries are a more appropriate reference. When it depends on a parcel, zoning decision, wetland determination, floodplain, or permit, use current local and agency records. These land-cover maps are best treated as a clear visual summary of broad surface patterns.
Frequently Asked Questions
What is the dominant land cover in Randolph County, Arkansas?
Agriculture is the largest 2025 class at 45.67%, with forest close behind at 42.84%. The map shows a strong geographic split: agriculture dominates much of the east and southeast, while forest covers most of the west and northwest.
Why does developed land cover 4.64% while mean impervious surface is only 0.92%?
Developed land can include lawns, trees, and other permeable surfaces around homes, roads, and facilities. Impervious surface measures hard cover such as pavement and rooftops, so its countywide average can be much lower than the broader developed-land class.
Does the 8.85% change value mean that 8.85% of Randolph County definitely changed land use?
No. It is the share of cells with a different broad land-cover classification in the 1985–2025 comparison. Real landscape change may be involved, but classification variation and mixed pixels can also contribute, so parcel-level conclusions require other records.
Sources and reference material
- MRLC Annual NLCD Data – land-cover and annual dataset reference
- USGS Annual NLCD Land Cover Classification – class definitions and interpretation
- U.S. Census Bureau TIGER/Line Shapefiles – county boundary reference
- University of Arkansas Cooperative Extension – Randolph County – local agriculture and community education context
- Randolph County Extension Programs – local row-crop, forage, and livestock program information
Map File Information
The four original Randolph County maps shown on this page are packaged in one ZIP file. The JPG files are larger than the in-page previews and work well for printing, classroom reference, presentation graphics, and side-by-side county comparison.
- Included Files: Use only the versions confirmed in the article and supplied images
- File Type: Use the confirmed download contents
- Intended Use: Printing, education, presentations, and map-based projects
Related Maps
- A Craighead County Arkansas Land Cover Map
- Arkansas County Arkansas Land Cover Map
- Ashley County Arkansas Land Cover Map
Green Map creates custom-edited map images using open geographic data sources such as geoBoundaries, Natural Earth, OpenStreetMap, and government open data.
These maps are edited visual materials, not raw data files, and are provided for education, documents, presentations, and graphic reference.