Polk County in western Arkansas is a forest-dominated county, but the 2025 map is not one continuous field of green. Forest covers 71.46% of the mapped area, while agriculture accounts for 16.33%, developed land 5.30%, shrubland 4.31%, and grassland 1.99%. The broadest forest blocks occupy much of the central and eastern county, whereas farmland and other open cover become more noticeable toward the west, southwest, and around Mena.
The page includes four views of the same county: current land cover, forest and farmland, impervious surface and developed land, and mapped class differences from 1985 to 2025. The original JPG versions of all four maps are available together in one ZIP below. Reading the maps as a set makes it easier to separate the county’s dominant mountain forest from the smaller settlement, road, and agricultural patterns that would otherwise be easy to miss.
Table of Contents
A heavily forested county still has a clear west-side pattern of farms, roads, and settlements
The most useful way to read Polk County is to begin with contrast rather than with the countywide percentage alone. The central and eastern portions form a large, relatively continuous forest block. Moving west, the map becomes more mixed: agricultural patches, shrub and grass cover, roads, and developed areas break up the green. The southwest extension of the county also contains many small open patches rather than the nearly unbroken forest seen farther east. That east-to-west change gives the map much of its local character.
This pattern fits the county’s location in the Ouachita Mountains. A U.S. Forest Service research site within Polk County, Roaring Branch Research Natural Area, lies in Ouachita National Forest and includes shortleaf pine, oak-hickory forest, steep slopes, valleys, and perennial springs. A single research natural area cannot be used to label every green cell on the county map, but it provides a concrete example of the forested mountain environment represented across much of the eastern and central landscape.
Mena provides the clearest counterpoint to that forest background. It is the county seat, and the developed maps show the strongest compact cluster of built surface around it. Smaller traces of development extend along roads through the western half and the long southwestern section. Instead of a broad metropolitan footprint, Polk County has one readily visible center and a collection of much smaller linear and point-like developed areas surrounded by forest or open land.
The 2025 land-cover view puts the 71.46% forest share in geographic context
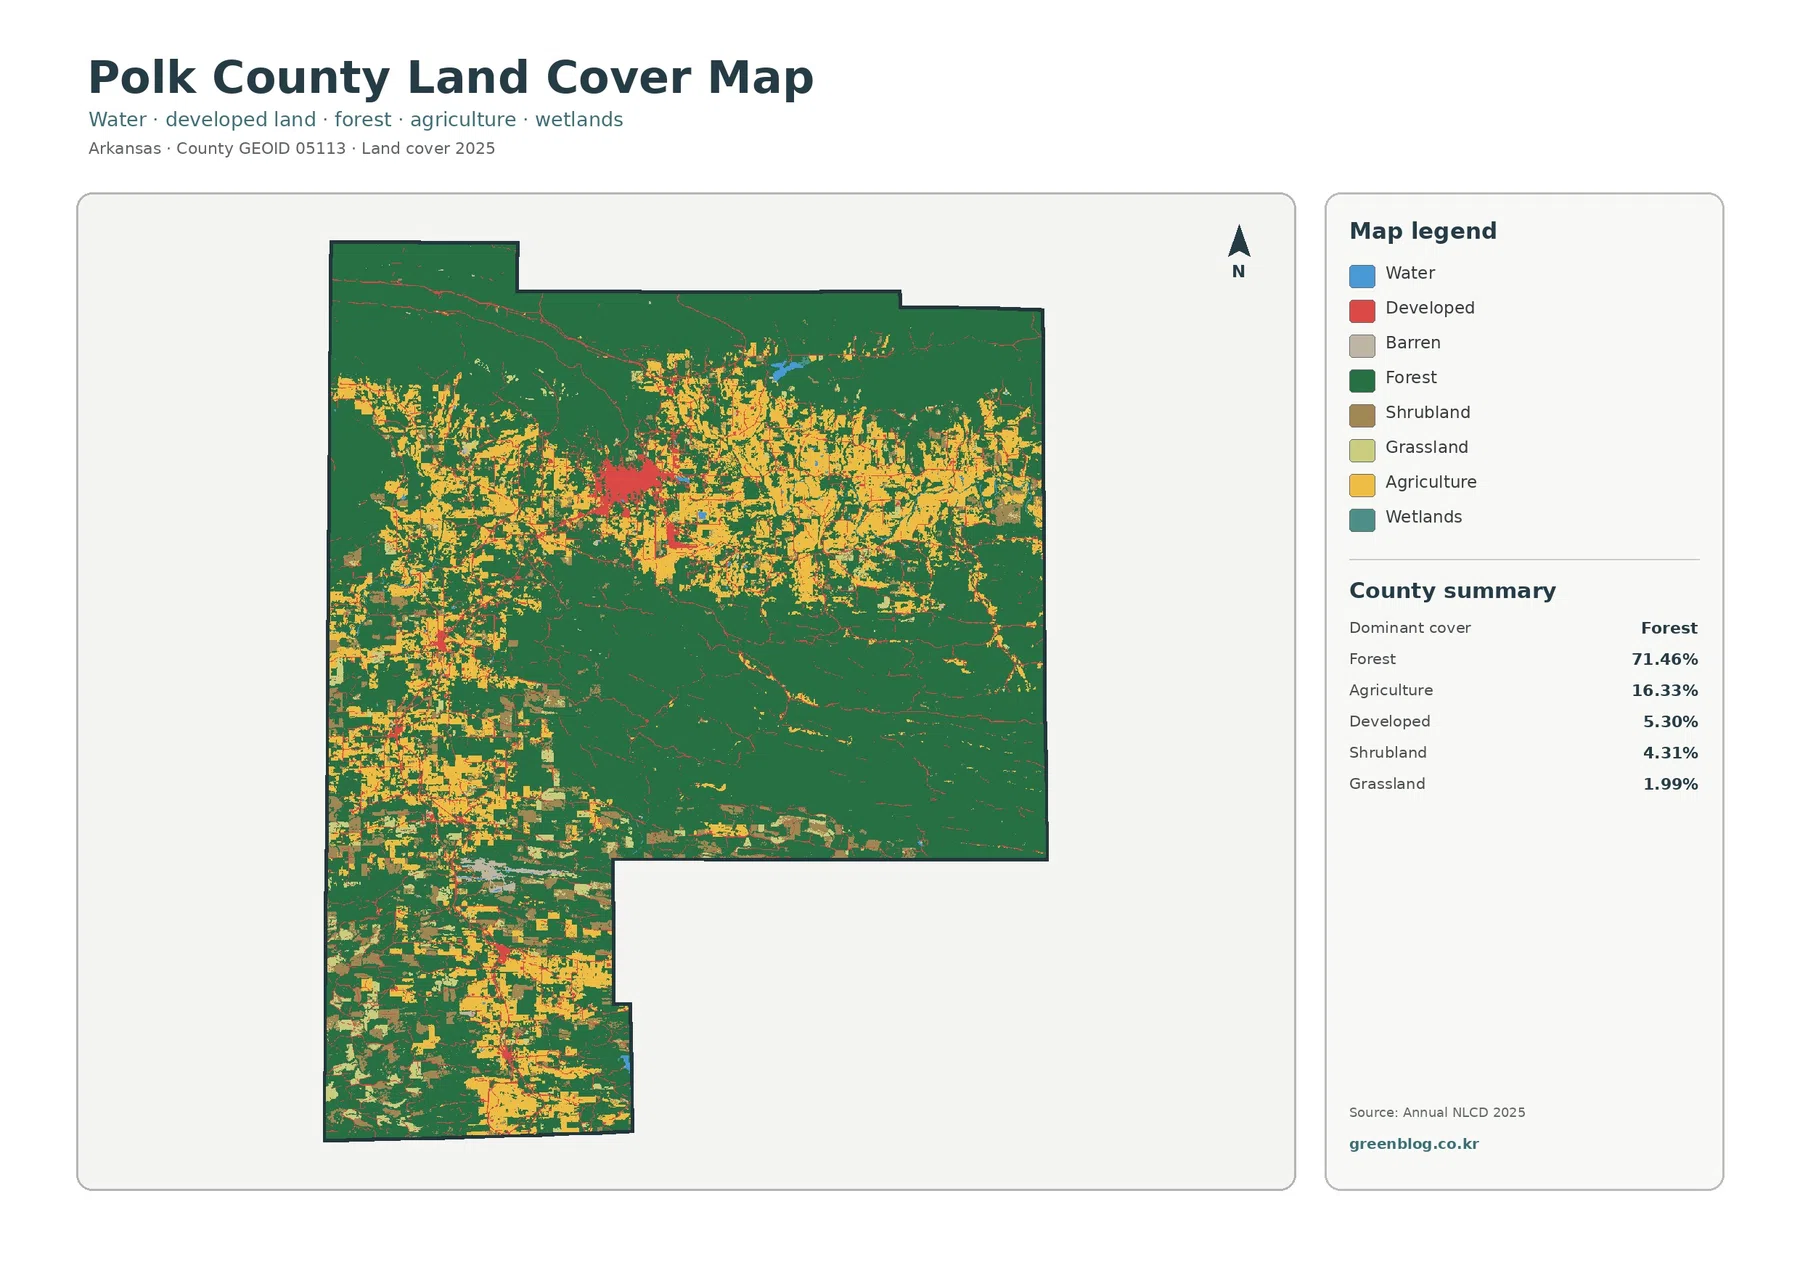
The general land-cover map is the best starting point because it keeps the major classes in one frame. Forest is clearly dominant at 71.46%, but agriculture is substantial enough at 16.33% to form recognizable blocks rather than isolated fields. Developed land totals 5.30%. Shrubland at 4.31% and grassland at 1.99% add another layer of open cover, especially where the forest becomes more fragmented in the west and southwest. These smaller classes help explain why the county does not look uniformly wooded even with a forest share above seventy percent.
Water and wetlands are minor parts of the countywide total. The forest-and-farmland summary reports water at 0.29% and wetlands at 0.06%. Small blue and wetland-colored cells can still matter locally, particularly in narrow valleys and drainage areas, but they do not form the large wetland belts seen in Arkansas Delta counties. For Polk County, water is better read as a fine-scale feature inside a mountain-and-forest landscape rather than as the defining countywide cover type.
Land cover should not be confused with legal land use. A forest-colored cell does not identify ownership, timber rights, or a national-forest boundary, and an agricultural cell does not mark a farm parcel. Annual NLCD classifies what is covering the ground at the scale of its raster cells. The map is therefore useful for comparing broad surface patterns, but it is not a zoning map, property map, or survey.
Removing most developed detail reveals how open land interrupts the forest around Mena and the southwest
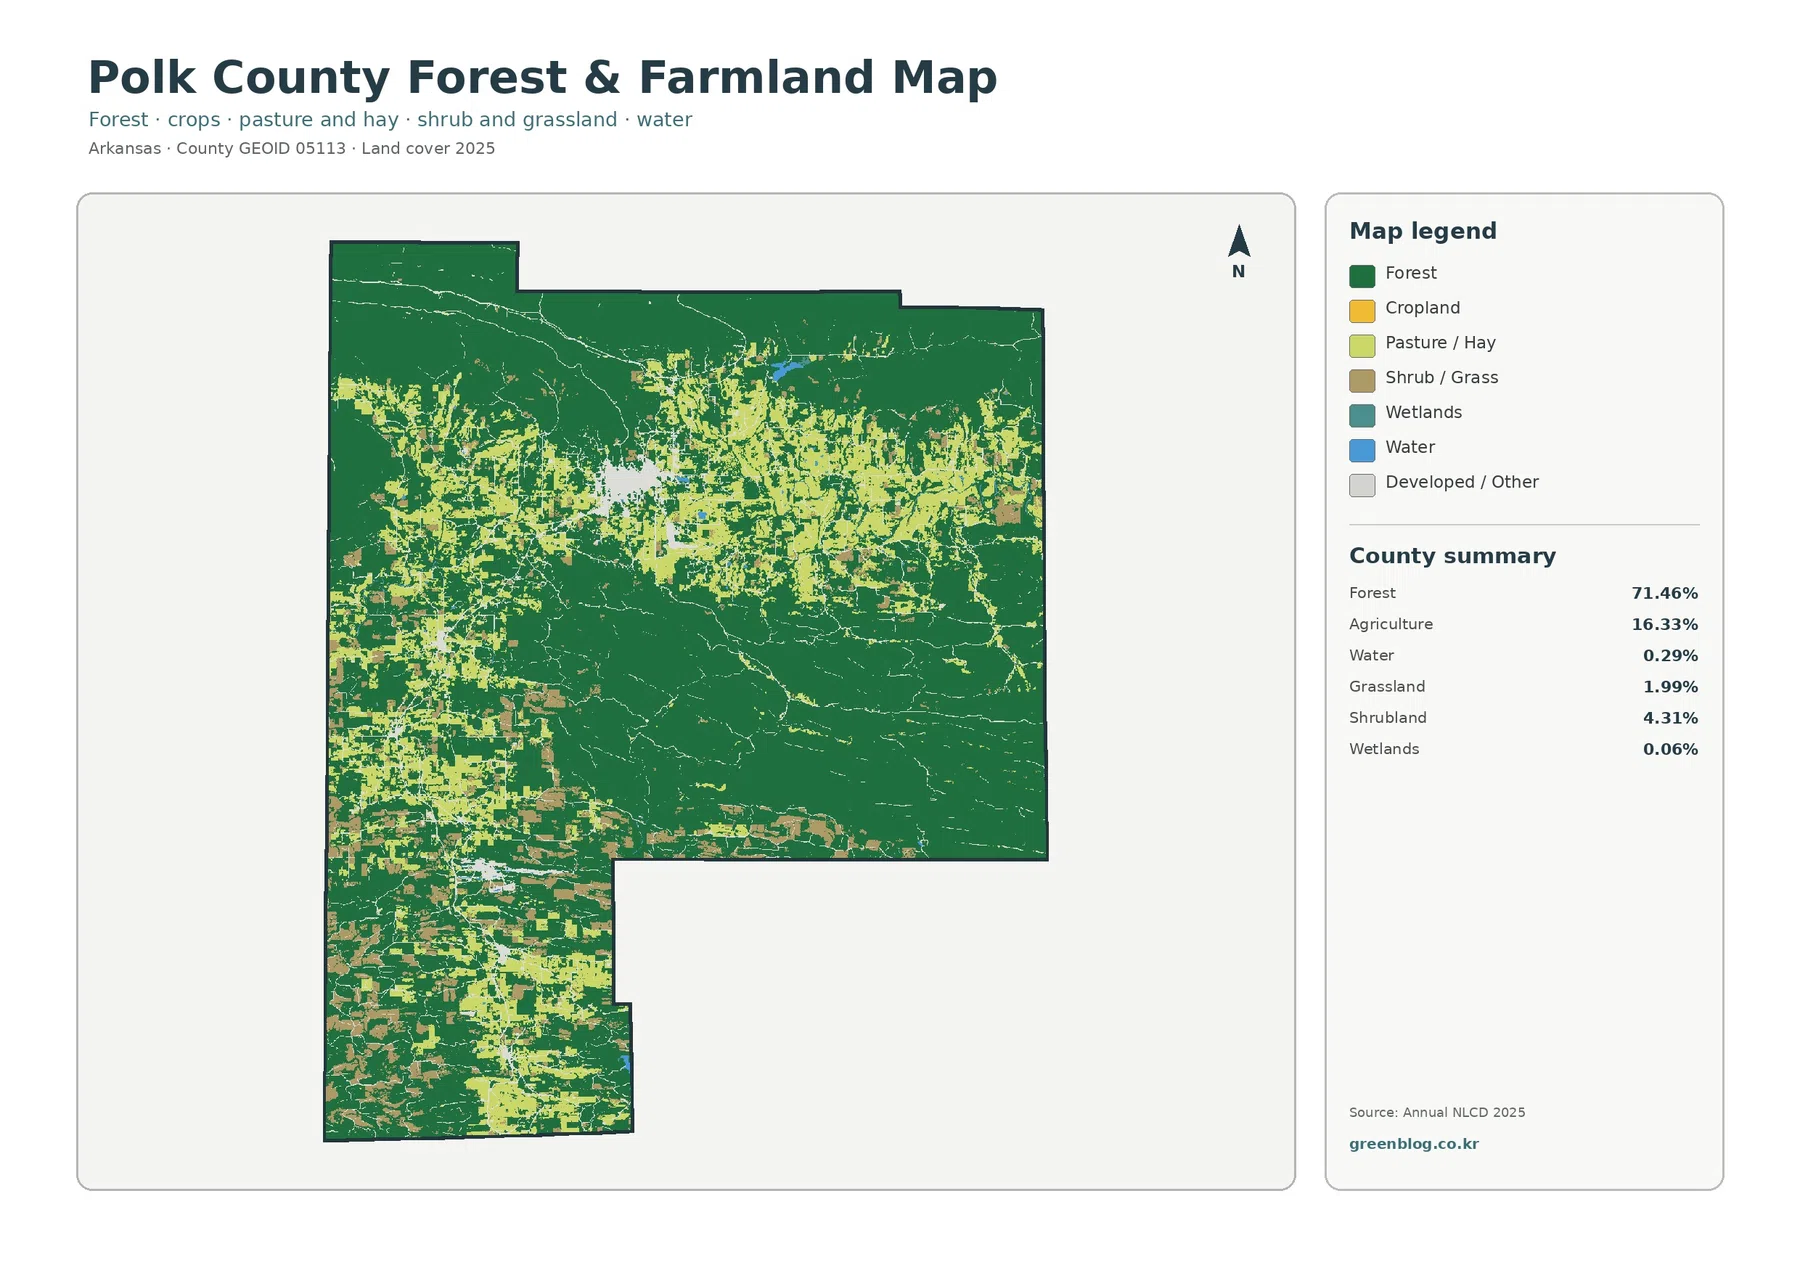
The forest-and-farmland view simplifies the palette and makes the transition between closed forest and open cover easier to follow. Agriculture remains 16.33%, but the shape of that land matters as much as the percentage. In the western half, agricultural cells form many blocks and irregular strips that are interspersed with forest. South of the main Mena area, open cover continues through the narrow southwestern section instead of disappearing at a single boundary. The result is a patchwork rather than a large continuous farm plain.
Shrubland and grassland also deserve attention because they prevent a misleading forest-versus-farm reading. Together they account for more than six percent of the mapped area, and they appear in many of the places where the green forest breaks into smaller pieces. Some of these open cells sit between agricultural blocks and forest edges. The map does not identify why a particular patch is grass or shrub cover, so it should not be labeled as pasture, recently cleared forest, or another specific land use unless a separate source supports that interpretation.
The county’s large forest total does not mean that every green area belongs to Ouachita National Forest. Ownership and cover are different datasets. The Forest Service’s Roaring Branch page is useful because it confirms a federal forest research area in Polk County and describes shortleaf pine and hardwood forest in rugged Ouachita terrain. It supports the regional forest context without turning the land-cover classification into an ownership map.
Mena stands out on the impervious-surface map even though the countywide average is only 0.95%
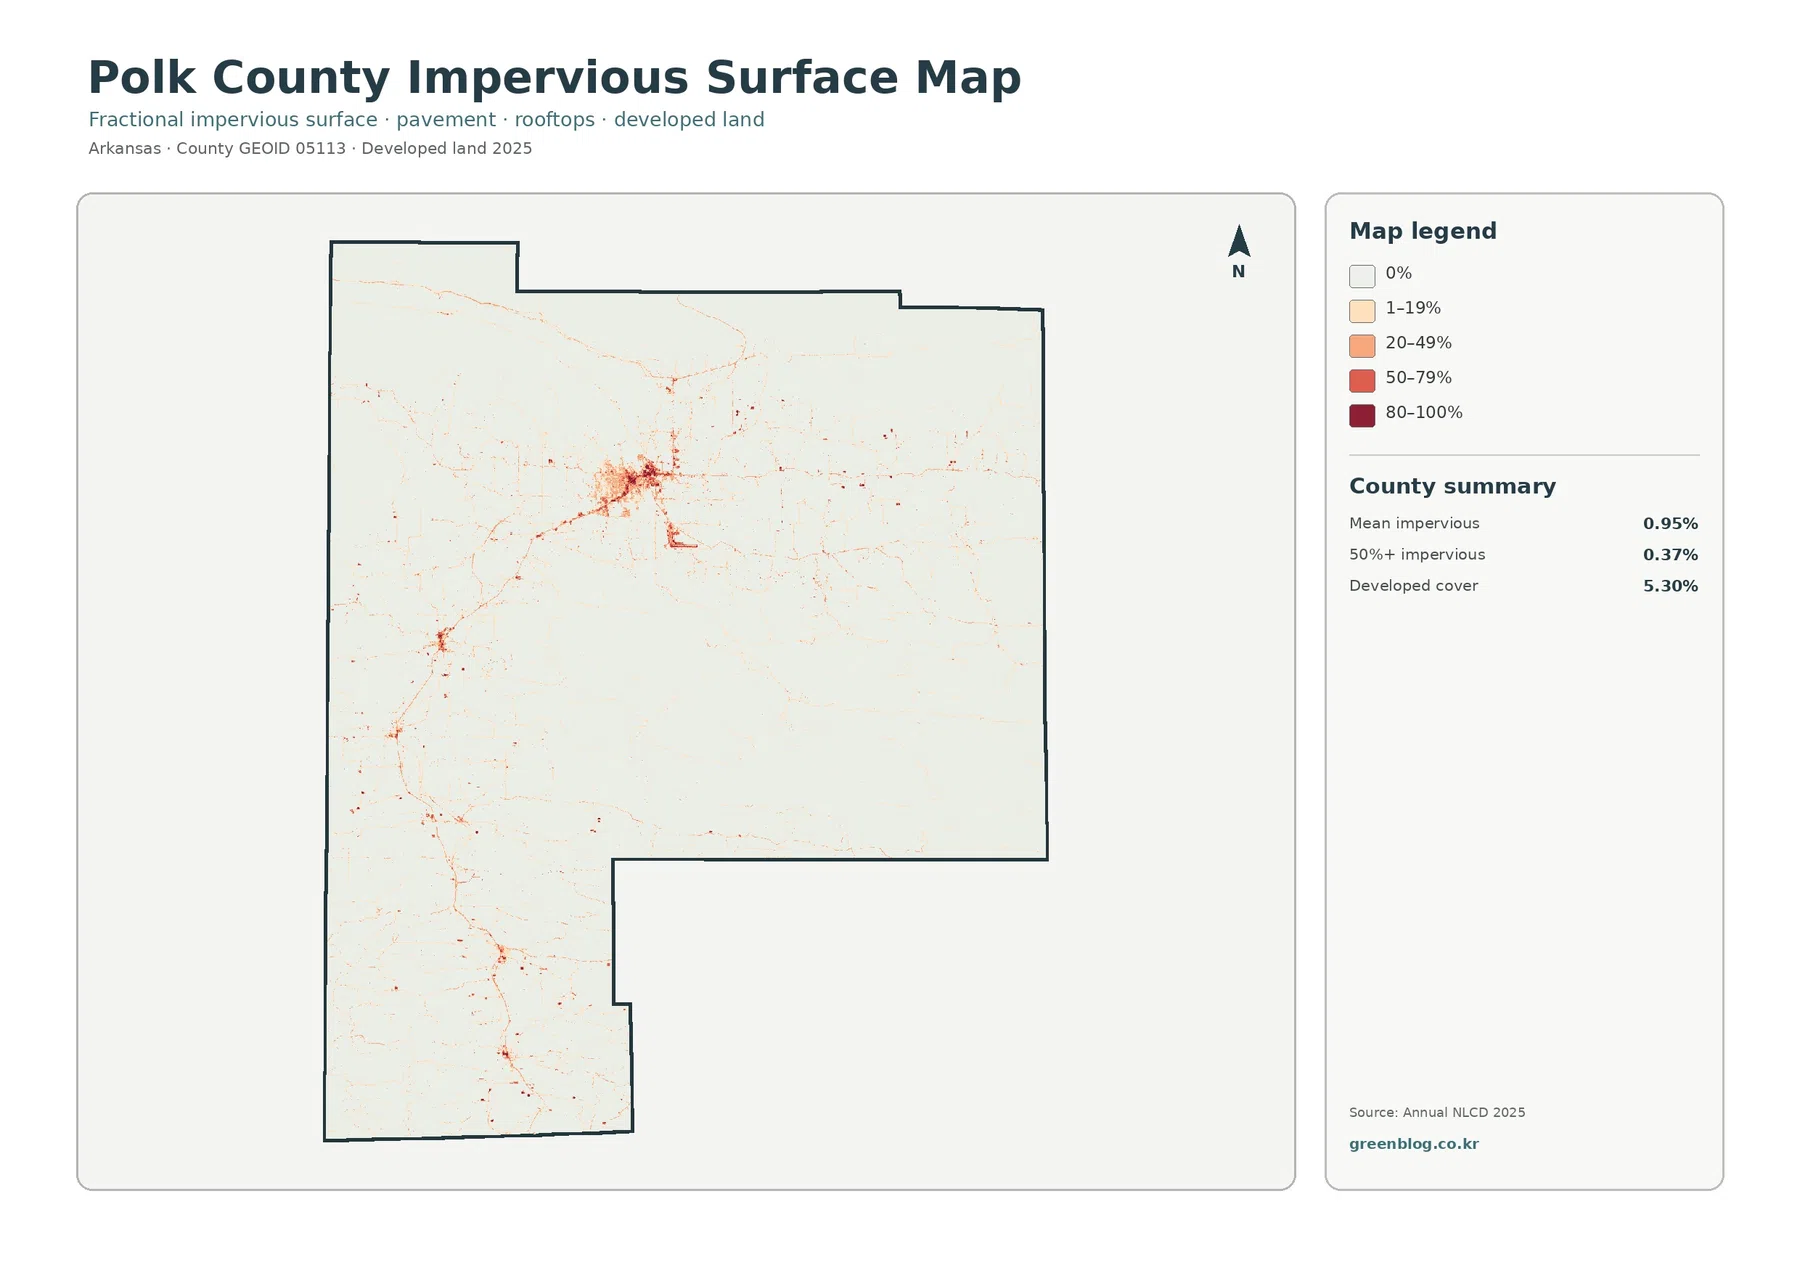
Impervious surface means pavement, roofs, parking areas, and other hard surfaces that do not readily absorb rainfall. Polk County’s mean impervious value is 0.95%, while 0.37% of the county is mapped at fifty percent impervious or greater. Those figures are much lower than the 5.30% developed-cover share because developed classes can include lawns, trees, bare soil, and other surfaces that still absorb water. The impervious map measures intensity within cells rather than simply repeating the developed-land category.
Against the nearly white county background, Mena is easy to locate as the largest group of orange and red cells. From that cluster, thinner lines and smaller points extend along travel corridors. Additional small concentrations appear in the western and southwestern county, but none approach Mena in size. This is a useful example of how a low countywide average can still produce a strong local pattern: the hard surfaces are scarce overall, yet they are concentrated enough to make settlements and roads visible.
The map should not be used as a municipal-boundary layer. A high impervious cell near Mena does not prove that the cell lies inside the city limits, and parts of a city can have low impervious values because of yards, parks, wooded lots, or other permeable surfaces. For exact administrative boundaries, a Census TIGER/Line layer is more appropriate. Here, the value is in showing where built surfaces are concentrated relative to the surrounding forest and farmland.
The 1985–2025 comparison is more about scattered class differences than one single conversion story
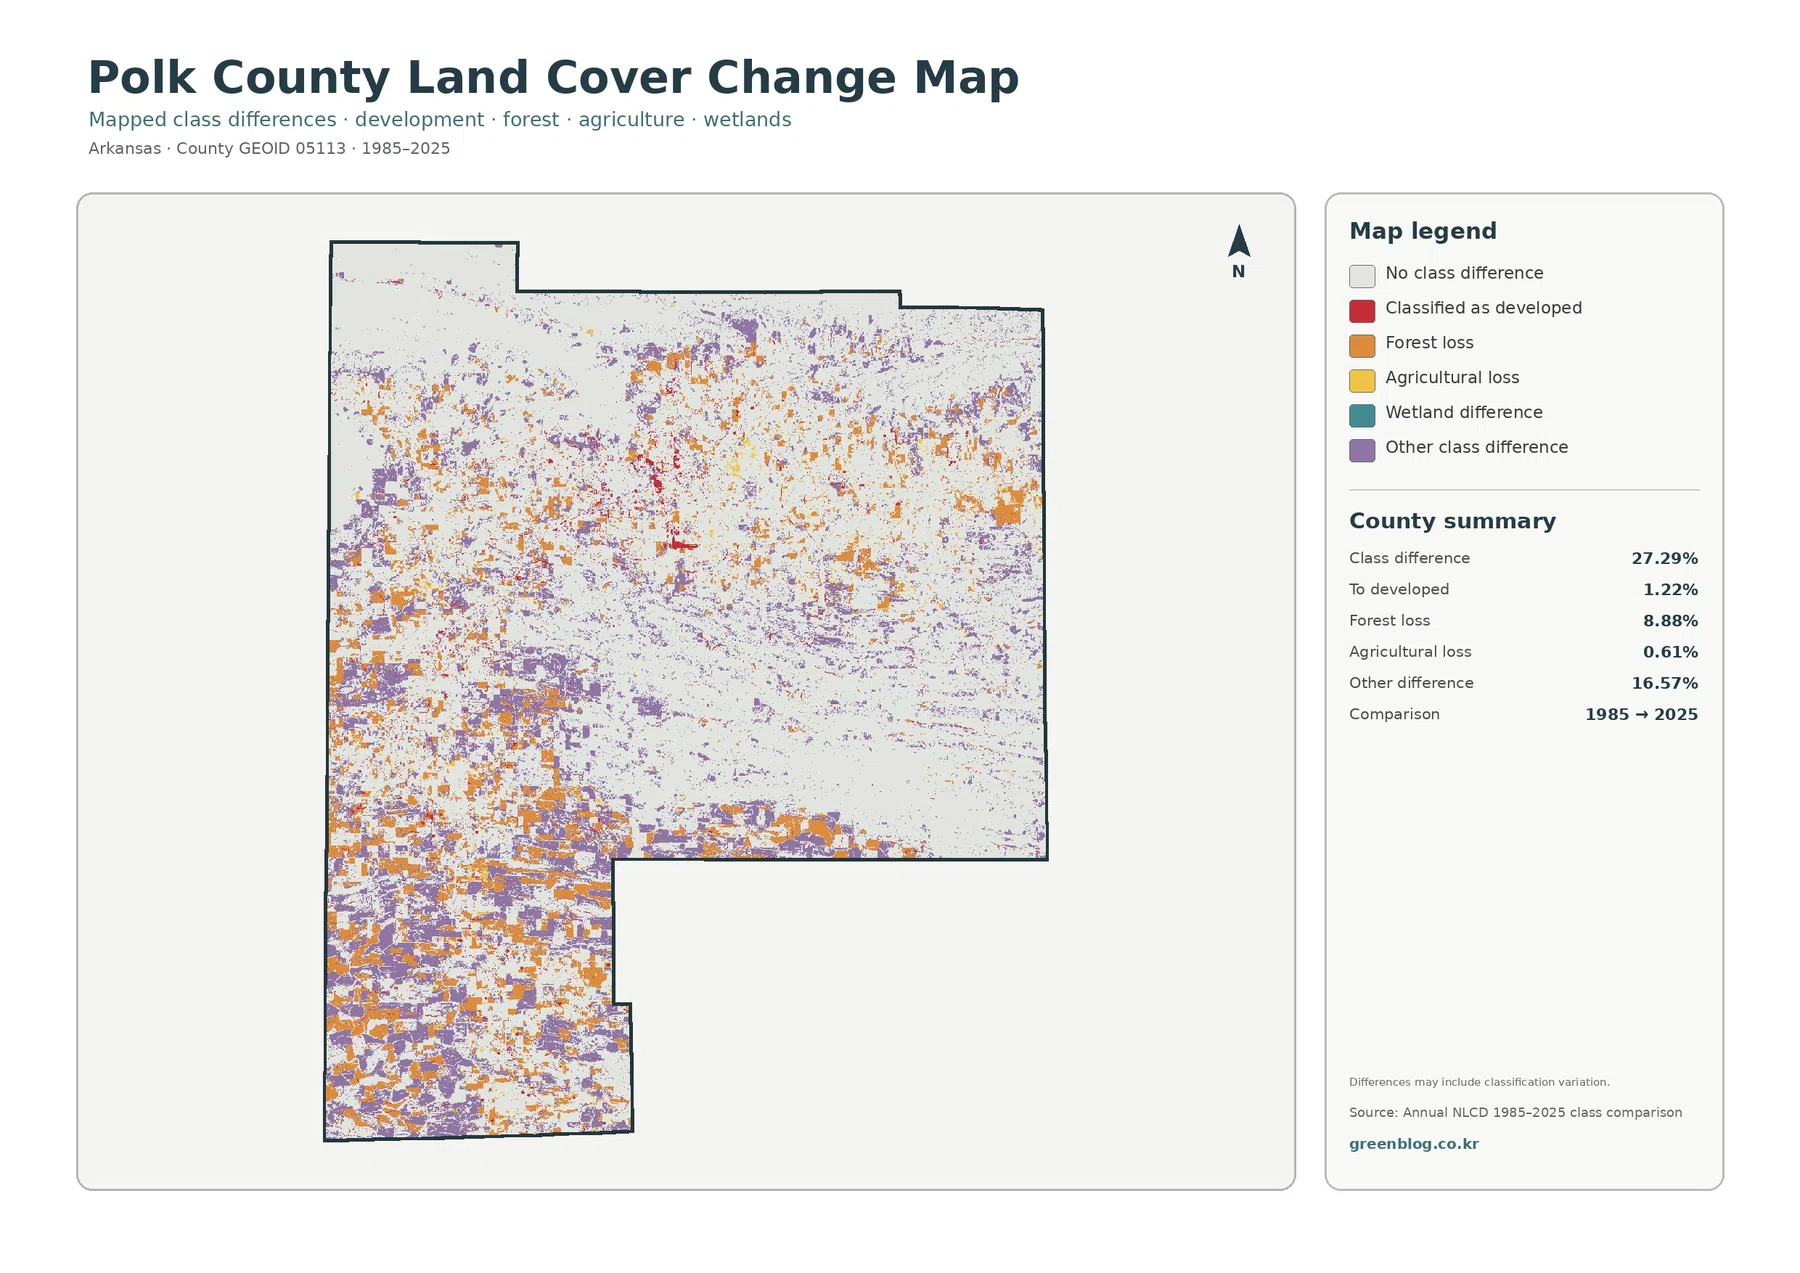
The change map uses a different question from the three current-condition maps. It highlights cells whose mapped class differs between 1985 and 2025. Polk County’s total class difference is 27.29%. The summary identifies 8.88% as forest loss, 1.22% as change to developed, 0.61% as agricultural loss, and 16.57% as other class difference. Because these are classification comparisons, they should not be restated as legal land-use conversions or parcel-by-parcel development records.
Orange forest-loss cells are spread across many parts of the county rather than forming one single large clearing. They are especially noticeable where the forest meets the more mixed western and southwestern landscape, but smaller patches also occur within the broad forest region. Purple other-difference cells are even more widespread. Their 16.57% share is the largest named component of the change total, which is a reminder that the comparison cannot be reduced to a simple “forest became development” narrative.
The red change-to-developed category is only 1.22%. It is most visible around existing settlement and road patterns, including the Mena area, but the map alone does not establish why those cells changed classification. Likewise, 8.88% forest loss does not identify logging, fire, storm damage, agriculture, or construction as the cause. Those explanations require time-specific aerial imagery, forest-management records, or other local evidence. The map tells us where classifications differ; it does not supply a cause for every colored cell.
White areas marked as no class difference are just as important as the colored cells. A viewer who looks only at the change colors may overestimate how completely the county changed. Much of Polk County remained in the same broad mapped class across the two comparison years. The correct takeaway is that change is substantial enough to be visible and spatially widespread, but it is mixed among several categories and exists alongside large stable areas.
Choosing the right map depends on whether the question is forest extent, settlement intensity, or long-term change
For a quick county overview, start with the 2025 land-cover map and identify the large central-and-eastern forest mass, the more open western landscape, and the Mena cluster. The forest-and-farmland view is better when the main question is how agricultural and other open land break up that forest. If the subject is settlement or stormwater-related hard surface, the impervious map removes much of the visual competition and makes Mena and the road network easier to see. The change map should come last because its colors describe differences between years rather than current cover.
In a classroom or presentation, pairing two maps can be more effective than showing all four at once. The general map beside the impervious map demonstrates how a 5.30% developed class can contain a much smaller amount of highly impervious surface. The forest-and-farmland map beside the change map helps separate present-day open land from areas whose classification changed over time. The downloadable ZIP contains the four original JPG maps, so the same comparisons can be used in print layouts or larger presentation slides.
Scale, date, and mixed pixels matter when the map is used beyond countywide comparison
Annual NLCD is a raster dataset commonly represented with 30-meter cells. At that scale, a narrow road, a small stream, a house lot, a forest edge, and an adjoining field can occupy the same cell. The classification assigns a representative class, so very small features may be simplified or blended into nearby cover. This matters in Polk County because many of the agricultural and open patches have irregular boundaries against forest, and the developed traces outside Mena are often narrow.
The observation year also sets a limit. The current land-cover and impervious maps represent 2025 conditions, while the change view compares 1985 with 2025. Construction, forest work, agricultural changes, or other alterations after 2025 will not appear in these images. Small water features can also vary with conditions at the time of observation. Anyone checking a current project site should use recent aerial imagery and local records rather than treating this countywide classification as a present-day site survey.
Used at the intended scale, the maps are most helpful for pattern recognition. In Polk County, they separate four distinct ideas: a 71.46% forest-dominated mountain landscape, a western and southwestern patchwork of agriculture and other open cover, a compact concentration of hard surface around Mena, and a 27.29% mapped class difference between 1985 and 2025. Keeping those ideas separate prevents the current map, the impervious map, and the change map from being mistaken for three versions of the same information.
Frequently Asked Questions
What is the dominant land-cover class in Polk County, Arkansas?
Forest is the dominant 2025 class at 71.46%. Agriculture accounts for 16.33%, developed land 5.30%, shrubland 4.31%, and grassland 1.99%. The forest is especially extensive across the central and eastern county.
Which map is best for locating the Mena developed area?
The impervious-surface map is the clearest choice. Polk County has a low 0.95% mean impervious value, but Mena forms the strongest local concentration of high-value cells, with smaller developed traces following roads elsewhere in the county.
Does the 27.29% class difference from 1985 to 2025 mean that 27.29% of the county changed legal land use?
No. It means the mapped land-cover class differs between the two comparison years for 27.29% of the area. Real landscape change can contribute, but mixed pixels, observation conditions, and classification differences can also affect the result.
Map File Information
The ZIP contains the four original Polk County JPG maps used for this article: current land cover, forest and farmland, impervious surface and developed land, and the 1985–2025 land-cover change view. They are useful when you need a larger source image for printing, class materials, presentations, or county-to-county comparison.
- Included Files: Use only the versions confirmed in the article and supplied images
- File Type: Use the confirmed download contents
- Intended Use: Printing, education, presentations, and map-based projects
Related Maps
- A Craighead County Arkansas Land Cover Map
- Arkansas County Arkansas Land Cover Map
- Ashley County Arkansas Land Cover Map
Sources and references
- MRLC Annual NLCD Data – official access to Annual NLCD land-cover products and related data
- USGS Annual NLCD Land Cover Classification – official explanation of the land-cover classes used in the dataset
- U.S. Census Bureau TIGER/Line Shapefiles – reference source for county and other administrative boundaries
- U.S. Forest Service – Roaring Branch Research Natural Area – official Forest Service information about a Polk County research area in Ouachita National Forest
- Encyclopedia of Arkansas – Polk County – trusted background reference for Polk County and its county seat, Mena
Green Map creates custom-edited map images using open geographic data sources such as geoBoundaries, Natural Earth, OpenStreetMap, and government open data.
These maps are edited visual materials, not raw data files, and are provided for education, documents, presentations, and graphic reference.