Ouachita County in southern Arkansas is dominated by two land-cover classes that occupy very different parts of the map. Forest covers 48.88% of the 2025 summary, while wetlands account for 29.81%. The forest is broad across the west and south, wetlands spread through much of the north-central and eastern county, and the strongest developed cluster sits around Camden. That combination makes the county easier to understand as a forest-and-wetland landscape with a few concentrated built areas rather than as a continuous agricultural or urban region.
Four maps are included here: general land cover, forest and farmland, impervious/developed surfaces, and a 1985–2025 land-cover comparison. Each answers a different question about the same county. The original JPG versions of all four maps are packaged in one ZIP in the download section. This lets the page serve as both an explanation and a source for the map files.
Table of Contents
The 2025 overview is split between forest in the west and broad wetlands to the east
Dark green forest occupies much of western Ouachita County and remains extensive across the southern half. Teal wetlands form a second large block from the north-central interior toward the irregular eastern boundary. Developed classes appear in red, but they are not spread evenly. A strong concentration near the county center stands out immediately, with another noticeable cluster toward the northeast and smaller points elsewhere. Agriculture and other open classes appear in scattered patches rather than forming one continuous farm belt.
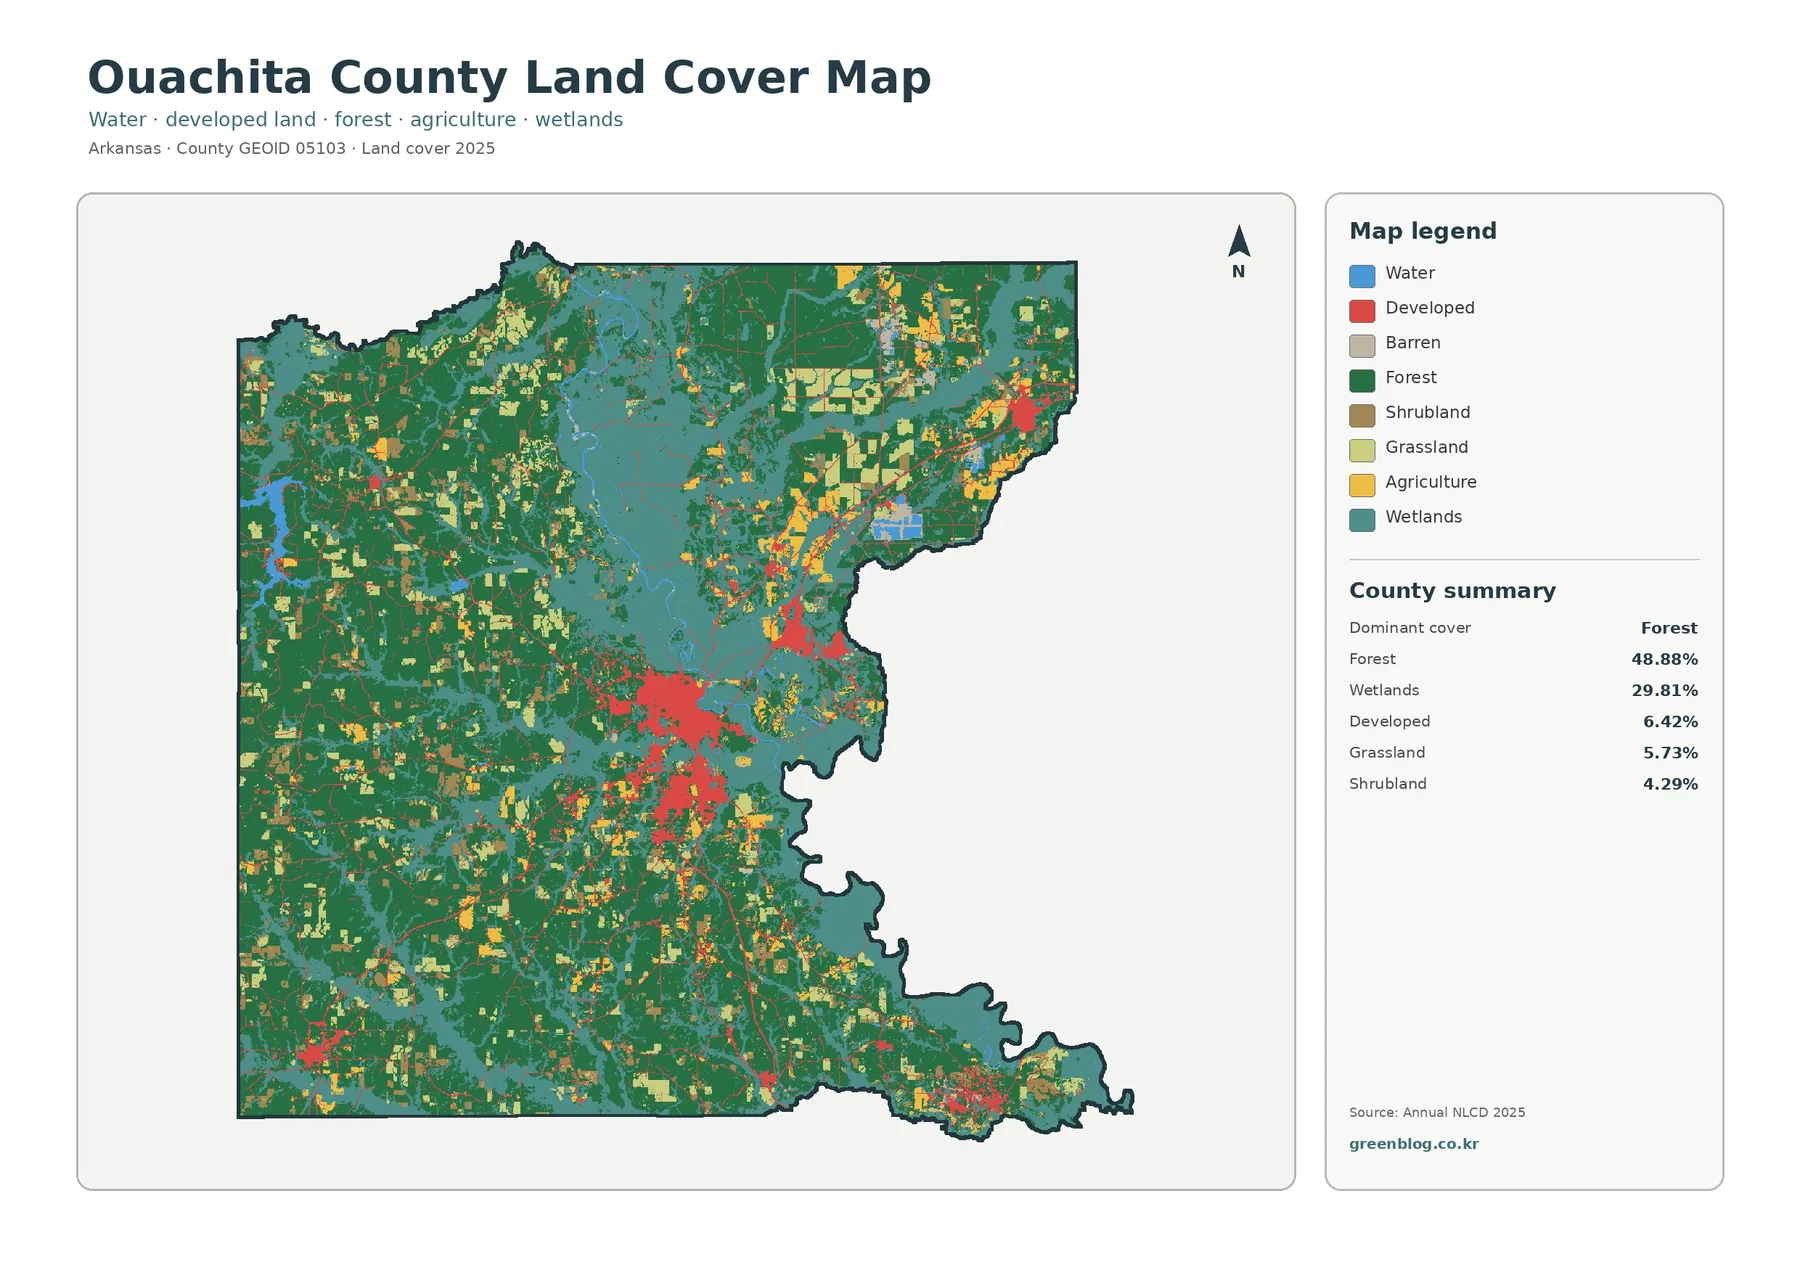
The county summary gives the visual pattern useful scale. Forest is 48.88%, wetlands 29.81%, developed land 6.42%, grassland 5.73%, shrubland 4.29%, agriculture 3.14%, and open water 1.26%. Those values matter because some bright agricultural and open-ground patches are easy to overestimate by eye. They are visible, especially in the north and northeast, but the countywide total remains much smaller than forest or wetlands.
Land cover is a surface classification, not a zoning or ownership map. A forest cell does not identify who owns the land, and a wetland cell does not establish a regulatory wetland boundary. Developed cells also do not distinguish residential, commercial, or industrial use. Parcel lines, permits, legal land use, and development rights have to be checked in other records.
Camden is much more obvious when the county is reduced to impervious surface
Impervious surface means pavement, rooftops, parking areas, and other surfaces that do not readily absorb water. The countywide mean impervious value is only 1.28%, and 0.42% of the county is mapped at 50% or greater imperviousness. Those numbers are far below the 6.42% developed-land share because developed classes can include lawns, trees, bare soil, and other permeable surfaces around buildings and roads.
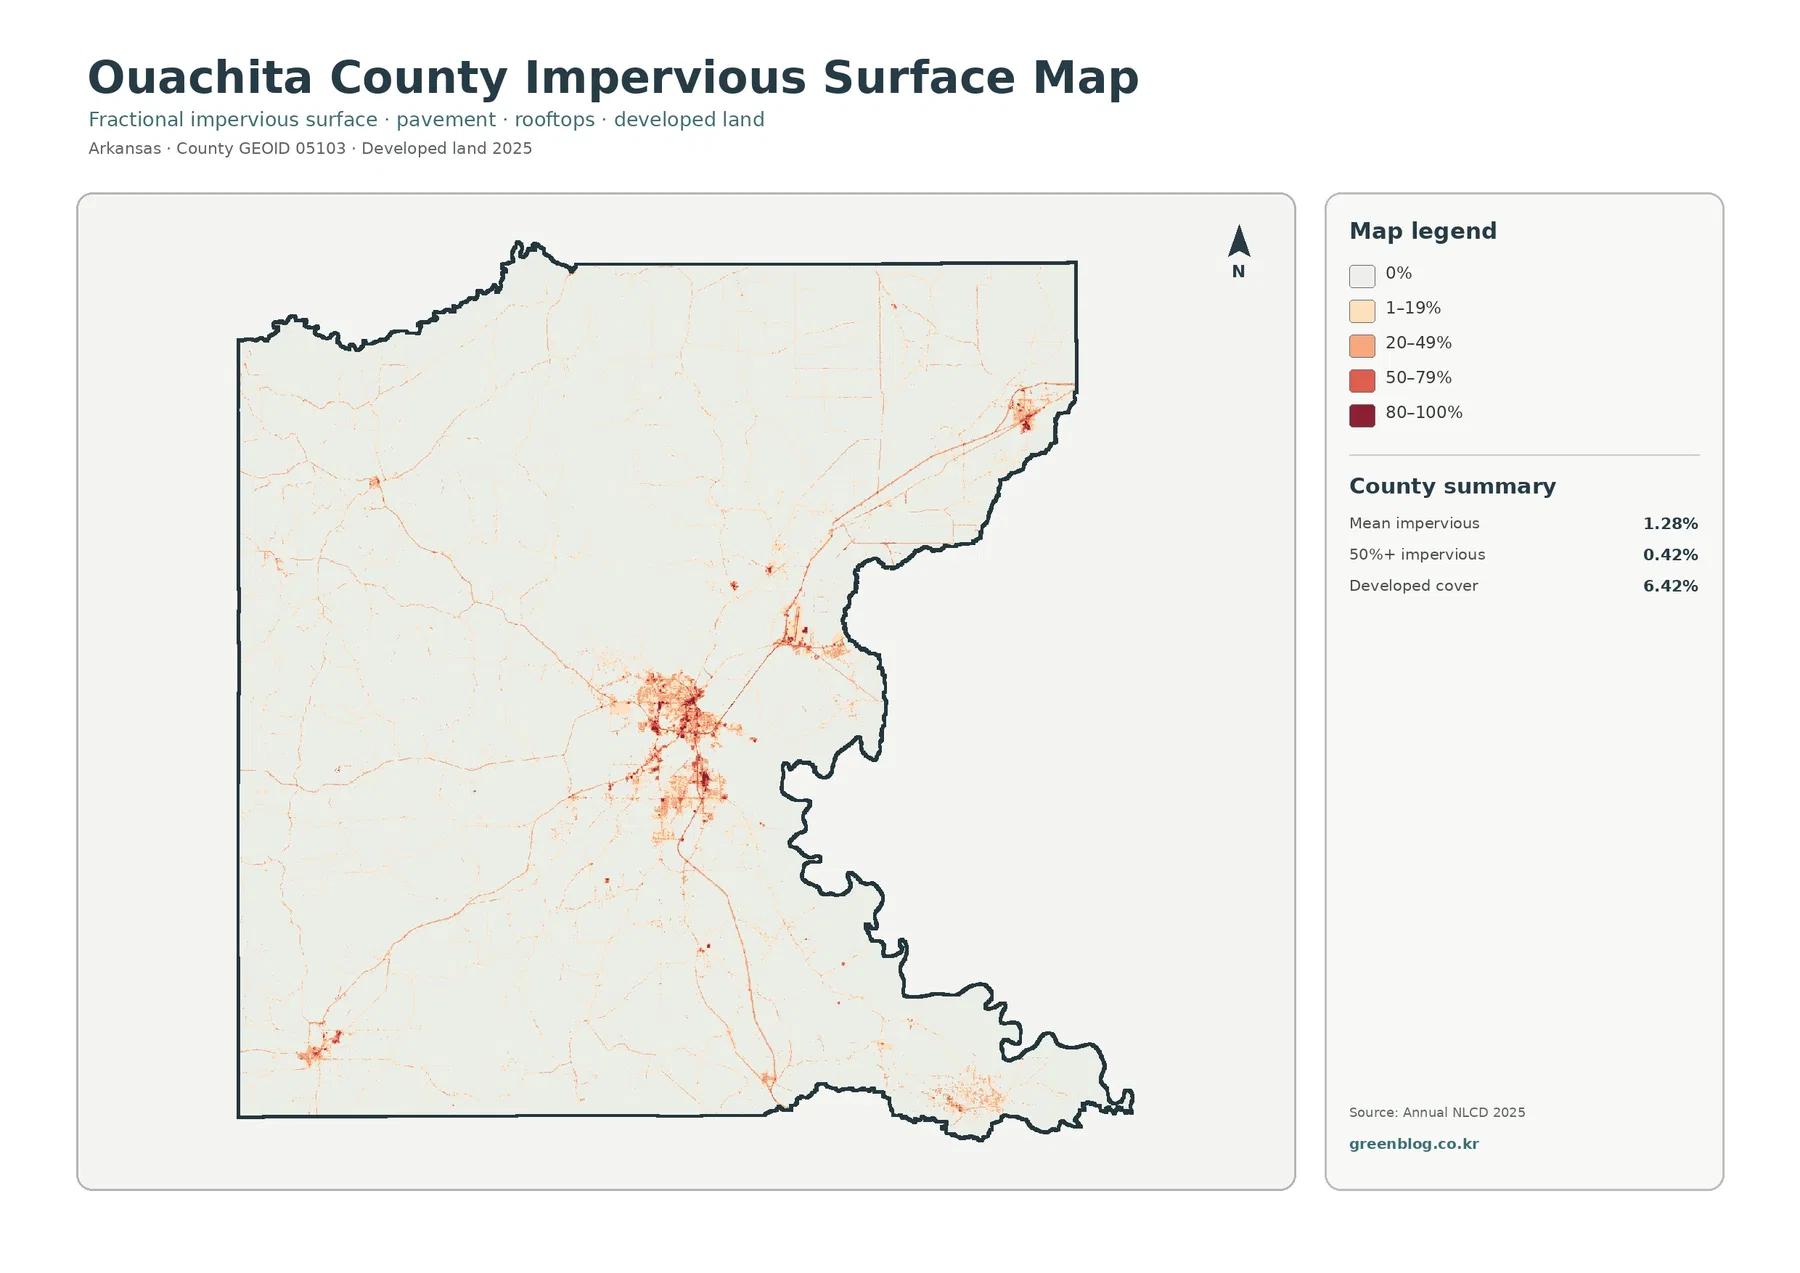
The pale county background makes the central cluster especially easy to see. A dense red pattern sits around Camden, and several thin lines extend outward from that area. The pattern is consistent with roads and settled corridors being concentrated in the same places, although the map does not label road names or municipal boundaries. A separate northeastern cluster is visible as well, while smaller concentrations occur near the southern edge.
Because the map shows surface intensity rather than population, a darker cell should not be translated directly into a building count or a population estimate. It is better used to compare where hard surfaces are concentrated and where most of the county remains lightly developed. For a precise city limit or road alignment, pair it with an administrative or transportation map.
Agriculture remains a minor class when forest, pasture, and open ground are separated
The forest-and-farmland map simplifies the legend so smaller open areas are easier to distinguish from the dominant natural cover. Forest remains broad in the west and southwest, while the large wetland area across the north-central and eastern county still stands out. Cropland and pasture/hay occur in many small pieces, with more visible openings toward northern and northeastern portions, but they do not create a countywide agricultural plain.
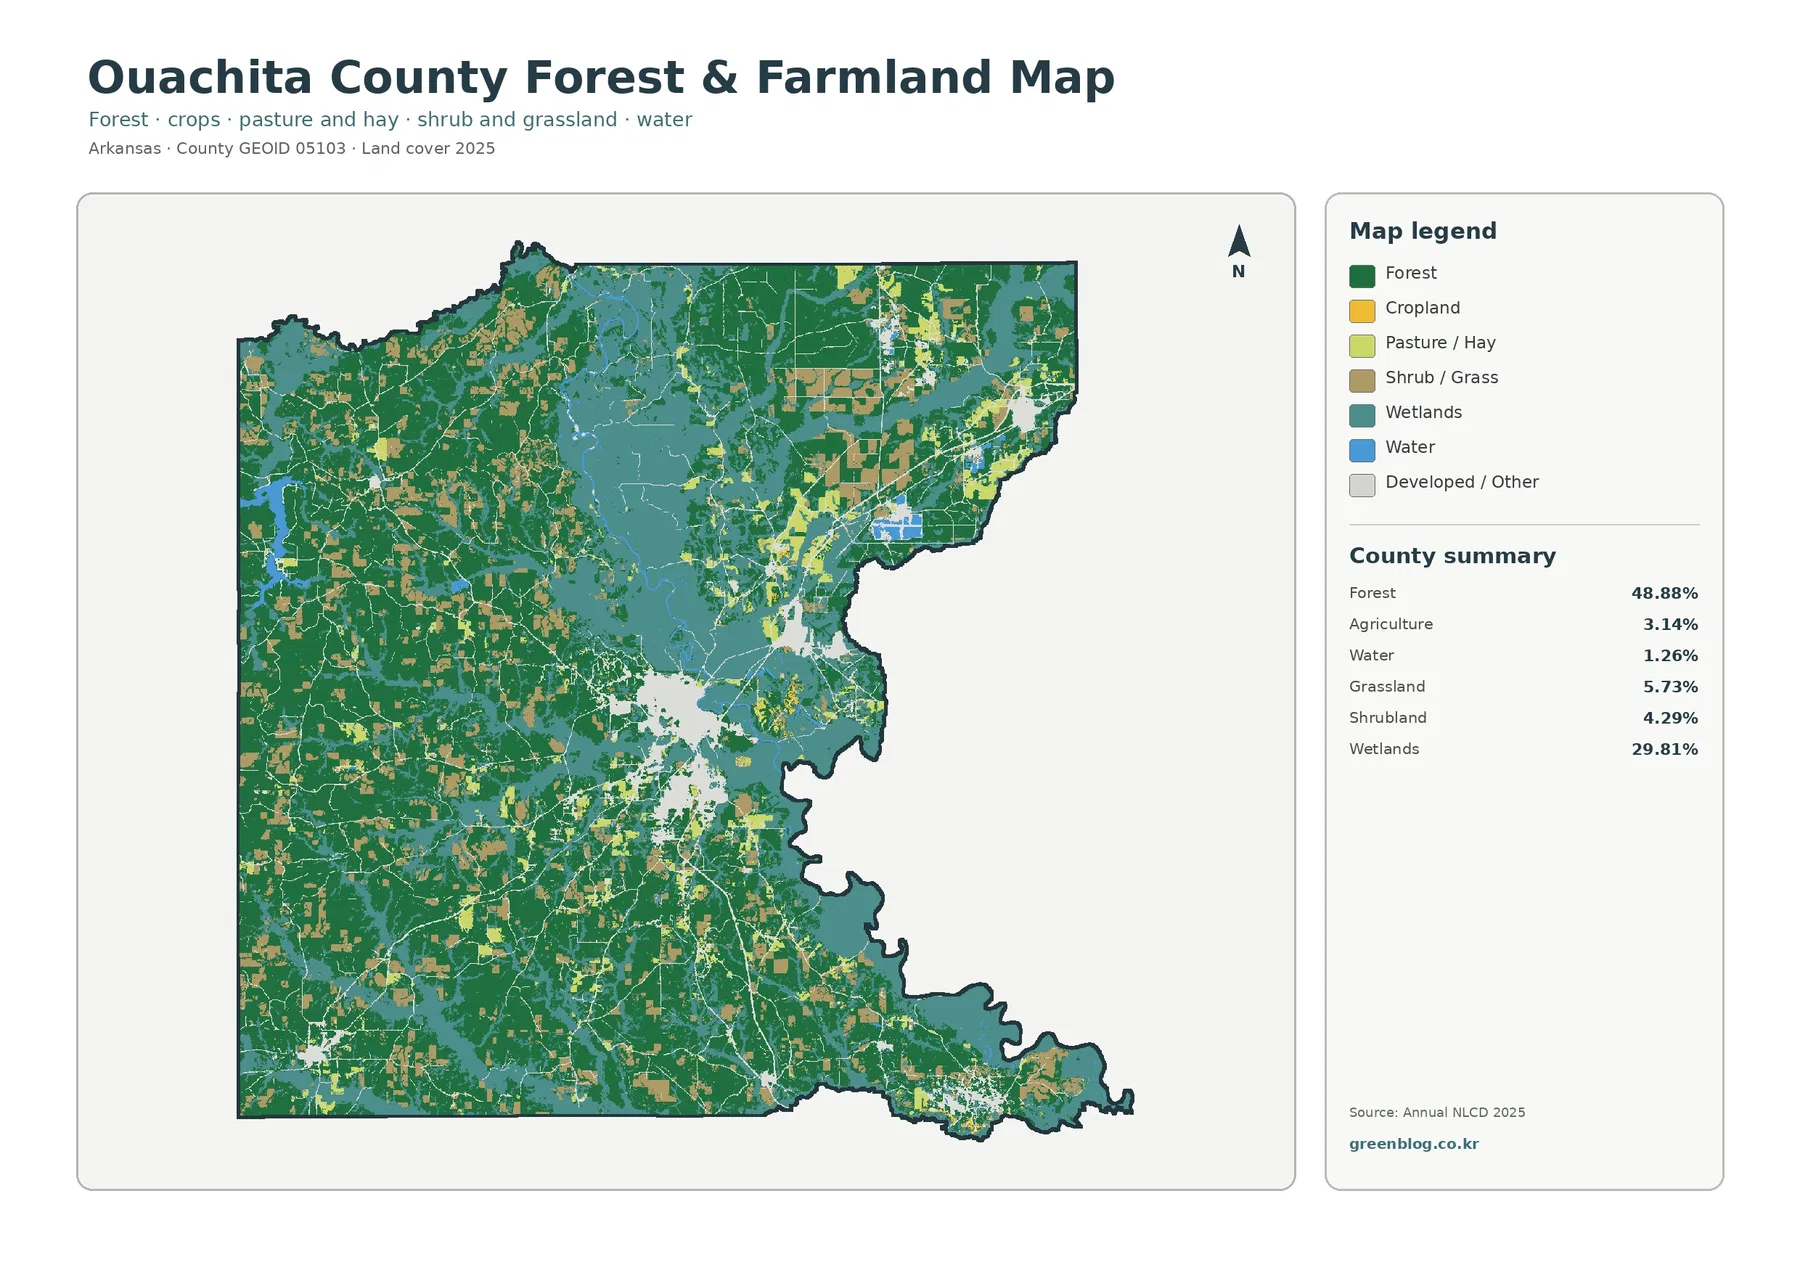
Agriculture is 3.14% in the supplied summary, but that number should not be expanded to include every light-colored patch. Grassland is 5.73% and shrubland is 4.29%, and the simplified legend also separates developed/other areas from cropland and pasture. That distinction is useful when a reader wants to identify true agricultural cover rather than treating every clearing as farmland.
The University of Arkansas Cooperative Extension office for Ouachita County provides local information on agriculture, soils, livestock and forage, horticulture, and related community needs. That county context confirms that farming and pasture are part of the local landscape. It does not convert the mapped 3.14% into farm production, acreage by commodity, or number of farms. Those questions require agricultural statistics rather than land-cover percentages.
The change layer highlights widespread class differences without turning them into a single trend
The 1985–2025 comparison reports a total class difference of 20.55%. The displayed components include 1.07% classified as change to developed, 10.16% forest loss, 1.21% agricultural loss, and 5.00% other class difference. Orange forest-loss cells are scattered through many parts of the county, with noticeable groups in the west, north, and northeast. Red change-to-developed cells are much more limited and are concentrated near Camden and selected linear settlement or transportation areas.
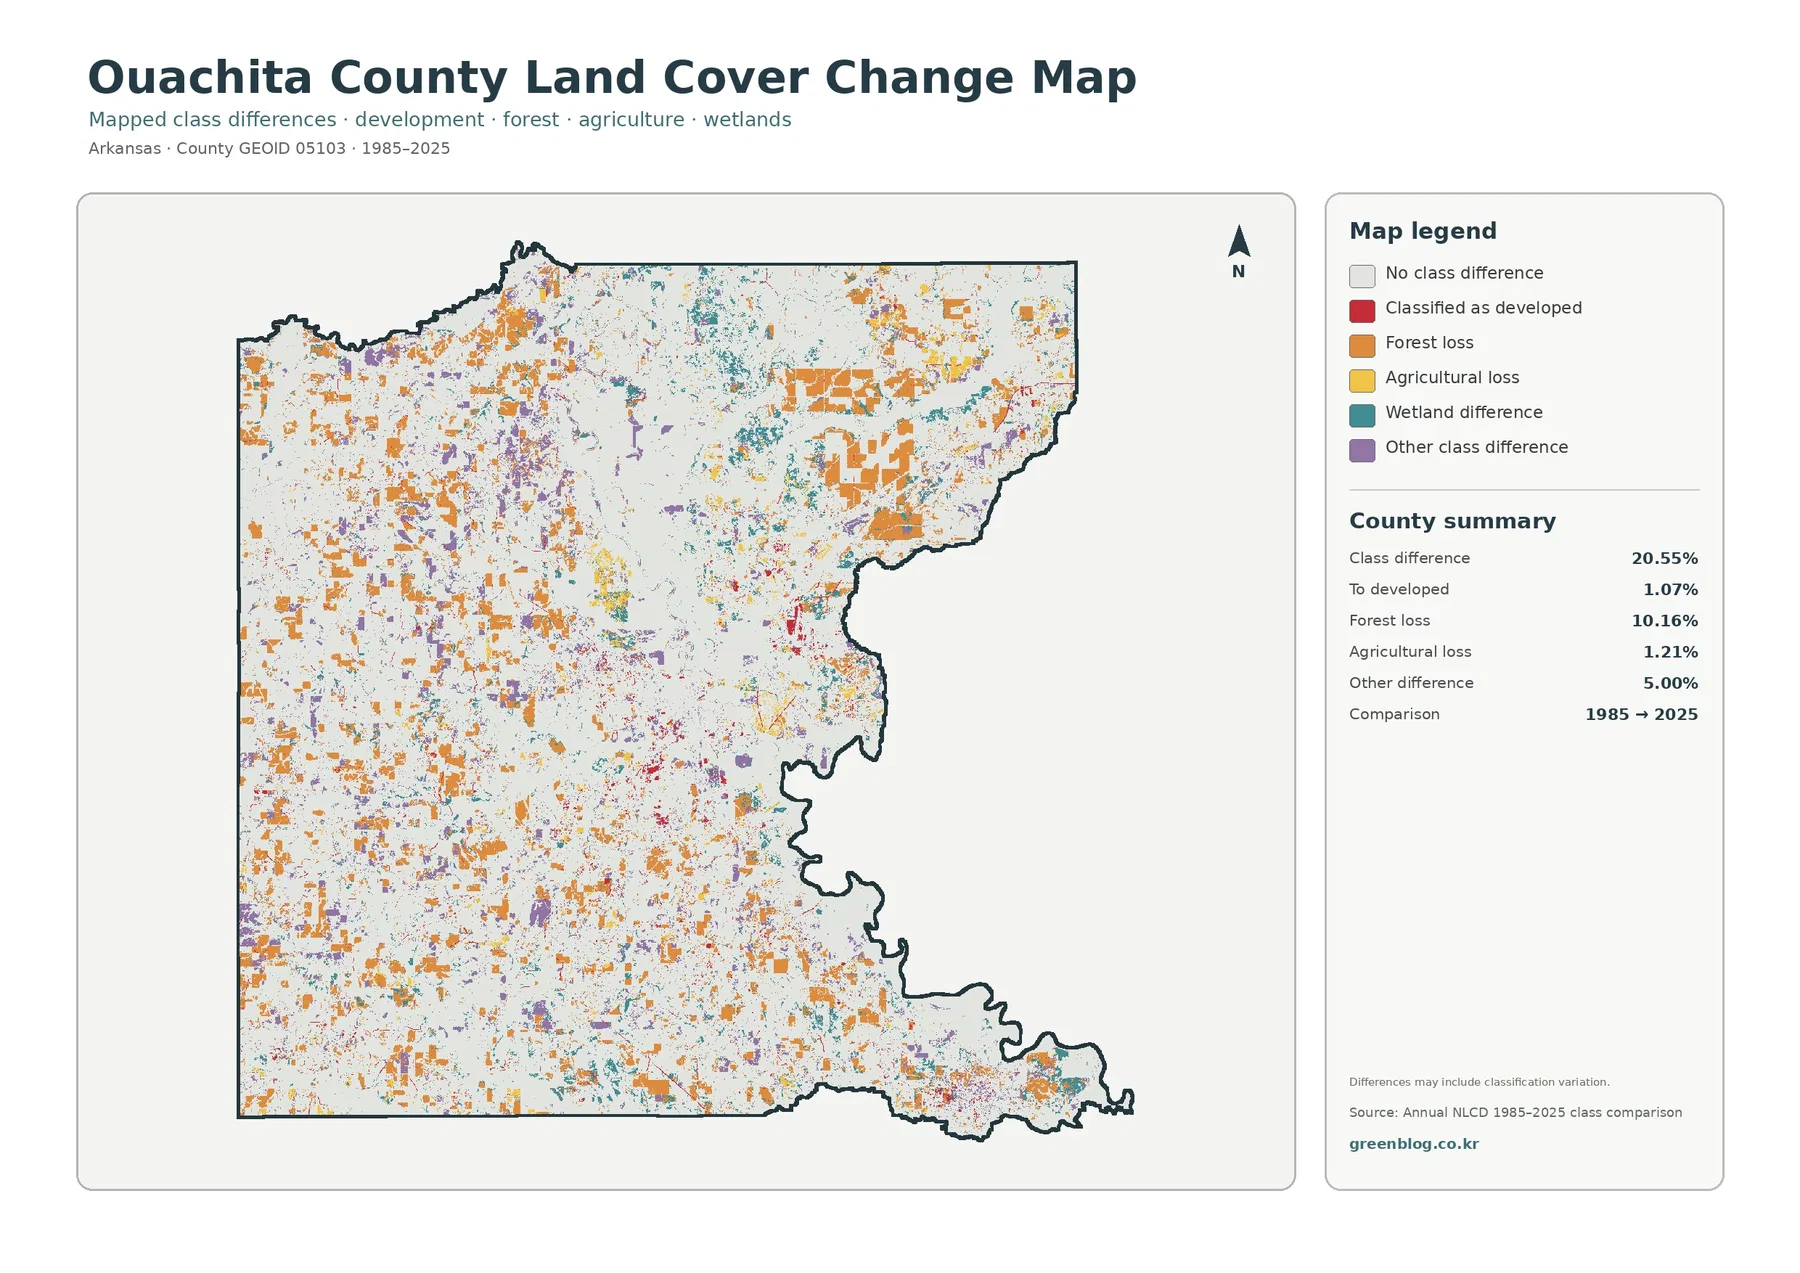
A 20.55% class difference does not mean 20.55% of Ouachita County became urban. It combines several kinds of classification change. In the same way, the 10.16% forest-loss figure should not be treated as a verified forty-year net deforestation rate. It identifies cells that moved from a forest class in the earlier comparison to another class in 2025. The map alone does not establish whether a change was permanent, temporary, followed by regrowth, or partly affected by classification variation.
The legend itself notes that the differences may include classification variation. Mixed cells can contain trees, grass, water, roads, and buildings at the same time. Changes in imagery or classification can therefore alter the assigned class even when the ground change is modest. A responsible workflow is to use this map to locate areas worth checking, then compare additional Annual NLCD years, historical aerial imagery, forestry records, or local information before assigning a cause.
The Ouachita River setting explains why open water and wetlands must be read separately
Open water accounts for 1.26% of the supplied county summary, far below the 29.81% wetland share. The two classes are not interchangeable. Open water represents mapped water surfaces, while wetlands can include vegetated or low-lying areas influenced by wet conditions. A river channel may occupy a relatively narrow area even where wetland cover extends across a much wider lowland.
The Encyclopedia of Arkansas describes the Ouachita River as forming part of the county’s eastern boundary and places Camden at a bend of the river. It also discusses pine forests, bayous, and sloughs draining toward the Ouachita. That background is useful when looking at the broad teal wetland pattern in the eastern and north-central county. It should not, however, turn the teal pixels into a floodplain map or a legal wetland delineation.
For watershed education or county-scale environmental comparison, the relationship between forest, wetlands, water, and developed surfaces is exactly what makes the four-map set useful. For flood elevation, wetland jurisdiction, drainage design, or site permitting, use the appropriate hydrologic and regulatory sources instead.
Choose the map according to the question instead of treating the set as four versions of one image
Use the general land-cover map when you need one countywide overview. It keeps the 48.88% forest share, 29.81% wetlands, smaller agricultural openings, and Camden development cluster in the same frame. If the assignment is about farming, forestry, or open land, the forest-and-farmland view reduces competing classes and makes the smaller cropland and pasture patches easier to find.
The impervious map is the better choice for questions about built surfaces. It reveals the compact Camden core and the thinner linear traces that are much less obvious in the general map. The change layer serves a different purpose again: it identifies cells whose class differs between 1985 and 2025. It is most useful after the current map has already established what the county looks like in 2025.
For presentations, there is no requirement to show all four in a fixed sequence. For a wetland lesson, begin with the general map and then compare the forest/farmland view. Settlement and runoff discussions can start with impervious surface and return to the general map for context. Change studies can use the 1985–2025 layer as a screening step before examining additional years.
Raster scale and observation year limit parcel-level interpretation
Annual NLCD products commonly organize land cover in raster cells roughly 30 meters across so very large areas can be classified consistently. A raster cell is a fixed grid square. When one cell contains trees, grass, a road edge, and part of a building, the dataset has to simplify that mixture into a class or an impervious percentage. Narrow streams, thin roads, and small clearings can therefore look different from their exact outlines in aerial photography.
That generalization matters in Ouachita County because forest, wetlands, roads, and small settlements often meet along narrow boundaries. A teal pixel edge is not a surveyed wetland boundary, and a red developed pixel is not a parcel line. These maps work well for county-scale landscape comparison, lessons, presentations, and preliminary investigation, but they are not substitutes for a boundary survey, wetland delineation, zoning record, or engineering study.
Observation year is another limit. Maps labeled 2025 represent the supplied dataset, so logging, construction, restoration, storm impacts, or agricultural changes after that observation may not appear. By contrast, the 1985–2025 comparison depends on two dates and the classification process used for them. Current site decisions should be checked against newer imagery and local records, and long-term trend analysis should use more than two years.
Download the four Ouachita County JPG maps
The ZIP below contains the four original JPG maps used in this article: 2025 general land cover, forest and farmland, impervious/developed surfaces, and the 1985–2025 land-cover comparison. Each file is 2480×1754 pixels. The supplied images remain at their original resolution. Before making a large print, check the legend and small change patches at the intended output size.
Frequently Asked Questions
Why is developed land 6.42% while the countywide mean impervious value is only 1.28%?
The measurements describe different things. A developed land-cover class can include lawns, trees, soil, and other permeable surfaces around buildings and roads. Impervious surface measures the share of hard surfaces such as pavement and rooftops within a cell. A low-density developed area can therefore count as developed land while still having a modest impervious percentage.
Can the 10.16% forest-loss class be used as Ouachita County’s net deforestation rate?
No. It marks cells classified as forest in the earlier comparison and another class in 2025, and the supplied change map warns that classification variation may be included. The value is useful for finding locations to investigate, but a verified long-term forest trend requires additional Annual NLCD years, historical imagery, and forestry or local records.
Sources and Reference Data
The links below support the dataset definitions, county boundary reference, and local background used to interpret the supplied maps. Land-cover percentages come from the mapped dataset, while county-specific sources are used as context for the Ouachita River, Camden, agriculture, and the surrounding landscape.
- MRLC Annual NLCD Data – official portal for annual land-cover and related products
- USGS Annual NLCD Land Cover Classification – class definitions and interpretation guidance
- U.S. Census Bureau TIGER/Line Shapefiles – official county-boundary reference
- University of Arkansas Cooperative Extension – Ouachita County – local agriculture, soils, forage, horticulture, and community information
- Encyclopedia of Arkansas – Ouachita County – Ouachita River, Camden, forests, bayous, sloughs, and county background
Map File Information
The ZIP contains four original Ouachita County JPG maps: 2025 land cover, forest and farmland, impervious/developed surfaces, and mapped class differences from 1985 to 2025.
- Printable Size: 2480×1754 pixels each
- File Type: ZIP containing four JPG files
Related Maps
- A Craighead County Arkansas Land Cover Map
- Arkansas County Arkansas Land Cover Map
- Ashley County Arkansas Land Cover Map
Green Map creates custom-edited map images using open geographic data sources such as geoBoundaries, Natural Earth, OpenStreetMap, and government open data.
These maps are edited visual materials, not raw data files, and are provided for education, documents, presentations, and graphic reference.