Johnson County, Arkansas is strongly forested in the 2025 land-cover summary, but the county does not look uniform from north to south. Forest accounts for 67.56% of the mapped area, while agriculture makes up 21.07%, developed cover 5.38%, water 2.69%, and wetlands 1.35%. The four maps on this page separate that broad pattern into current land cover, impervious surface, forest and farmland, and class differences between 1985 and 2025.
The page also provides the four original supplied JPG maps in one ZIP download. Use the browser images for quick comparison, then choose the original files when you need a larger map for a presentation, classroom handout, regional reference, or a side-by-side comparison of current cover and mapped change.
Table of Contents
A county where Ozark forest meets Arkansas River Valley farmland
Johnson County sits across two visibly different land-cover settings. An Arkansas Secretary of State county description notes that Arkansas River valley farmlands meet the southern Ozarks within the county. That statement matches the supplied 2025 map well: the northern half is dominated by a broad, nearly continuous forest pattern, while the southern part contains much more agriculture, developed cover, open land, water, and wetlands. The land-cover map is not a topographic map, yet this north-south contrast is clear enough to provide useful geographic context before reading the individual classes.
Clarksville is the county seat, and the county government also lists Lamar, Coal Hill, Hartman, and Knoxville among its cities and towns. The map itself does not print municipal labels, so small developed patches should not be assigned to a named town without another reference. Even with that limitation, the largest developed concentration is plainly in the southern portion of the county, and thin developed traces extend outward from that broader cluster. The far north remains much less developed on the countywide view.
Water adds another layer to the southern pattern. A broad blue area and winding water features follow the lower edge of the county, with additional water visible toward the southeast. Wetland colors occur near some of these water features and within the surrounding lowland mosaic. These mapped relationships are useful for watershed or landscape discussions, but the map does not identify flood depth, water quality, jurisdictional wetland boundaries, or stream discharge.
What the 2025 land-cover map says at a glance
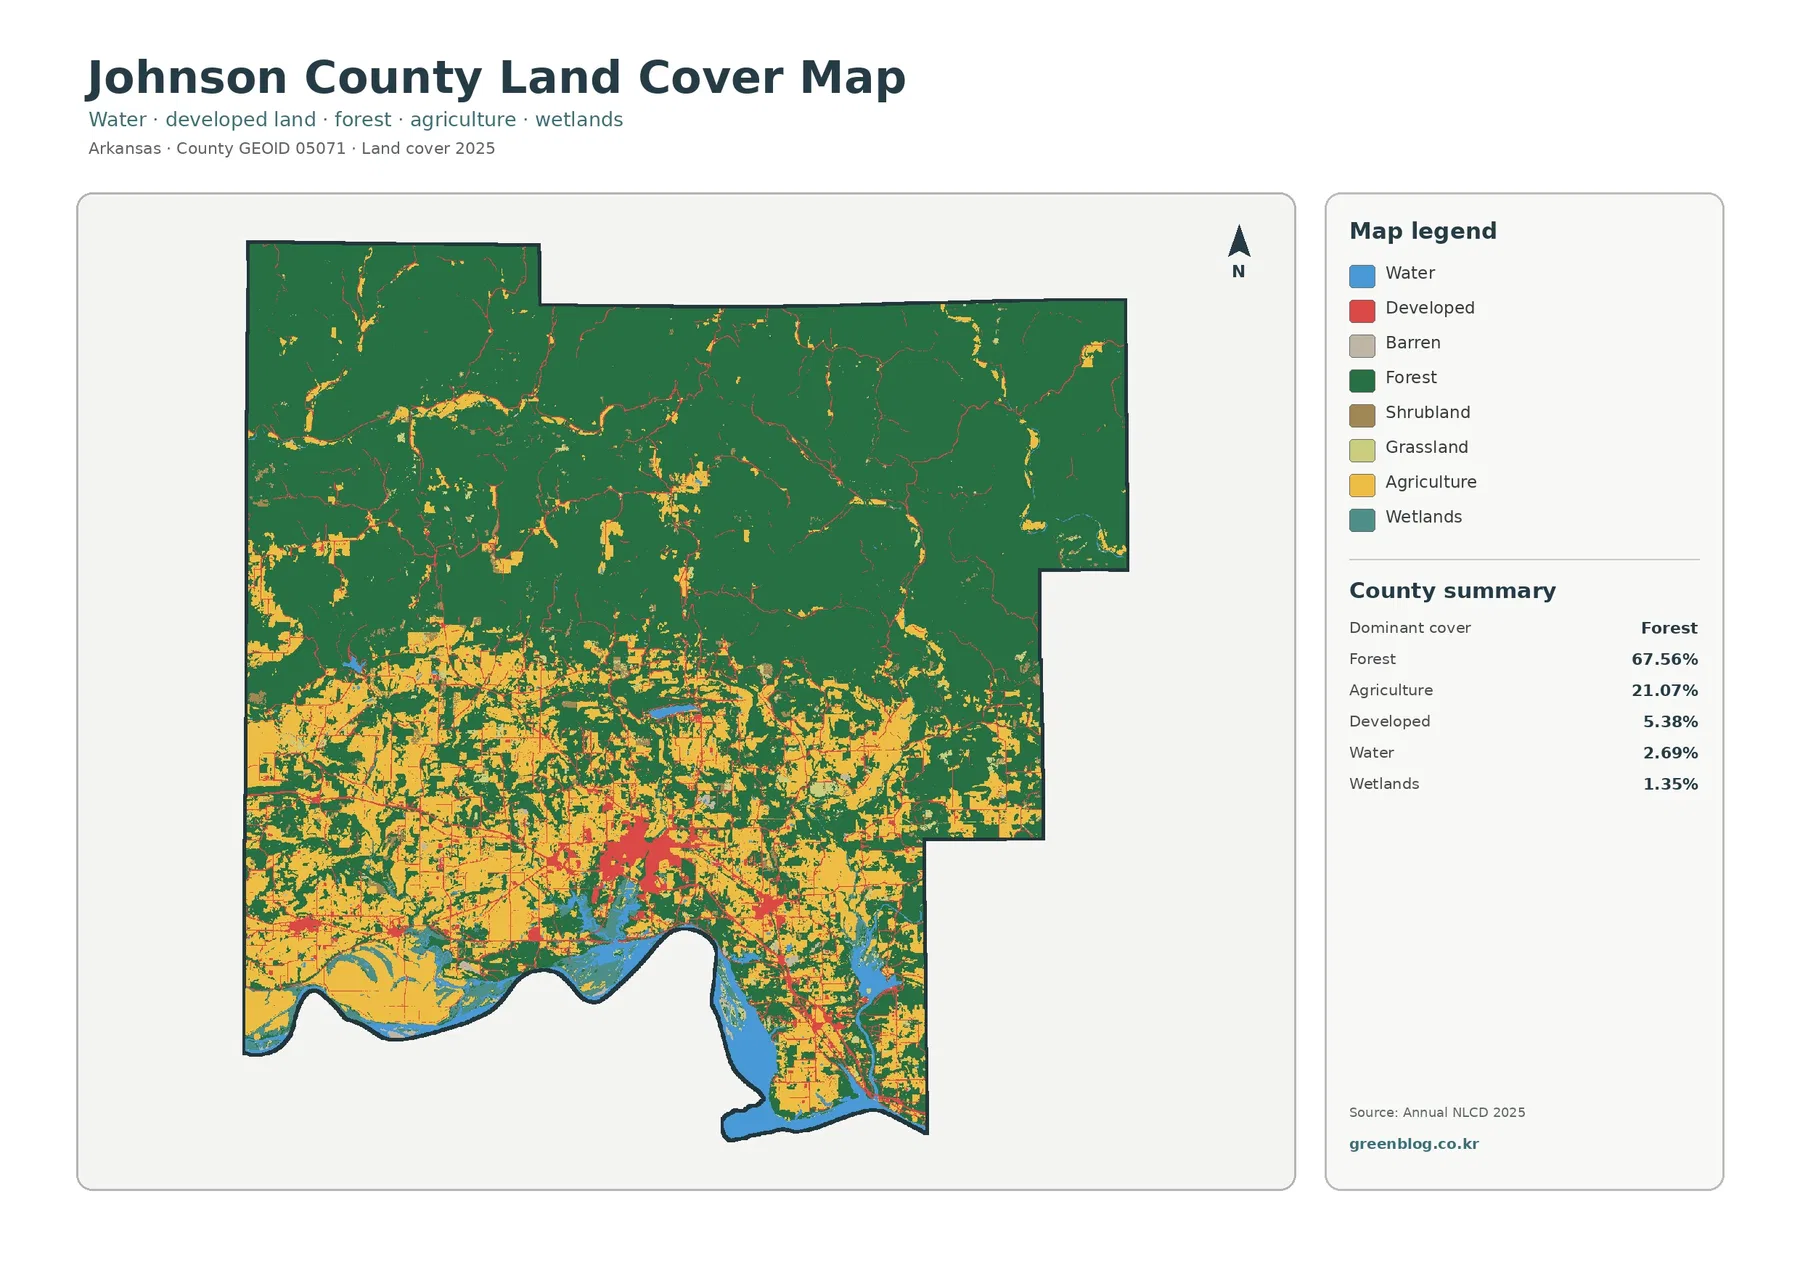
Forest is the defining class on the current map. At 67.56%, it covers far more of the county than any other category and forms the largest continuous areas in the north, northeast, and northwest. Smaller agricultural or open patches interrupt the green in places, but they do not break the overall forest-dominated character of the northern landscape. This is the first feature to emphasize when introducing the county at a regional scale.
Agriculture becomes much more prominent farther south. The 21.07% countywide share appears in broad patches and bands from the southwest through the south-central area and toward the southeast. Forest remains mixed among those fields, so the southern landscape is not a simple block of farmland. The map also does not identify crop type, farm ownership, or whether a particular agricultural cell is active in the current season; it only records the land-cover classification used for the supplied 2025 dataset.
Water and wetlands occupy smaller percentages, but their shapes are visually important. Water accounts for 2.69% and wetlands 1.35% in the supplied summary. Large blue areas near the southern boundary stand out immediately, while narrower water and wetland features weave through the surrounding farm-and-forest mosaic. A watershed lesson can use those patterns to discuss adjacency, but any claim about flooding, habitat quality, or wetland regulation requires additional specialized data.
Impervious surface isolates the built footprint
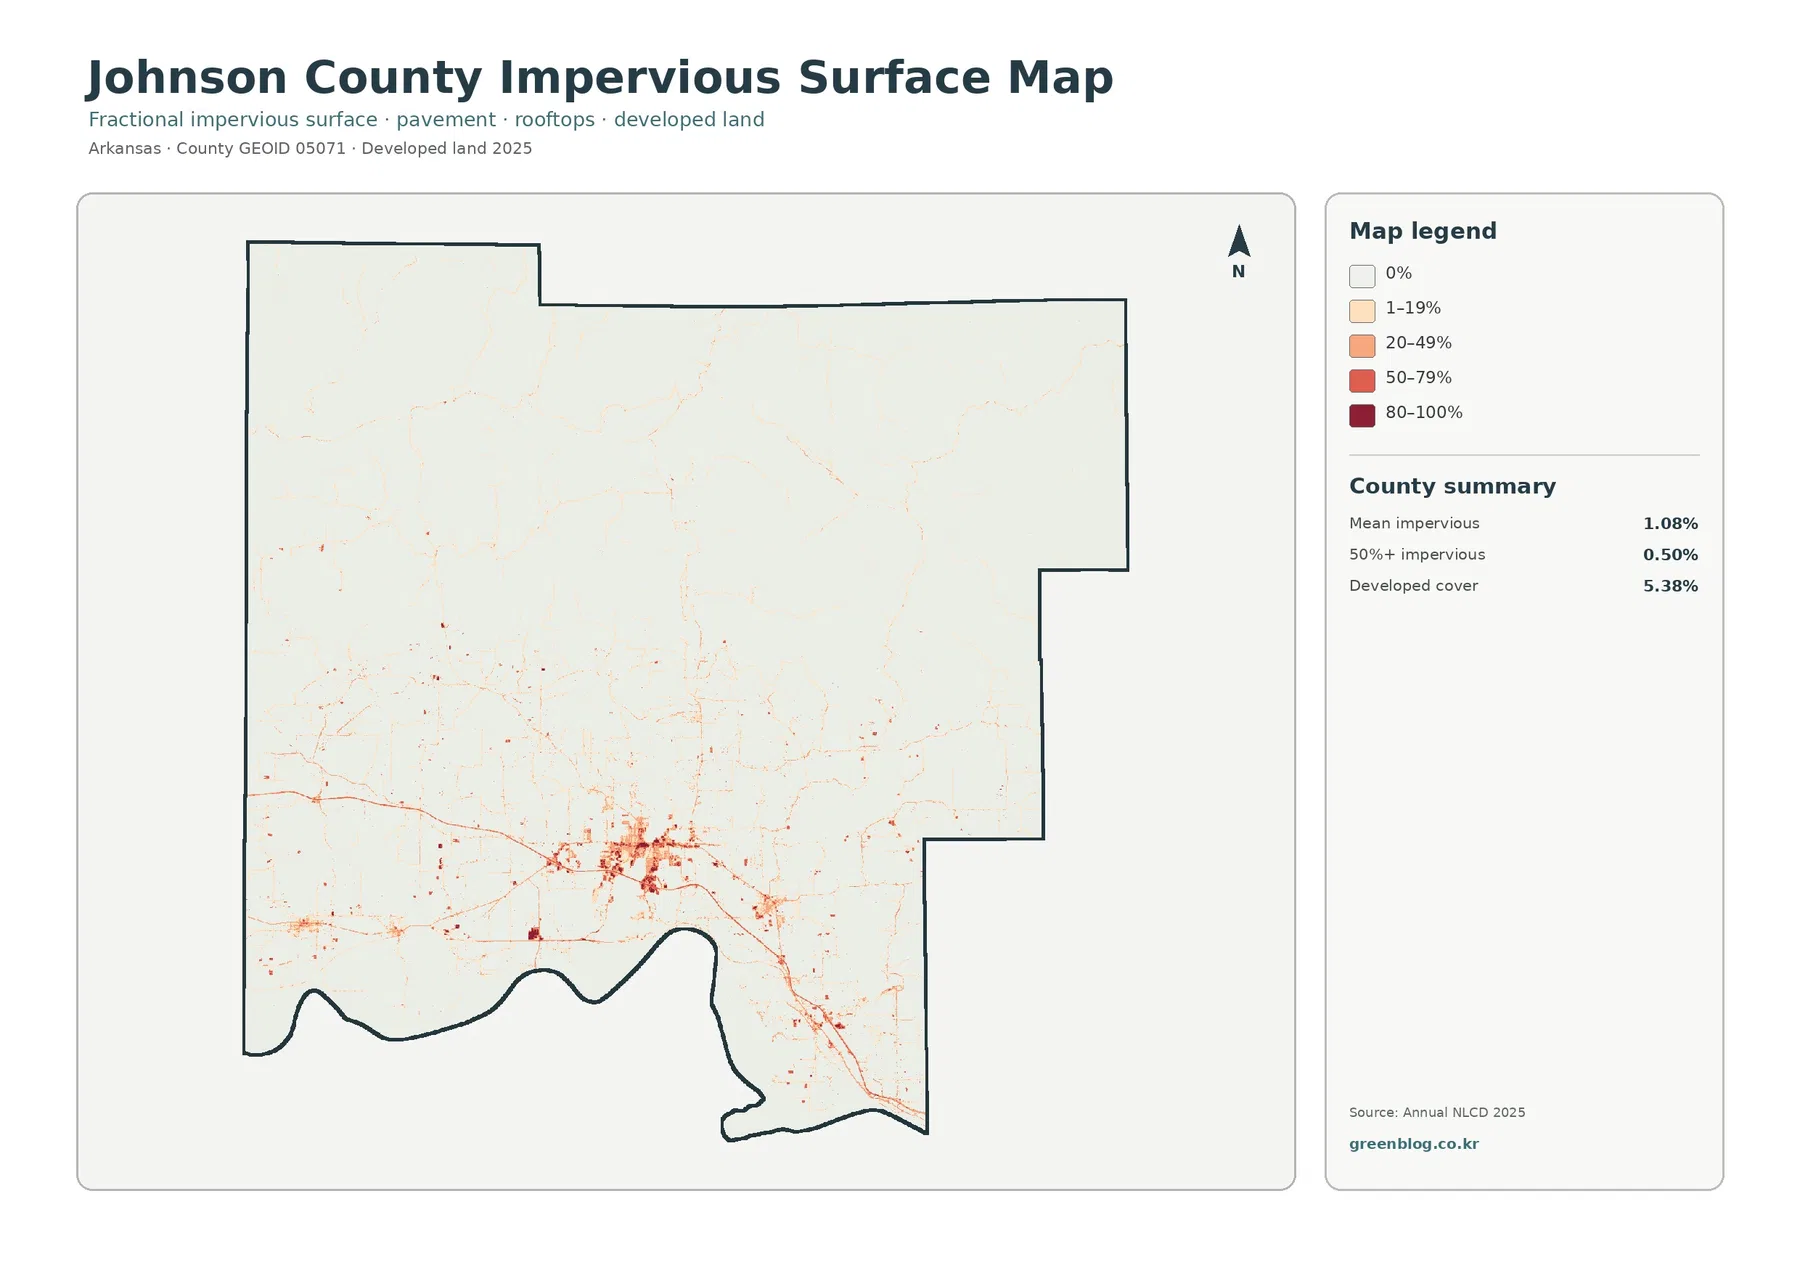
Impervious surface means pavement, rooftops, parking areas, and other surfaces that do not readily absorb rainfall. Johnson County has a mean impervious value of 1.08%, and only 0.50% of the county is summarized as having impervious cover of 50% or more. Those numbers are much lower than the 5.38% developed land-cover share because a developed classification can contain lawns, trees, bare soil, and other permeable surfaces along with roads and buildings.
The map removes most of the visual competition from forest and agriculture, making the southern built pattern easier to see. The strongest impervious colors cluster in the south-central area associated with the county’s principal developed center, while fine lines extend west, east, and southeast. Isolated spots appear elsewhere in the southern half. Northern Johnson County is comparatively pale, reinforcing the current land-cover map’s picture of a largely forested upland area.
This view works well in a stormwater or built-environment presentation because it separates hard surface from the broader developed class. It should not be presented as a flood-risk map. Flooding depends on terrain, rainfall, soil, drainage, channel conditions, and many other factors that are not shown here. The impervious layer provides one background variable, not a complete hazard assessment.
Forest and farmland become easier to compare when development is simplified
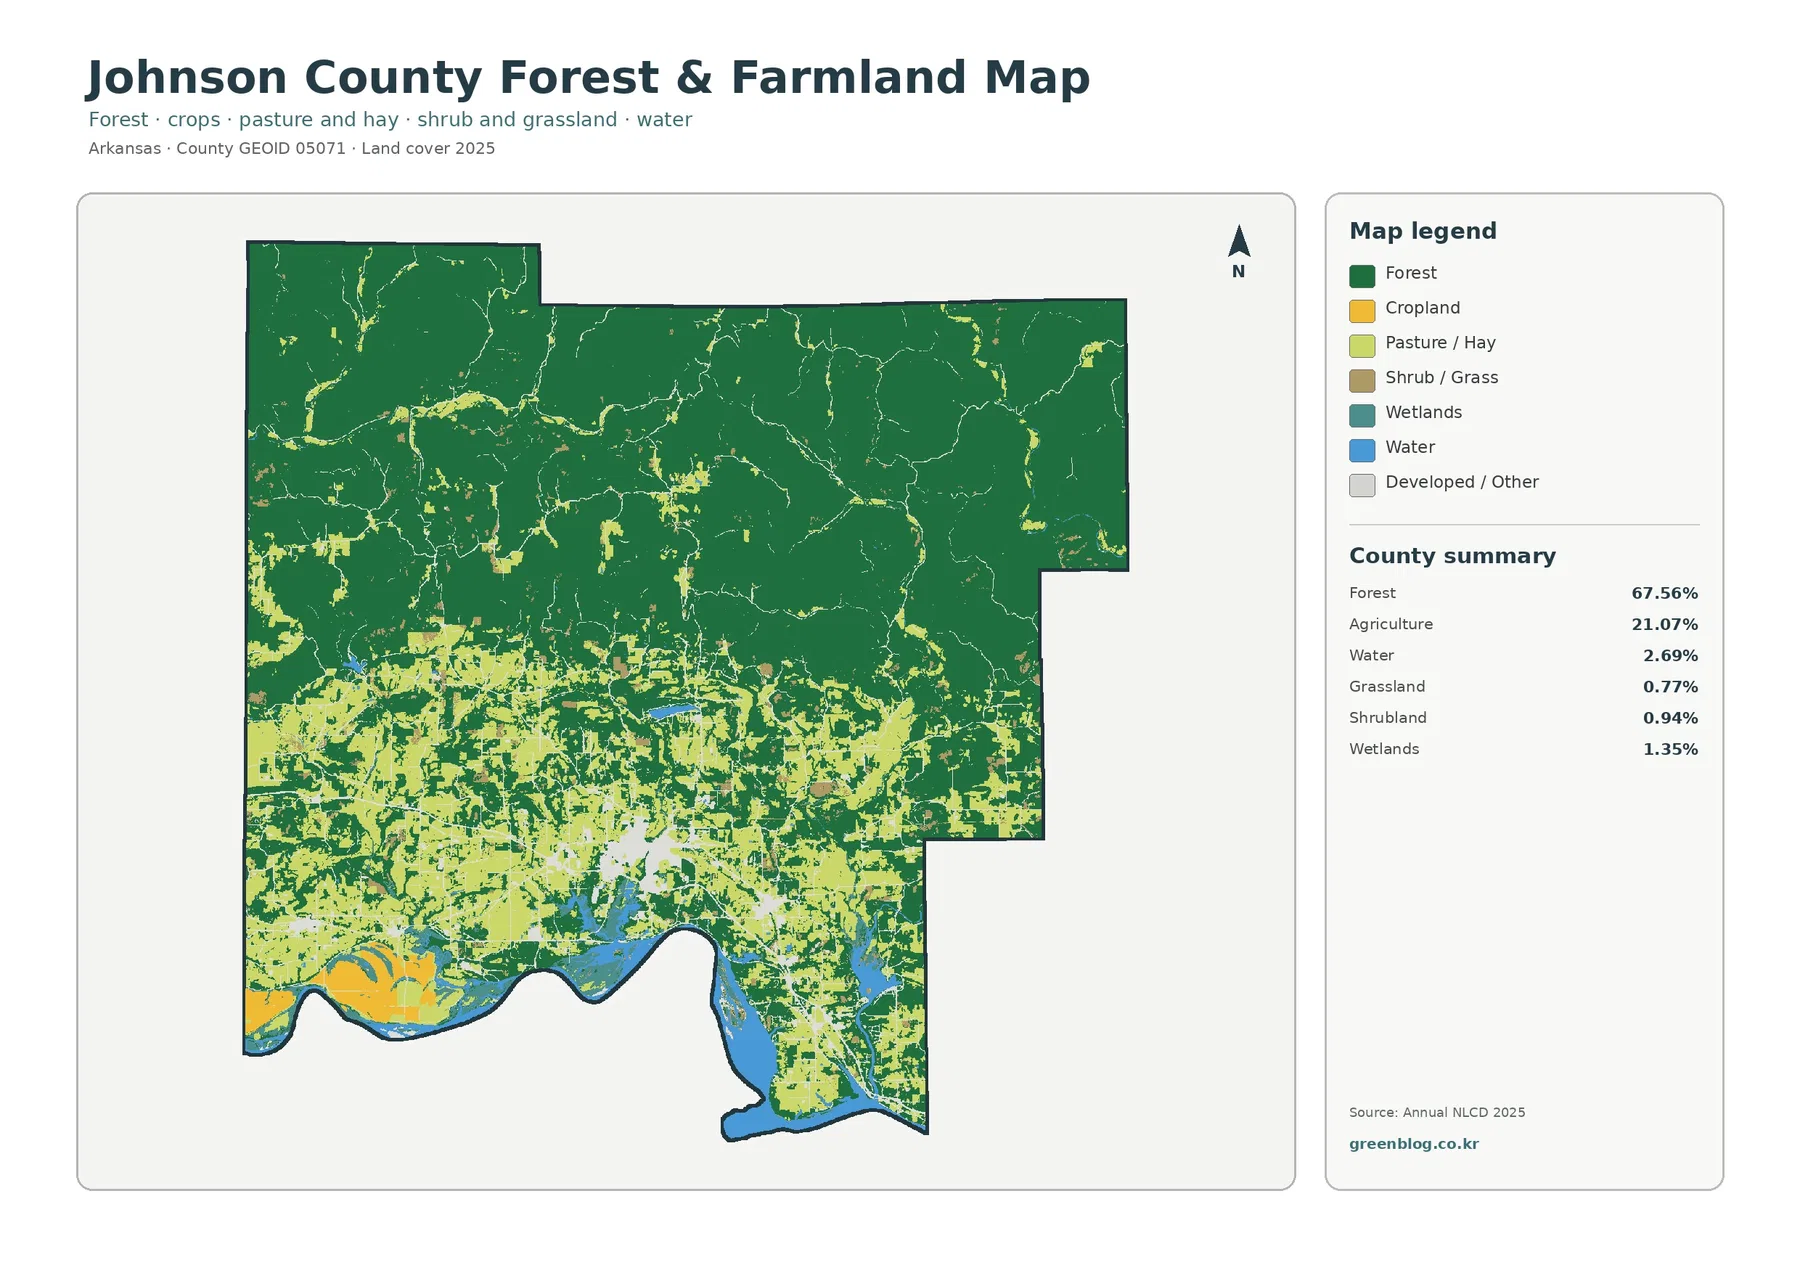
The forest-and-farmland view is useful when the question is rural cover rather than urban detail. It retains the 67.56% forest share and the 21.07% combined agriculture share while simplifying developed and other surfaces. Dark green dominates the north. In the south, cropland and pasture/hay colors become more frequent, producing a patchwork of working land, forest remnants, water, wetlands, and simplified developed areas.
The legend separates cropland from pasture/hay, but the county summary supplied with the map reports agriculture as a combined 21.07%. No verified percentage for each agricultural subtype is provided in the package, so it would be misleading to invent one. The same principle applies when comparing the map with an agricultural census: a remote-sensing class and a farm-statistics category can describe related landscapes while measuring different things.
The 1985–2025 map is a class comparison, not a complete history
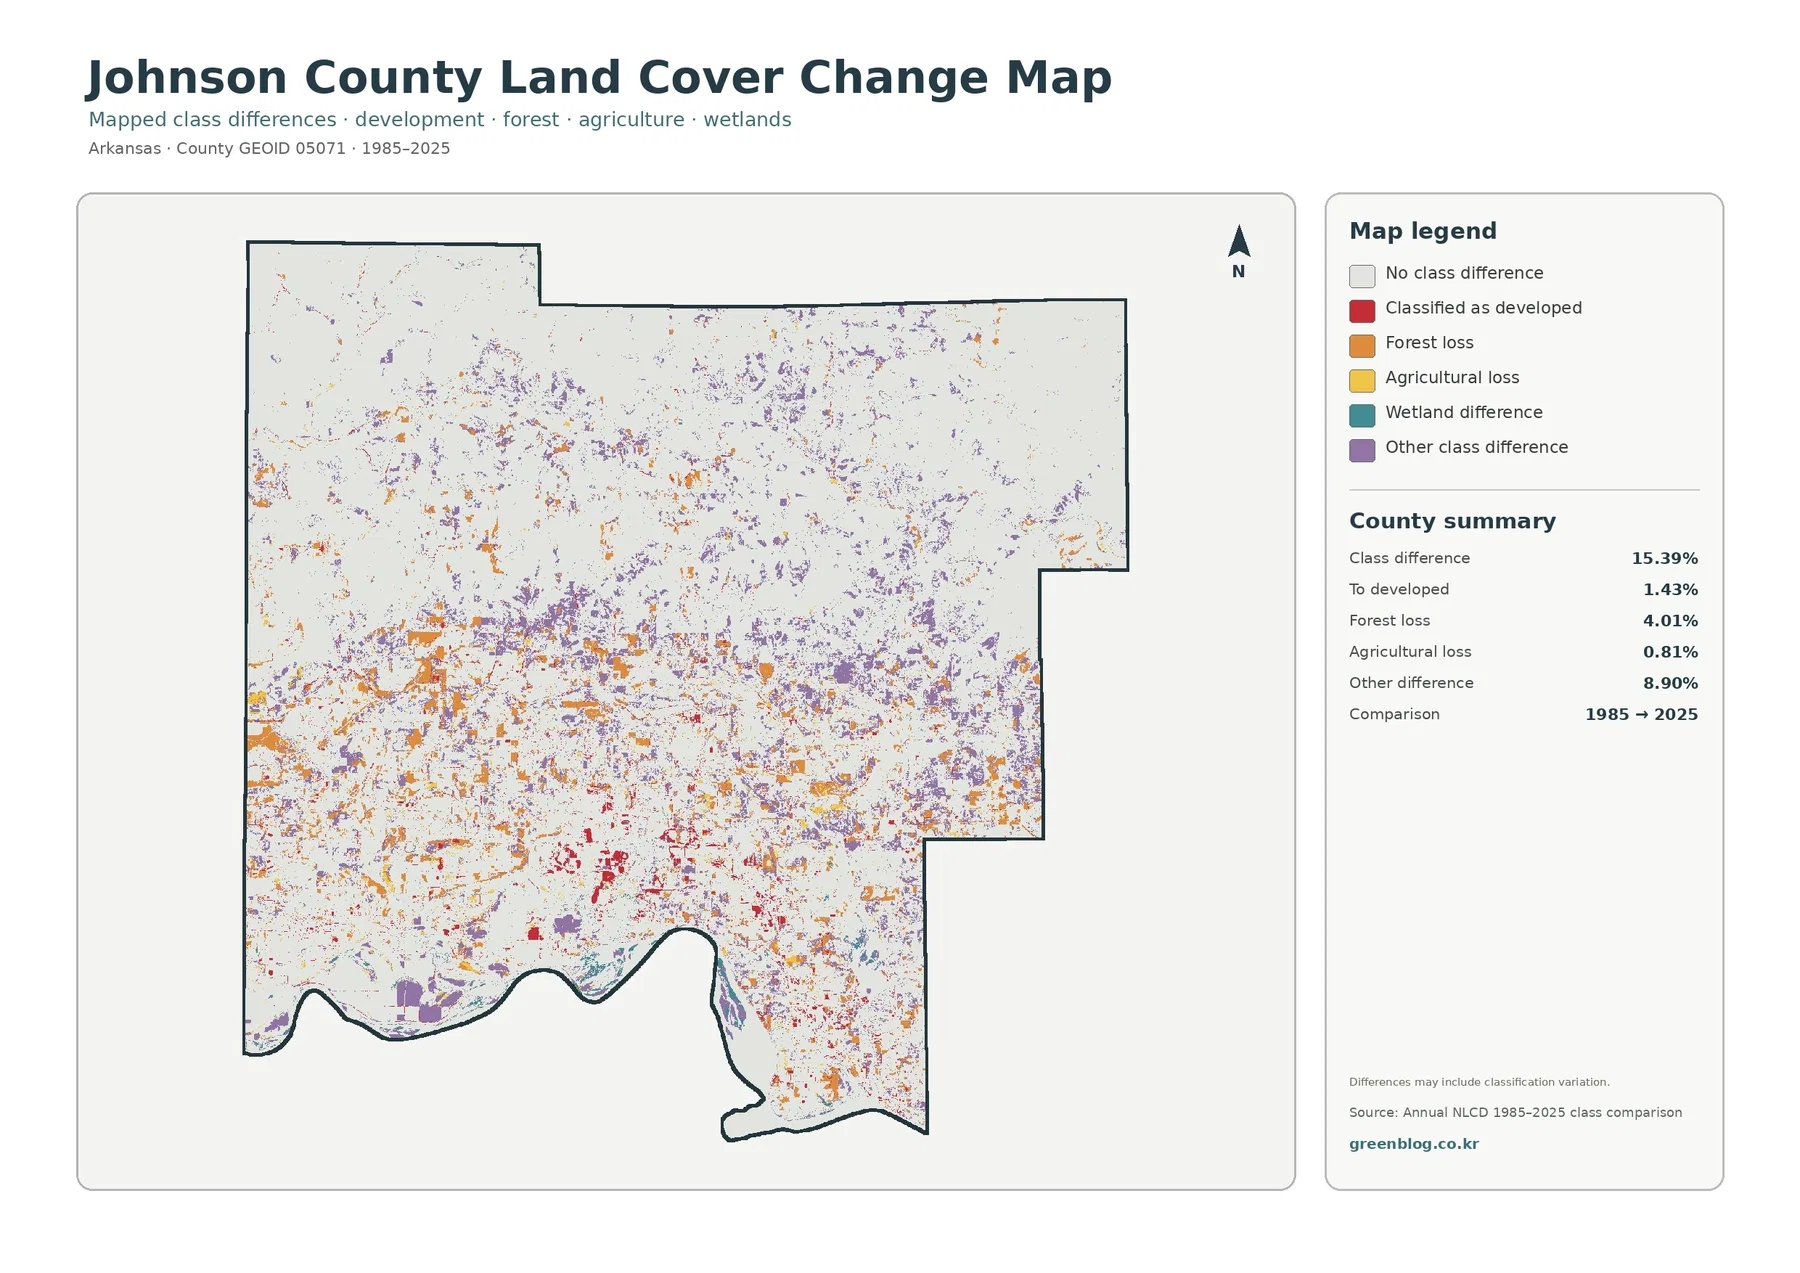
The two-date comparison marks 15.39% of Johnson County as having a different class in 2025 than in 1985. The summary identifies 1.43% as classified to developed, 4.01% as forest loss, 0.81% as agricultural loss, and 8.90% as other difference. Wetland difference has its own legend color, but the map does not provide a separate verified percentage for that category, so no additional number should be inferred.
Differences are more visually concentrated across the southern half, although scattered changes also appear throughout the forested north. Red developed-change patches are most noticeable around the main southern developed concentration and along smaller built corridors. Orange forest-loss patches and purple other-difference cells occur in many separate clusters. The wide spread of the “other difference” category is a reminder that the total 15.39% cannot be reduced to one story about development or forest clearing.
A cell labeled as forest loss means the later classification is not forest where the earlier one was forest; it does not identify the cause. Timber harvest, conversion, disturbance, regrowth stage, or classification variation could all require further investigation. Agricultural loss is similarly a class transition, not a direct measure of farm income, farm ownership, or total agricultural production. Cause-and-effect claims need aerial imagery, local records, or more detailed time-series data.
Choosing the right map for a Johnson County question
Use the impervious map when the topic is the built environment. It answers a narrower question than the developed class by showing where hard surfaces are concentrated. For the main southern developed area, the contrast between the general map and the impervious map is especially useful: one outlines the broader developed class, while the other shows that the densest hard surfaces occupy only part of it.
Use the 1985–2025 comparison only when the time dimension matters. A location that is currently forested can still contain mapped change, and a current developed area is not automatically a place that changed to developed during the comparison interval. Keeping current condition and two-date difference in separate panels prevents viewers from treating them as the same measurement.
Download the original map set and use it at the right scale
The ZIP contains the four original supplied JPG maps. The package records each JPG at 2480×1754 pixels. The WebP images embedded in the article are lighter page previews; the JPG files are the better choice when you want the original supplied image for a slide, handout, local reference sheet, or side-by-side comparison.
Reading limits that matter before using the maps
Land cover describes the physical surface assigned by a remote-sensing classification—forest, agriculture, water, wetlands, developed cover, and related classes. It does not show legal zoning, land ownership, parcel boundaries, building permits, or what a property may legally be used for. A cell classified as agriculture is not proof that the parcel is legally restricted to farming, and a developed cell does not identify the property owner or building type.
Annual NLCD is raster data. At a commonly used 30-meter land-cover scale, one grid cell can contain a road edge, trees, grass, a rooftop, and part of a field or water feature. The classification assigns a representative class, which means narrow features and boundaries may look simplified or slightly displaced. That mixed-pixel effect is one reason the county maps should not be treated as survey plats.
The current maps use the supplied 2025 classification. Construction, vegetation change, agricultural shifts, restoration, or disturbance after that observation period may not appear. The change view compares 1985 with 2025 and does not narrate every year in between. For a current site-specific question, recent imagery and local authoritative records should be checked alongside the countywide map.
Frequently Asked Questions
What is the largest 2025 land-cover class in Johnson County, Arkansas?
Forest is the largest class at 67.56% in the supplied county summary. Agriculture accounts for 21.07%, developed cover 5.38%, water 2.69%, and wetlands 1.35%, with forest especially extensive across the northern part of the county.
Why is developed cover 5.38% while mean impervious surface is only 1.08%?
Developed land can include permeable surfaces such as lawns, trees, and soil along with roofs and pavement. The impervious layer measures the hard surfaces that resist water infiltration, so it describes a narrower part of the developed landscape.
Does the 15.39% difference between 1985 and 2025 represent confirmed physical change in every highlighted cell?
No. Real landscape change can be part of the difference, but imagery, mixed pixels, and classification variation can also affect a two-date comparison. A site-specific explanation needs additional imagery or local records.
Map File Information
Johnson County Land Cover Map JPG Files
- Included Files: Use only the versions confirmed in the article and supplied images
- File Type: Use the confirmed download contents
- Intended Use: Printing, education, presentations, and map-based projects
Related Maps
- A Craighead County Arkansas Land Cover Map
- Arkansas County Arkansas Land Cover Map
- Ashley County Arkansas Land Cover Map
Sources and reference material
- MRLC Annual NLCD Data — official access to Annual NLCD datasets and related land-cover products.
- USGS Annual NLCD Land Cover Classification — official documentation for land-cover classes and how the classification is organized.
- U.S. Census Bureau TIGER/Line Shapefiles — official U.S. geographic boundary data used for county-scale mapping.
- Johnson County, Arkansas official website — county government information for Clarksville and other Johnson County cities and towns.
- Johnson County Cooperative Extension Service — University of Arkansas System information on local agriculture and natural-resource education.
- Arkansas Secretary of State Historical Report — state source describing Johnson County where Arkansas River valley farmland meets the southern Ozarks.
Green Map creates custom-edited map images using open geographic data sources such as geoBoundaries, Natural Earth, OpenStreetMap, and government open data.
These maps are edited visual materials, not raw data files, and are provided for education, documents, presentations, and graphic reference.