Independence County sits across a striking land-cover transition in north-central Arkansas. The 2025 map is almost evenly divided between forest and agriculture: forest accounts for 45.92% of the county, while agriculture covers 41.92%. Those totals do not occupy the same places. Larger forest blocks are most evident across the western and northern parts of the county, while broad agricultural cover becomes more continuous toward the east and southeast. The developed cluster around Batesville and the White River corridor break up that two-color pattern near the middle.
This page brings together four views of the same county: current land cover, forest and farmland, impervious surface, and mapped class changes from 1985 to 2025. The web maps make it easy to compare patterns on screen, and the four original JPG maps are available together in one ZIP for printing, class projects, presentations, or local reference.
Table of Contents
A county split between forest and agriculture
The county summary gives a useful starting point. Forest is the dominant class at 45.92%, but agriculture follows closely at 41.92%. Developed land makes up 6.41%, wetlands 2.57%, and open water 1.27%. Looking only at those percentages can make Independence County seem evenly mixed. The map shows a much more organized pattern, with broad wooded areas on one side, extensive farm cover on the other, and a concentrated developed center near the White River.
Dark green forest forms some of the largest continuous areas in the west, northwest, southwest, and parts of the north. Yellow agricultural cover becomes especially prominent on the eastern and southeastern side. Across the center, the two classes interlock in smaller patches, so the transition is gradual rather than a single sharp line. Red developed land is most concentrated in the central-western part of the county, with thinner traces extending outward along travel corridors and smaller settlements.
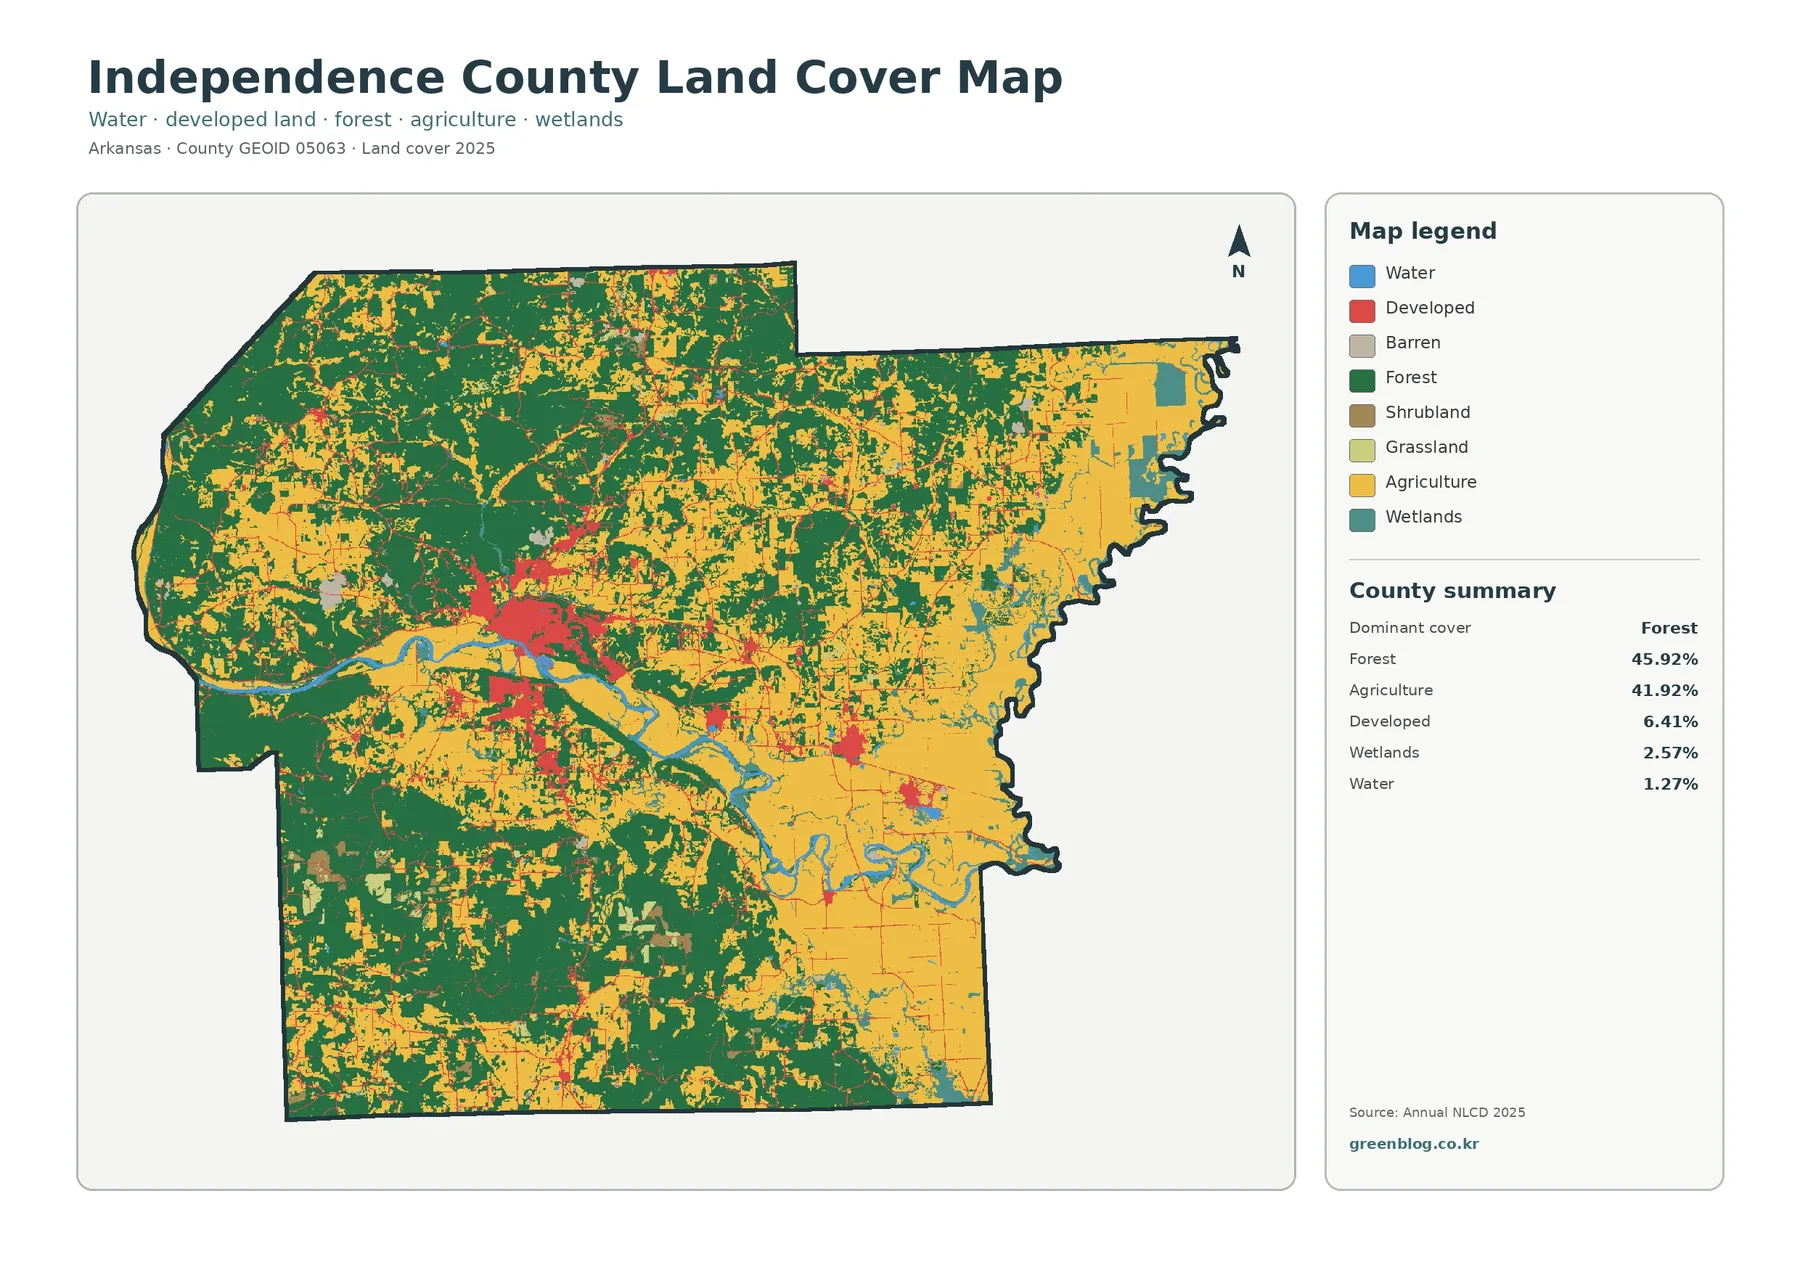
The White River provides an easy reference for reading the county. It crosses the middle of Independence County from west to east, passing Batesville before continuing toward flatter country. Water and wetland colors are visible along the river system and nearby low areas, while the largest developed concentration sits close to the river at Batesville. These mapped classes describe the surface seen in the land-cover data; they do not show zoning, parcel ownership, or whether land is legally available for development.
From Ozark foothills to lower farm country
The local setting helps explain why the map changes so noticeably across the county. The Association of Arkansas Counties describes most of Independence County as rolling hills and Ozark foothills, with river-delta farmland in the southeast. The Encyclopedia of Arkansas places the county where the White River moves out of the Ozark upland toward the Mississippi Alluvial Plain. That regional transition lines up with what is visible in the map: forest is more extensive across hillier western and northern areas, while agricultural cover becomes broader and more continuous toward the lower eastern and southeastern side.
Batesville, the county seat, sits on the White River. On the land-cover map, the county’s strongest developed patch appears in that same central-western area. Development becomes much lighter outside the Batesville area, where it is more often seen as narrow lines or small clusters surrounded by forest, pasture, cropland, or other open cover. The map therefore gives a useful visual distinction between the main urban center and the much larger rural portion of the county without pretending that the colored edge is a municipal boundary.
The eastern side tells a different story. Agricultural cover fills larger blocks there, particularly toward the southeast, while the western side contains more uninterrupted woodland. The middle of the county is more mixed, with fields, forest, water, wetlands, and developed land appearing in close proximity. This is why the countywide percentages should be read together with location: two classes can have similar totals but still shape very different parts of the landscape.
Forest and farmland in a closer view
The forest and farmland map removes some of the visual competition from the full land-cover legend and focuses attention on the county’s rural surface. Forest, cropland, pasture and hay, shrub or grass cover, wetlands, and water are separated so that the transition between wooded uplands and working agricultural land is easier to follow. Around the center and north, the result is not a simple forest-versus-cropland split. Pasture and other open land appear between larger green blocks, creating a more varied rural mosaic.
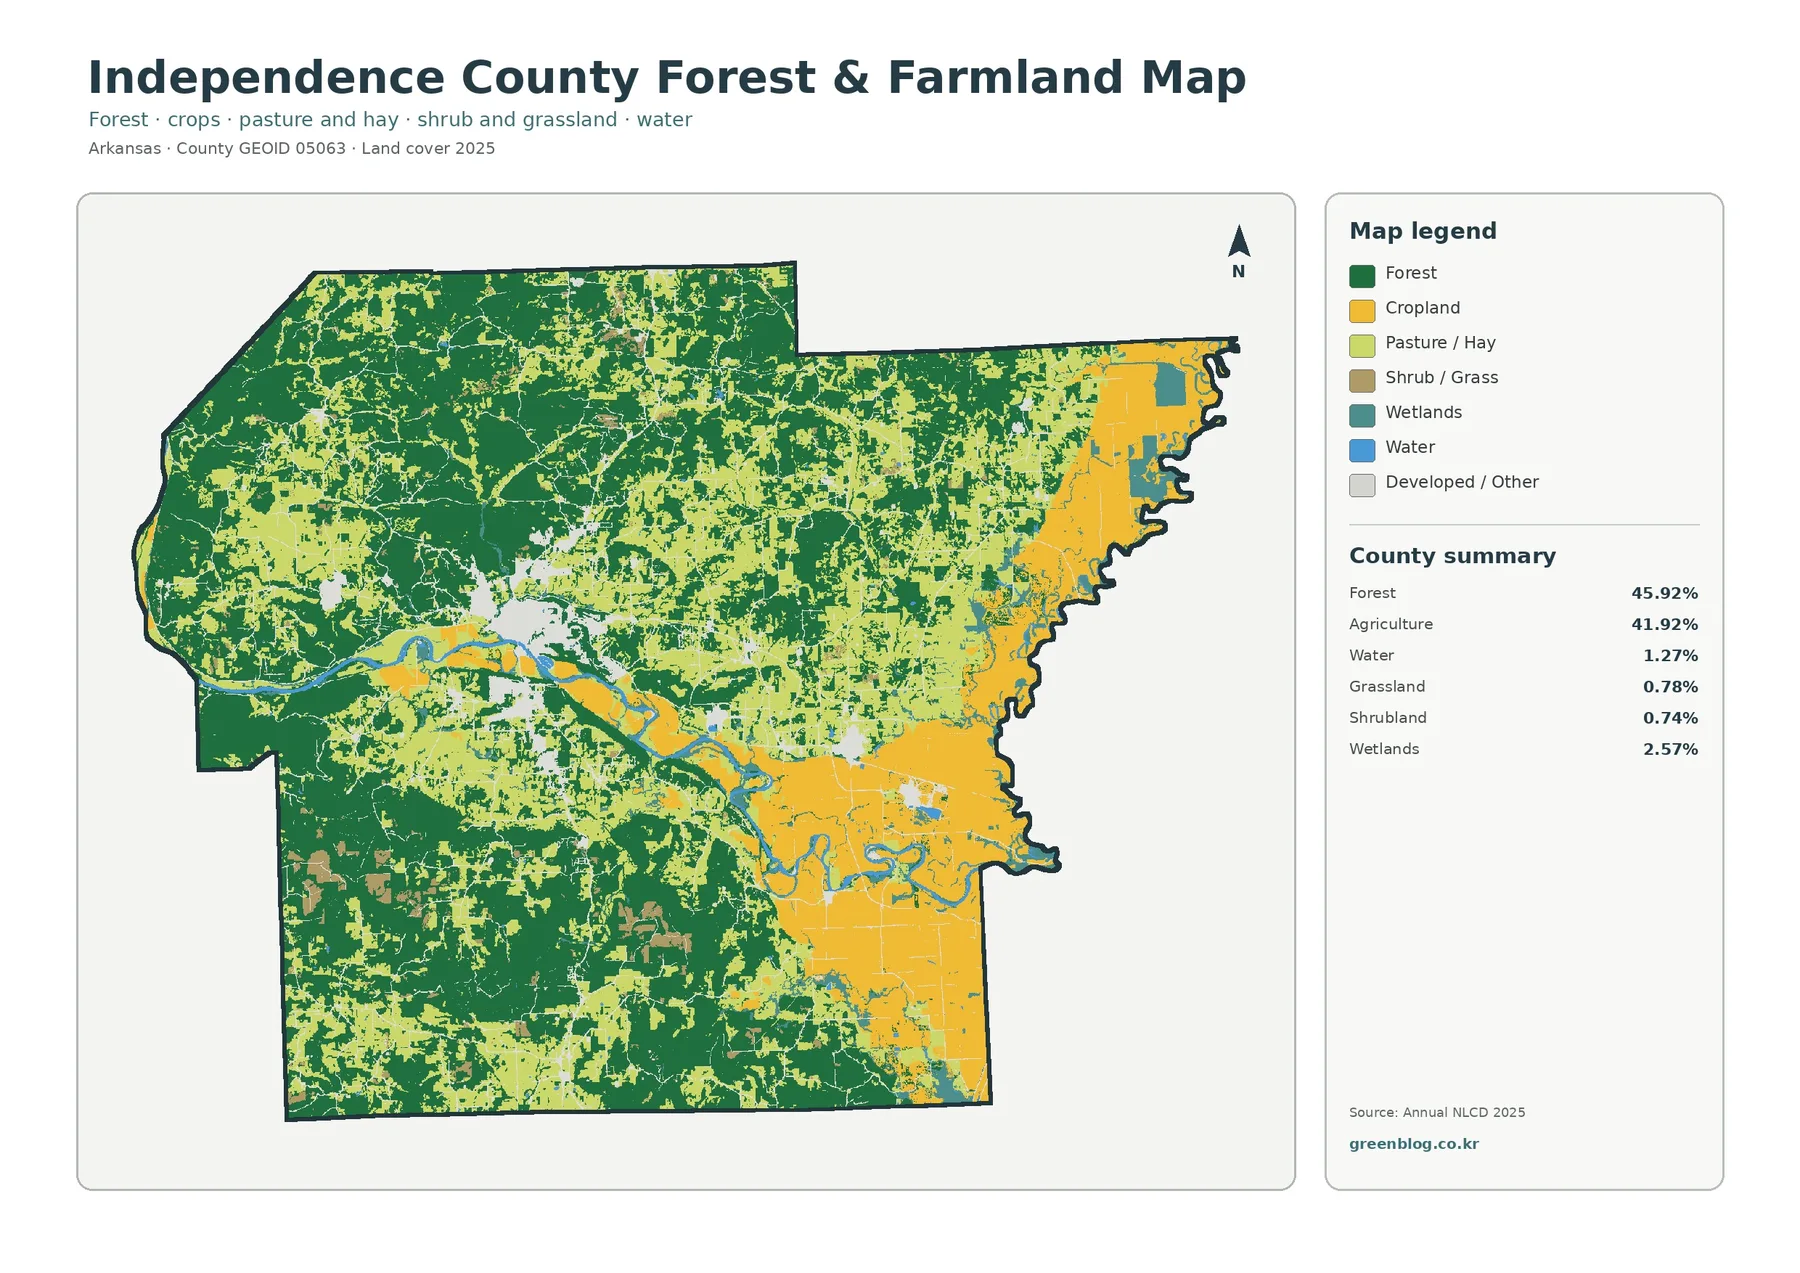
The summary again lists forest at 45.92% and agriculture at 41.92%. Wetlands account for 2.57%, water for 1.27%, grassland for 0.78%, and shrubland for 0.74%. Grass and shrub cover occupy small countywide shares, yet they matter locally because they often appear as narrow or scattered pieces between forest and agricultural areas. A countywide percentage can hide those small transitions, while the map shows exactly where the rural surface becomes more mixed.
Large agricultural blocks stand out in the east and southeast. In the west and southwest, forest remains much more continuous, with fields and open land appearing in smaller pieces. Near the White River, water and wetland colors add another layer to the pattern. Some low-lying areas are broken into a close mixture of agricultural cover, wetland, water, and developed or other land. That mixture is especially useful for anyone comparing upland forest with the river corridor rather than treating the entire county as one rural landscape.
“Agriculture” on a land-cover map should not be read as a legal farm boundary. It represents surface classes identified in the dataset, while pasture and hay can be mapped separately from cropland. Forest likewise says nothing about who owns the land. A single property may contain more than one mapped class, and neighboring properties may be combined visually at this scale. For parcel decisions, land-use rules, or ownership questions, a county assessor or other parcel-level source is needed.
Where impervious surface is concentrated
Impervious surface means pavement, rooftops, parking areas, and other surfaces that shed water instead of allowing it to soak into the ground. Independence County is mostly pale on this map, which makes the developed pattern around Batesville stand out immediately. The darkest and most closely packed cells are concentrated in the central-western urban area. Thin lines then extend away from that cluster along roads, with smaller pockets visible elsewhere in the county.
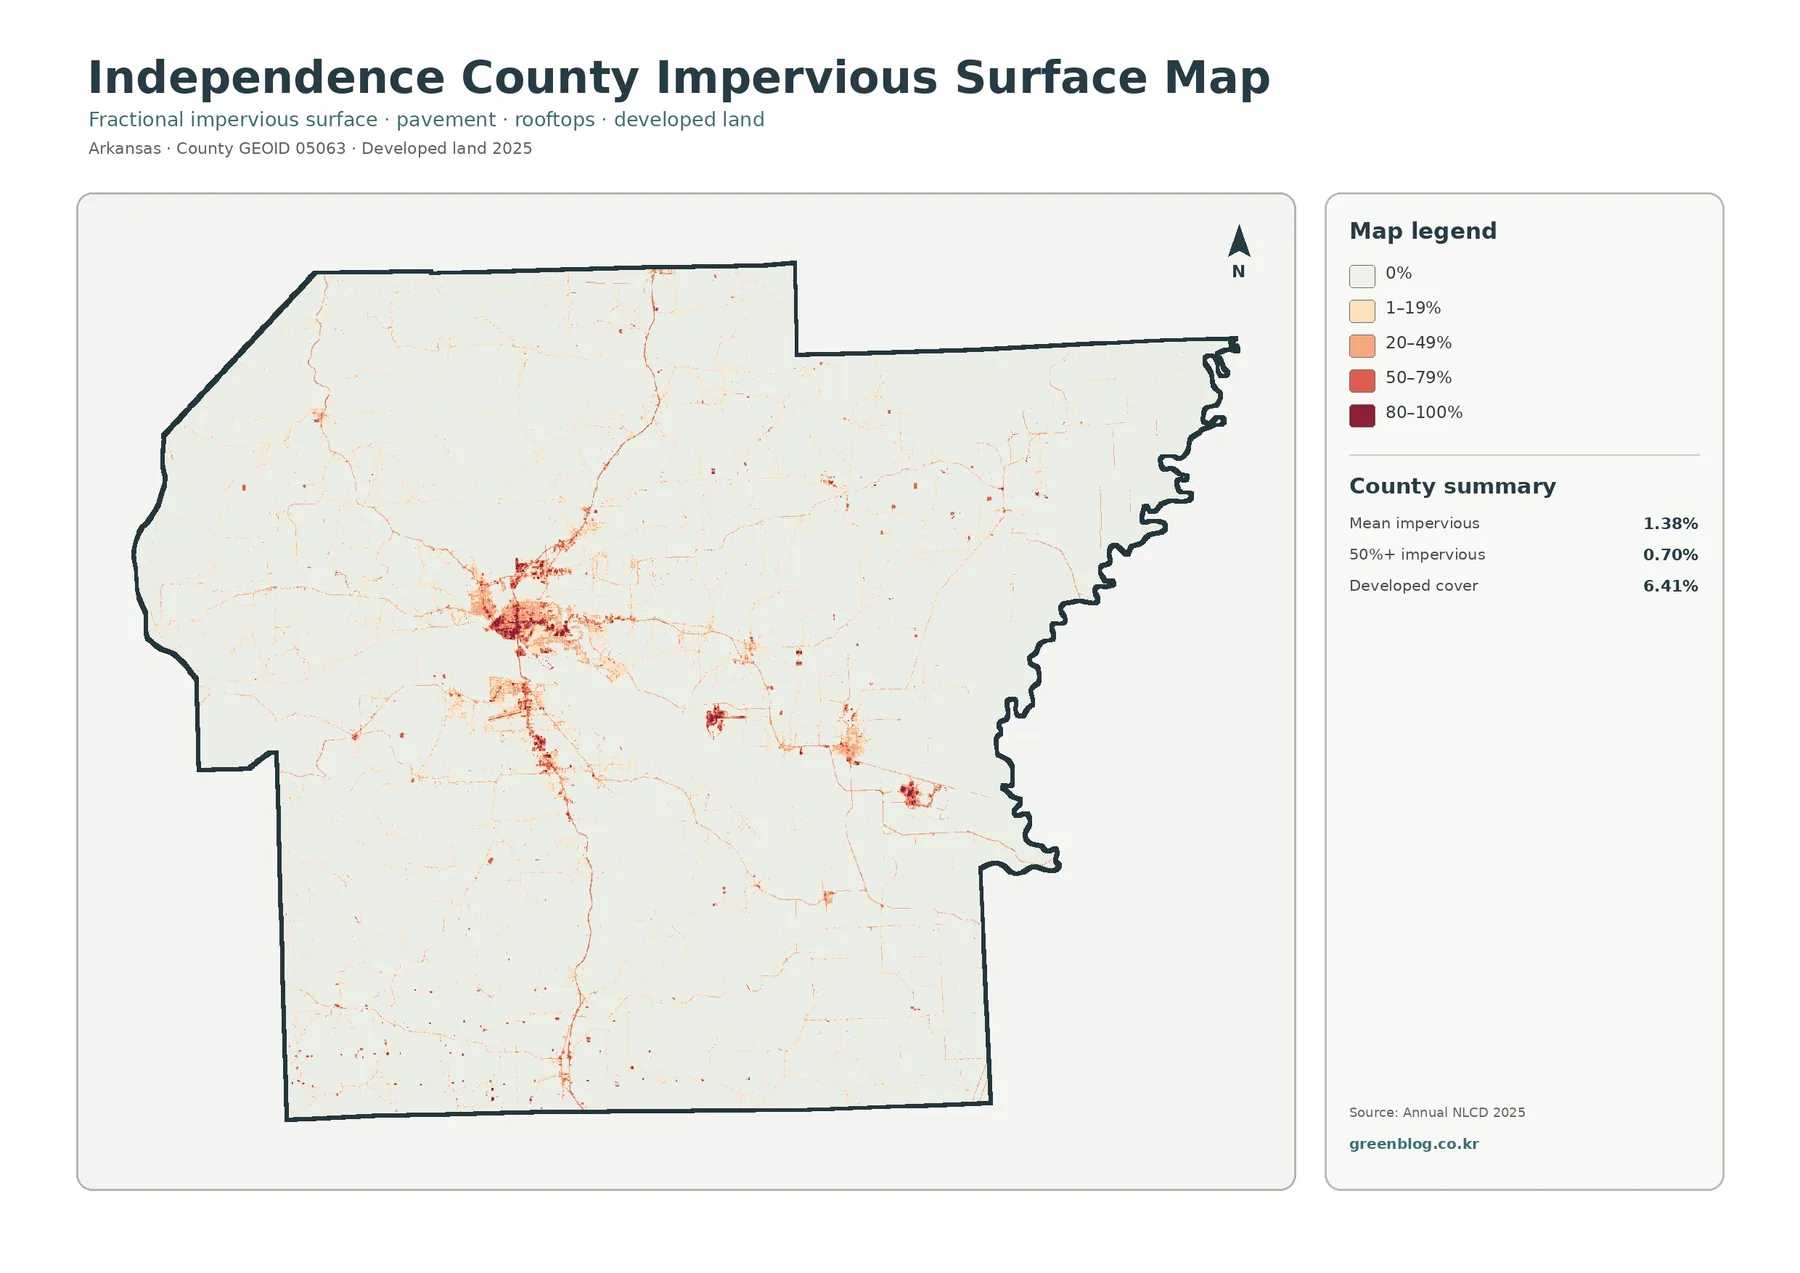
The county summary reports a mean impervious value of 1.38%. Areas with at least 50% impervious surface account for 0.70%, while developed cover on the general land-cover map is 6.41%. Those numbers measure different things. A developed land class can still contain lawns, trees, bare soil, or other surfaces that absorb water. The impervious layer is narrower: it estimates how much of the surface is actually sealed by pavement or structures.
That distinction makes the map useful for comparing the urban core with its surroundings. A location may be classified as developed on the general map but still have a relatively low impervious percentage if buildings and pavement are spread out. The Batesville area contains a stronger mix of higher-percentage cells, while much of eastern and southern Independence County remains lightly colored except for roads and small settlements. The pattern is clear without suggesting that every red cell represents the same type or intensity of development.
Impervious surface can be relevant to runoff studies, but this map alone cannot determine drainage performance or flood risk. Elevation, soil, storm drains, stream conditions, and rainfall all matter as well. For education and general planning context, the layer is excellent for showing where built surfaces cluster. For engineering, permitting, or site-level environmental work, it should be paired with more detailed local data.
What changed between 1985 and 2025
The change map compares land-cover classifications from 1985 and 2025. Most of the county remains in the light “no class difference” category, but colored cells are scattered across nearly every part of Independence County. Some of the denser change clusters appear around Batesville and in parts of the central-west, southwest, and southern half. Smaller changes are also spread through the agricultural east, so the map is not simply an urban-growth graphic.
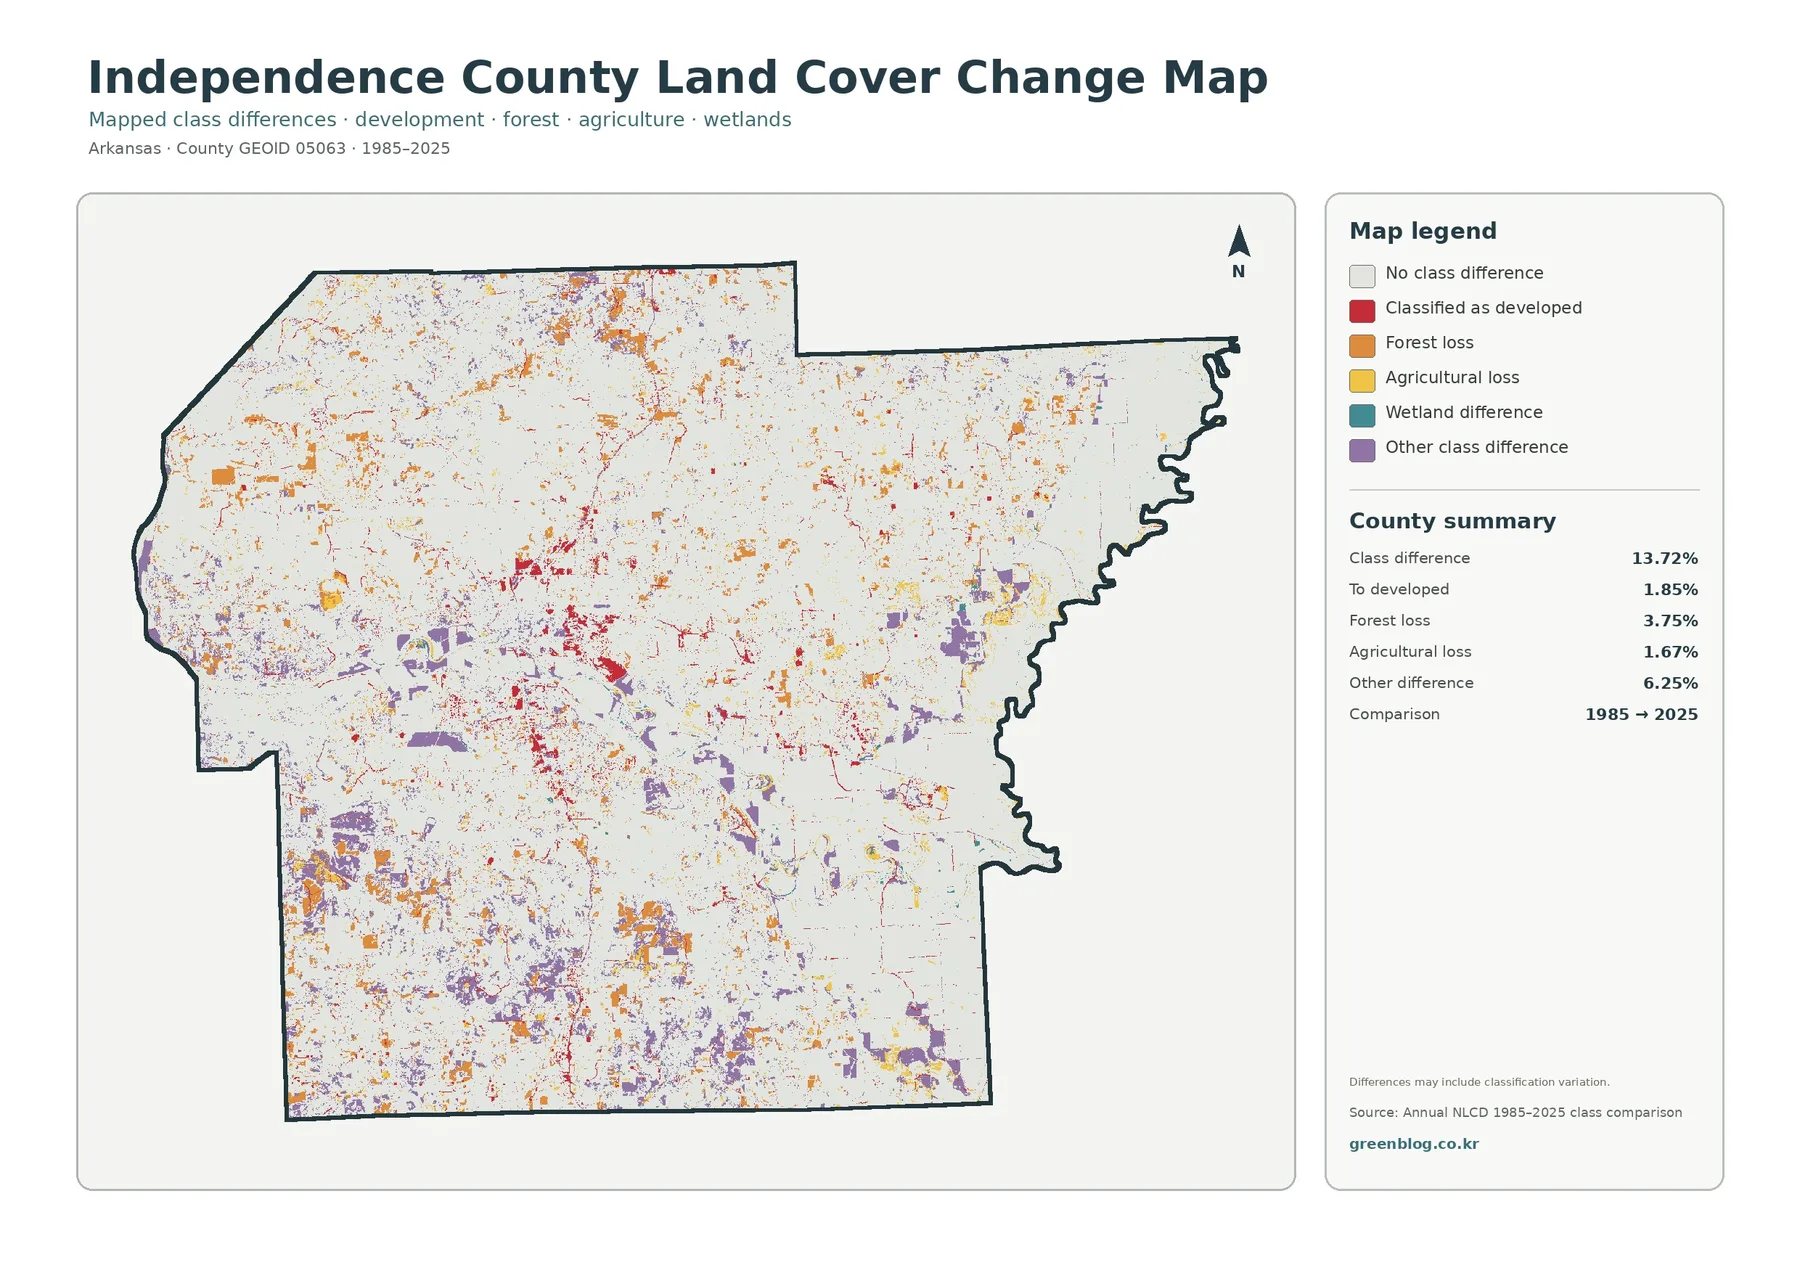
The summary lists class difference across 13.72% of the county. Within the displayed categories, 1.85% is marked as change to developed, 3.75% as forest loss, 1.67% as agricultural loss, and 6.25% as other difference. These values should not be added up and interpreted as a single kind of permanent land conversion. They describe differences between two classified maps, and the map itself notes that classification variation may be included.
Forest-loss cells should therefore not automatically be described as logging or new construction. A cell may have shifted to agriculture, grass, another open class, or a different category for reasons that require additional evidence. The same caution applies to agricultural loss. The “to developed” category is more specific, but it still does not provide the exact construction date or explain what project produced the change.
A practical way to use this map is to locate a change patch first and then compare that same area with the 2025 land-cover and impervious maps. Around Batesville, this makes it possible to see whether a changed location now aligns with developed cover and stronger impervious surface. In the rural west or east, the current map can show whether a changed cell now sits within forest, agriculture, wetland, or another class. That side-by-side reading is more informative than treating every colored patch as the same event.
How to compare the four maps efficiently
Start with the current land-cover map and identify four anchors: the wooded west and north, the agricultural east and southeast, the Batesville developed area, and the White River crossing the county. Once those broad locations are familiar, move to the forest and farmland map. The second view makes pasture, grass, wetlands, and water easier to distinguish, so rural areas that looked uniform in the first map become more detailed.
If the question is about the built environment, switch to the impervious layer before looking at change. It reveals which portions of the developed pattern contain the most pavement and rooftops and which parts are more lightly developed. Then compare the same locations with the 1985–2025 change map. This order keeps current conditions separate from long-term class differences and reduces the chance of assuming that every developed place is newly developed.
For rural questions, the forest and farmland map pairs well with the change layer. Broad farm cover in the east may contain scattered change cells, while broad woodland in the west can also contain mapped forest-loss or other differences. The four views complement one another because each emphasizes a different property of the same landscape. None of them needs to be treated as a complete substitute for the others.
Good uses for the map set
The general map works well in presentations, local overviews, and classroom projects because it summarizes the county in a single view. A student can use it to explain why the west looks more forested, why farmland is more extensive toward the east and southeast, and where the main developed area sits relative to the White River. The legend and county summary provide enough context for a short visual explanation without requiring GIS software.
The forest and farmland map is better suited to questions about rural land cover, habitat context, or the relationship between fields and woodland. The impervious map is useful when the focus is roads, rooftops, compact development, or the contrast between Batesville and less built-up parts of the county. The change map adds a time dimension, allowing a reader to identify places where the 1985 and 2025 classifications differ and decide where more detailed research may be worthwhile.
These maps can also serve as reference graphics for watershed discussions because the White River is easy to follow through the county. A reader can compare nearby wetland and agricultural cover, see where developed surfaces cluster, and then check whether mapped class changes occur in the same general area. The maps do not replace hydrologic models or site inspections, but they provide a clear starting picture for asking better questions about the landscape.
Download the Independence County JPG map set
The download contains four original JPG files: the general land-cover map, forest and farmland map, impervious and developed-land map, and the 1985–2025 land-cover change map. Keeping the four files together makes it easier to compare the same county in print, add selected maps to a report, or build a classroom handout without relying on screenshots from the web page.
When printing or placing a map in a document, keep the legend and summary panel visible. Cropping tightly around the county shape can remove the information needed to interpret colors or percentages. The change map especially needs its 1985–2025 comparison label, while the impervious map needs the percentage legend to distinguish lightly sealed surfaces from the darkest high-impervious cells.
Important limits when reading land-cover data
Land cover describes what appears to cover the ground, not how a parcel is zoned or who owns it. Forest, cropland, wetland, water, and developed classes are observations or classifications of surface condition. A property can contain several classes, and a mapped agricultural area is not automatically the same thing as a legal farm parcel. County assessor, planning, and deed records are the appropriate sources for parcel-level questions.
Annual NLCD is raster data, which means the landscape is represented by a grid of cells rather than exact parcel outlines. Narrow roads, small streams, isolated buildings, and complicated edges between forest and fields may therefore look generalized. A cell can also contain more than one surface type, creating what is commonly called a mixed pixel. The mapped class is useful at landscape scale but should not be treated as a surveyed boundary on the ground.
The current land-cover and impervious maps on this page represent 2025 conditions, while the change layer compares 1985 with 2025. A new road, building, timber harvest, crop rotation, or vegetation change after the mapped observation period may not appear. For decisions about a specific location, compare the map with current imagery and local records rather than assuming the displayed class is the latest site condition.
Frequently Asked Questions
What is the largest land-cover class in Independence County?
Forest is the largest 2025 class at 45.92%, followed closely by agriculture at 41.92%. The two classes are not evenly spread. Forest is more extensive in the west and north, while agricultural cover becomes broader toward the east and southeast.
Why is developed cover 6.41% when mean impervious surface is only 1.38%?
Developed cover is a broader land-cover category. It can include lawns, trees, soil, and other surfaces around buildings and roads. Impervious surface measures the portion that is actually sealed by pavement, rooftops, and similar materials, so the two percentages are expected to differ.
Does the 1985–2025 map prove why a land-cover change happened?
No. It shows where classifications differ between the two mapped years. Development, forestry, agriculture, vegetation shifts, or other real changes may contribute, but classification variation can also be present. A specific cause requires additional imagery, records, or field information.
Map File Information
Independence County Land Cover Maps
- Included Files: Use only the versions confirmed in the article and supplied images
- File Type: Use the confirmed download contents
- Intended Use: Printing, education, presentations, and map-based projects
Related Maps
- A Craighead County Arkansas Land Cover Map
- Arkansas County Arkansas Land Cover Map
- Ashley County Arkansas Land Cover Map
Sources and reference data
- MRLC Annual NLCD Data – official access point for Annual NLCD land-cover and related raster datasets.
- USGS Annual NLCD Land Cover Classification – descriptions of the land-cover classes used in Annual NLCD products.
- U.S. Census Bureau TIGER/Line Shapefiles – official geographic boundary source for county mapping.
- Independence County official website – county government information and the courthouse location in Batesville.
- Association of Arkansas Counties – Independence County – local geographic context describing the Ozark foothills, southeast farmland, and White River.
Green Map creates custom-edited map images using open geographic data sources such as geoBoundaries, Natural Earth, OpenStreetMap, and government open data.
These maps are edited visual materials, not raw data files, and are provided for education, documents, presentations, and graphic reference.