The Howard County Arkansas Land Cover Map shows a county that is more than half forest in 2025, yet its surface changes noticeably from north to south. Forest accounts for 50.69% of the mapped cover, followed by agriculture at 22.70%, shrubland at 8.63%, developed land at 6.64%, grassland at 4.81%, wetlands at 4.68%, and water at 1.29%. Broad wooded areas dominate the northern and central parts of the county, while agriculture becomes more extensive toward the southeast. Developed patches stand out around a few settlement areas even though they occupy a much smaller share of the county as a whole.
Four views are provided here: the general 2025 land-cover classification, a forest-and-farmland view, an impervious-surface view, and a 1985–2025 class-difference view. The original JPG versions can also be downloaded together in one ZIP archive. Land cover describes what is physically present on the ground as classified from remote-sensing data; it does not establish zoning, ownership, parcel boundaries, or whether a site can legally be developed.
Table of Contents
Forest leads the 2025 cover mix
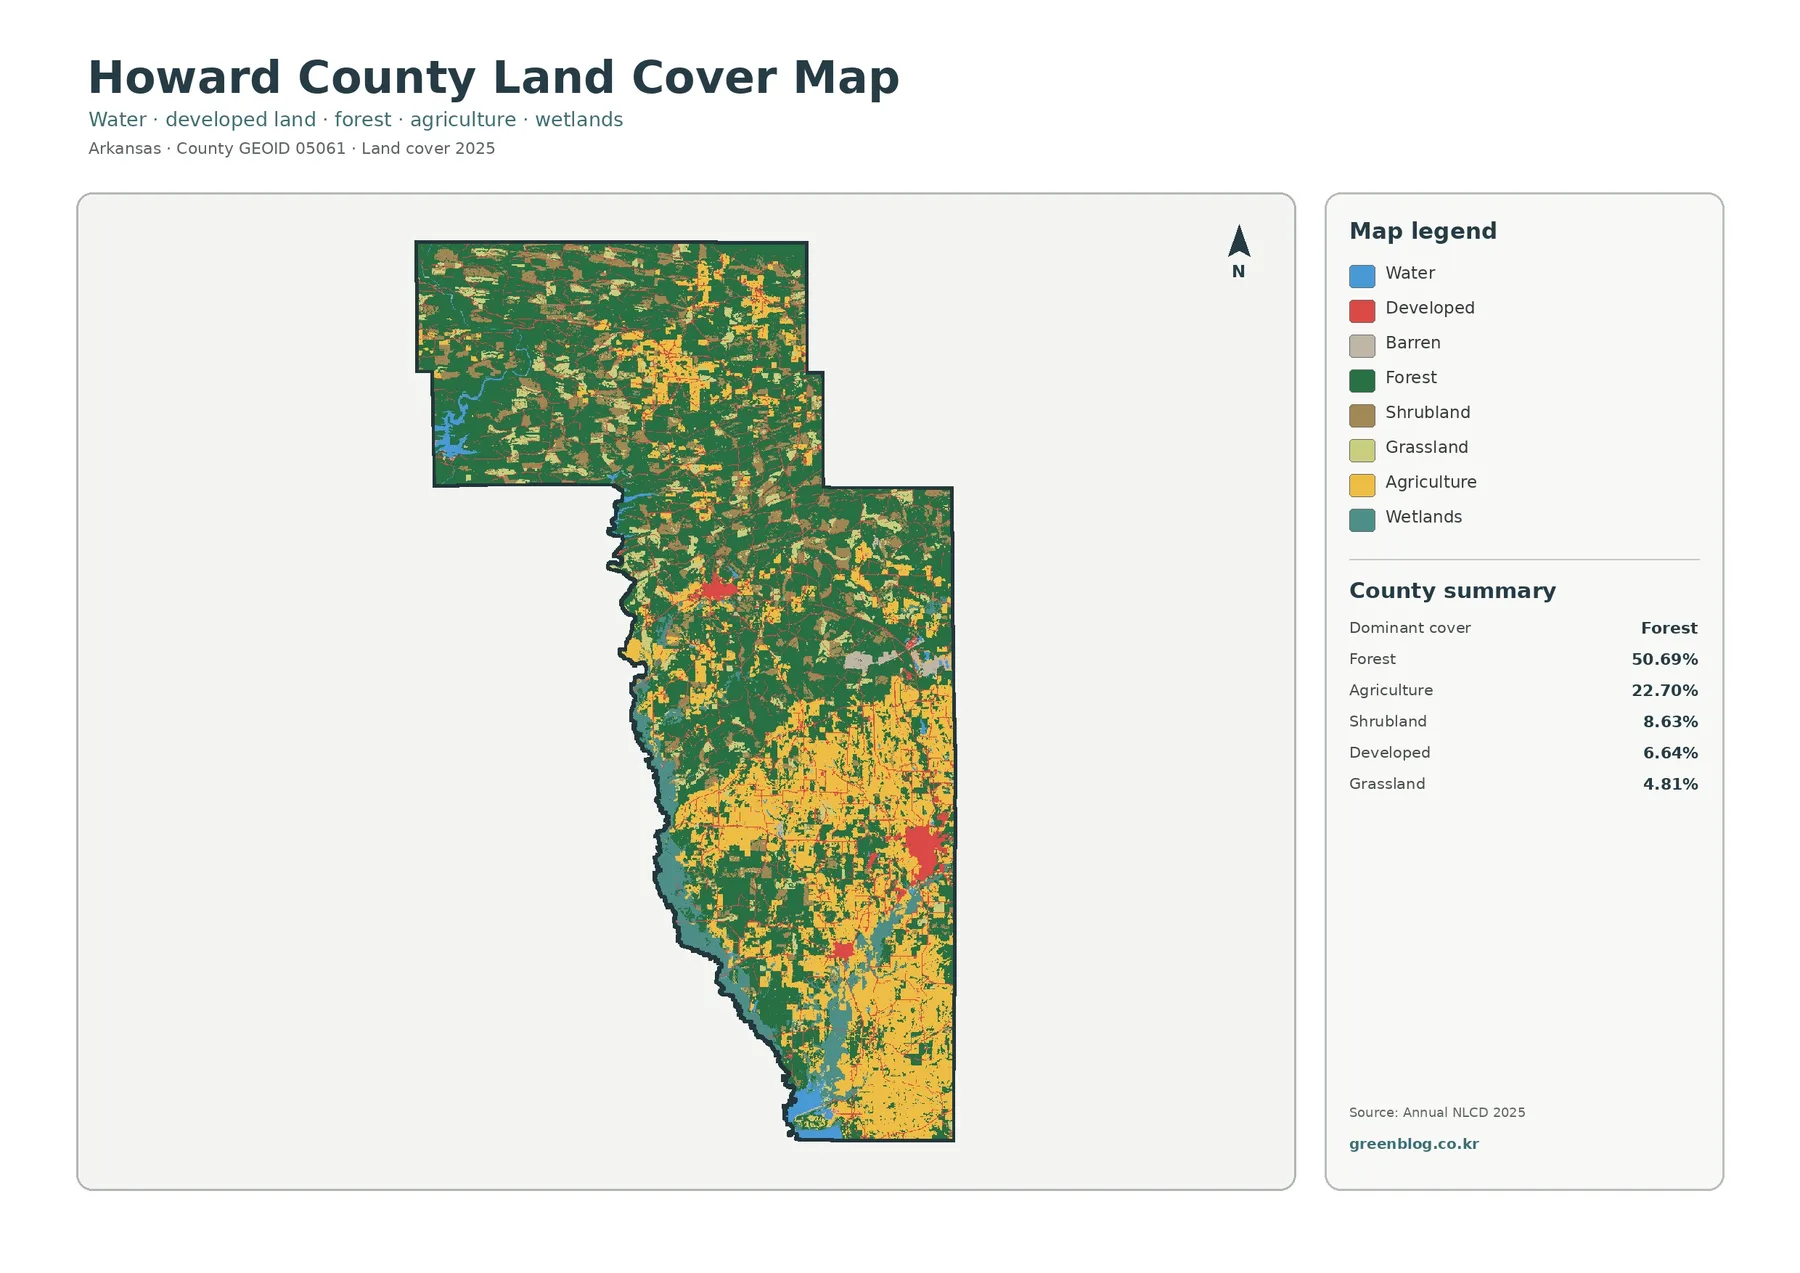
The 2025 summary makes the county’s broad pattern easy to see. Forest is the largest class at 50.69%, more than twice the 22.70% agricultural share. Shrubland contributes another 8.63%, and grassland 4.81%, so open or partly wooded cover is common between the larger forest and farming areas. Developed land represents 6.64%, wetlands 4.68%, and water 1.29%. A small barren component is present as well, but it is not one of the leading categories shown in the county summary.
Northern Howard County is especially wooded. Agricultural areas appear there as smaller breaks among large forest patches, whereas the southeast contains much broader fields and open cover. The central part of the county mixes forest, agriculture, shrubland, and developed land more closely. That transition is important because a countywide percentage alone cannot show where each class occurs; the same 50.69% forest figure looks very different when the distribution is considered.
The Association of Arkansas Counties describes Howard County as roughly 600 square miles and notes that farming has long been important to the local economy. It also identifies Nashville as the county seat. Those regional facts help place the mapped agricultural cover and larger settlement footprint in context, but the classification does not identify individual crops or determine whether a particular field is actively farmed in the current season.
Wooded north, more open southeast
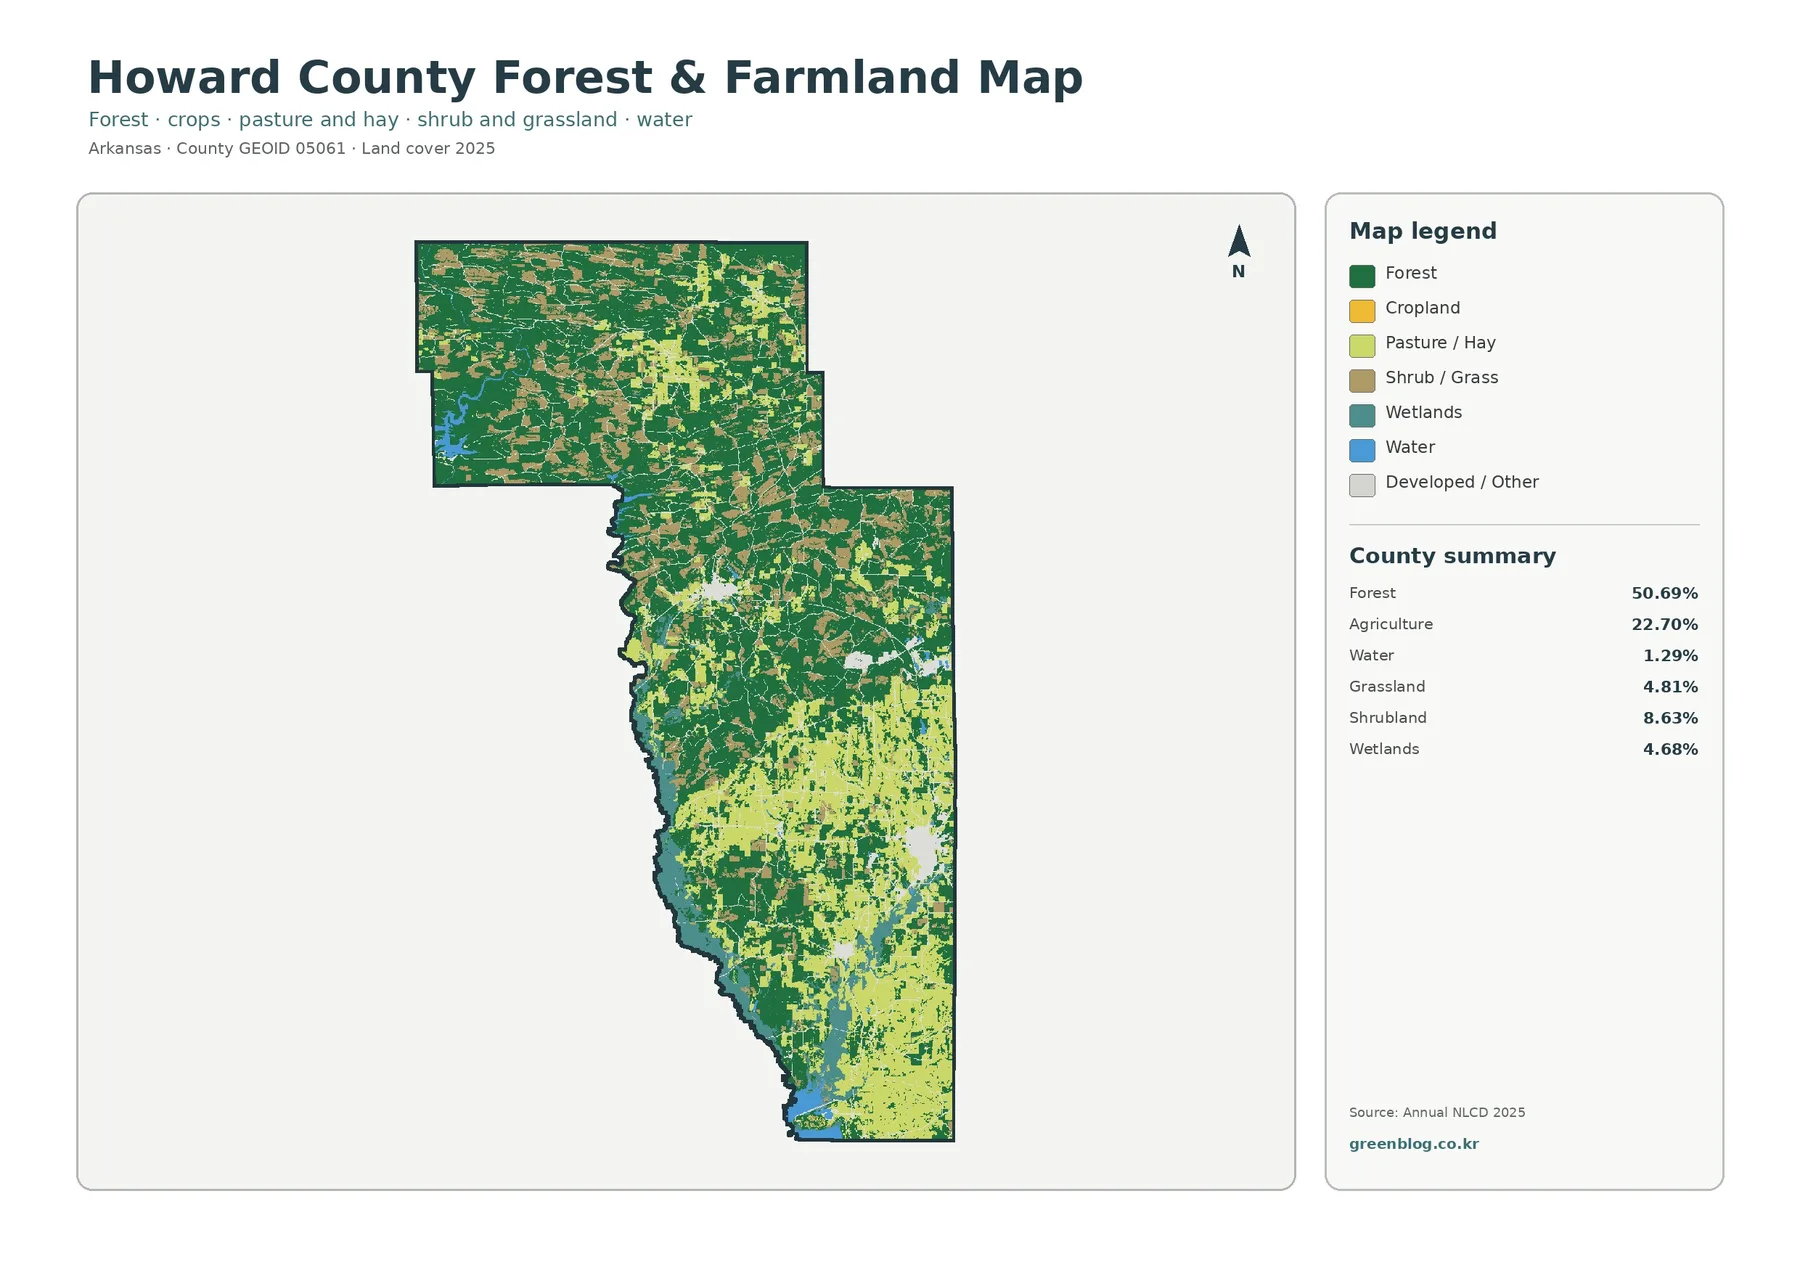
The forest-and-farmland view removes some of the complexity of the full classification and makes the county’s main contrast easier to follow. Forest still covers 50.69% and agriculture 22.70%, with shrubland at 8.63%, grassland at 4.81%, wetlands at 4.68%, and water at 1.29%. Dark green dominates much of the northern half, while cropland and pasture/hay colors become more common farther south and east.
Wetland and water colors appear along parts of the western side and near the southern end of the county. Their mapped distribution is useful when a project needs to compare upland forest with lower, wetter ground, although this page is not a flood-hazard or wetland-jurisdiction map. For environmental education, the simplified view is particularly useful because the major vegetation and agricultural groups can be compared without the developed classes drawing as much attention.
Annual NLCD is a 30-meter raster dataset, so its cells generalize the landscape. Narrow roads, small buildings, tiny ponds, mixed forest edges, and individual field boundaries may be simplified or assigned to the dominant nearby class. That scale is appropriate for countywide patterns and broad comparisons, but it should not be used as a substitute for a parcel survey, a timber-stand inventory, or a farm acreage measurement.
Where pavement and rooftops become visible
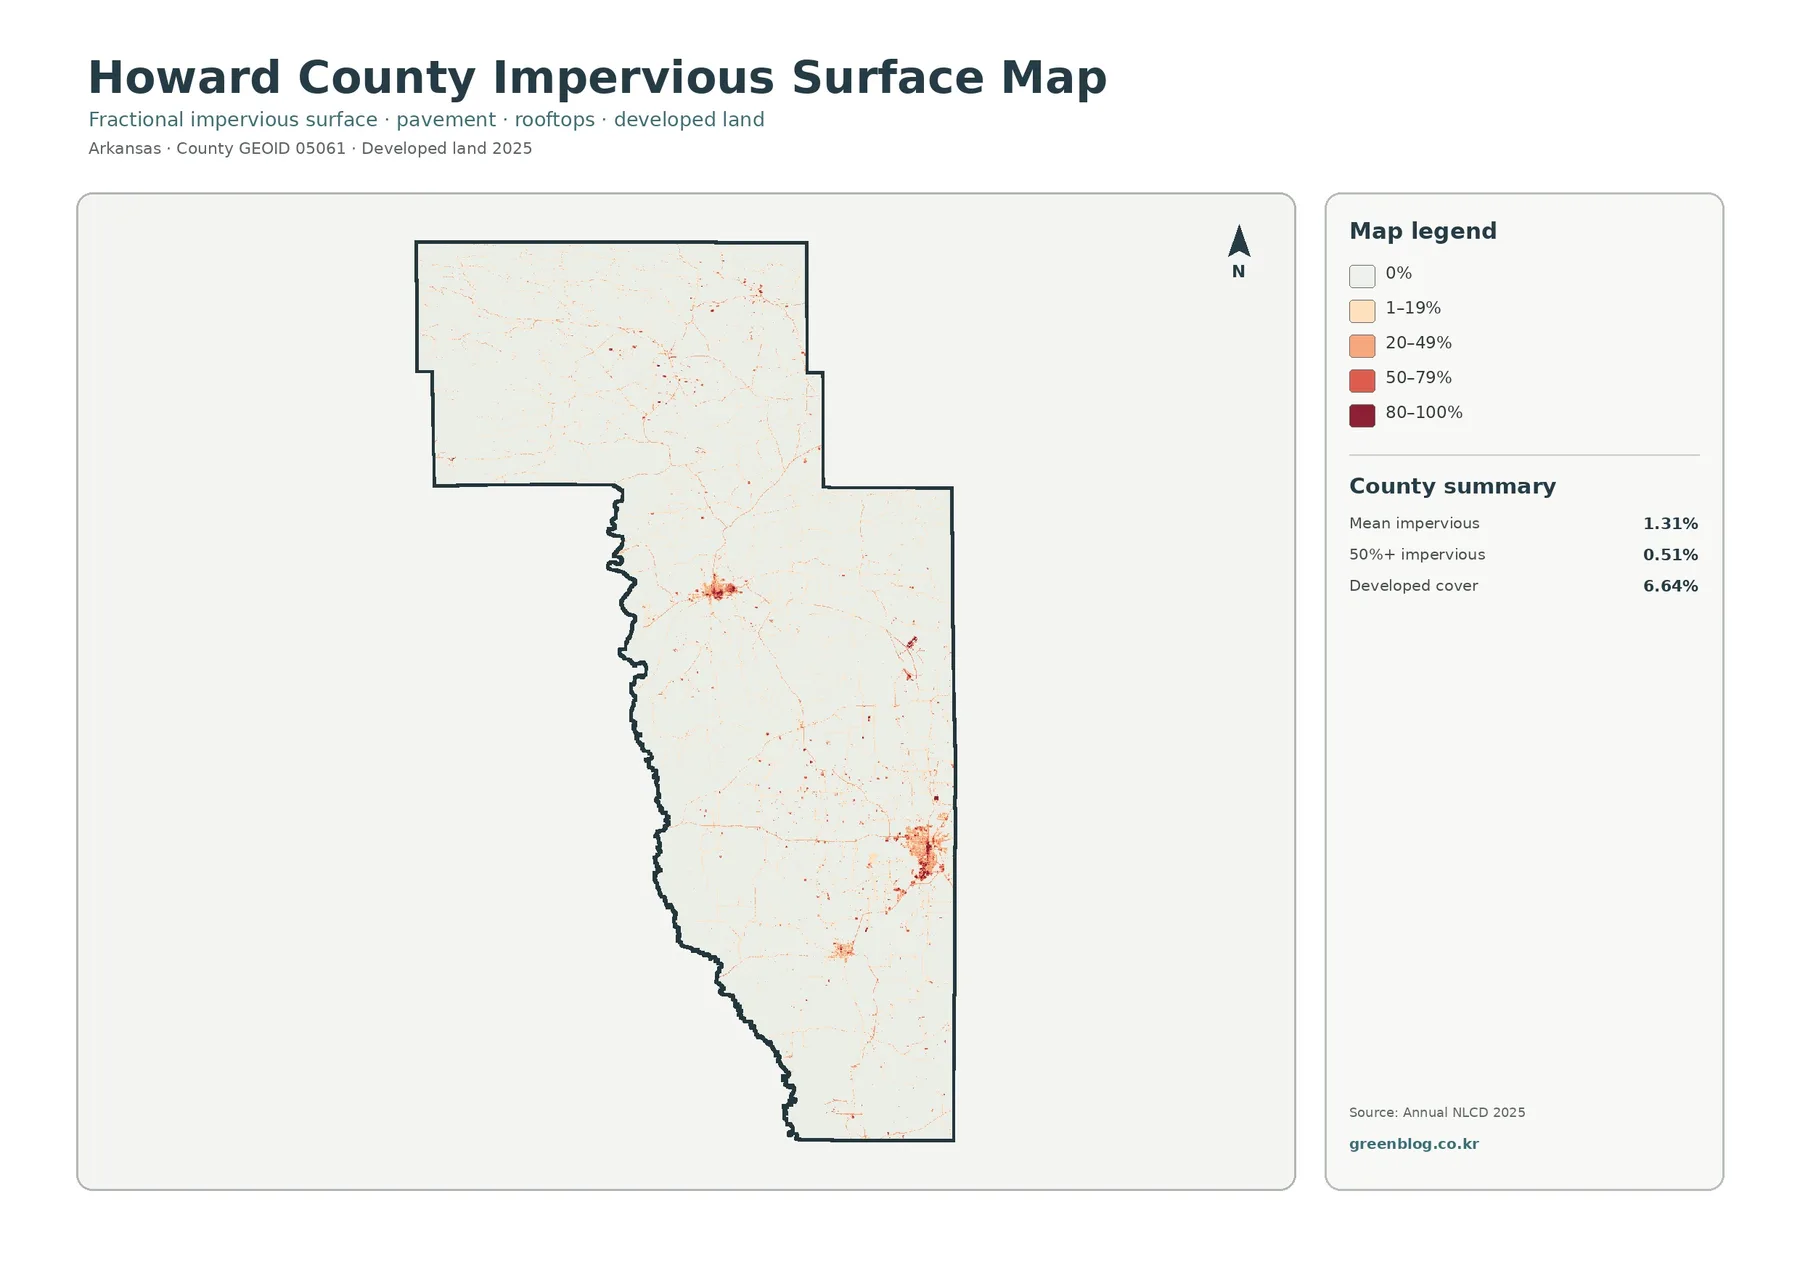
Howard County’s mean impervious surface is 1.31%, and only 0.51% of the county is mapped at 50% impervious or higher. The developed-land share is 6.64%. These numbers fit the visual impression: most of the county is light on the impervious map, while several compact clusters of orange and red identify places with more pavement, roofs, and other hard surfaces.
A noticeable concentration appears near the center of the county, and the largest cluster is in the southeast. With Nashville identified as the county seat by the Association of Arkansas Counties, the southeastern developed area provides a useful reference point for understanding how settlement occupies only part of a largely forested and agricultural county. Thin lines of slightly higher imperviousness also follow road routes through otherwise low-impervious areas.
Impervious percentage and the developed land-cover class should not be treated as interchangeable measurements. Developed land is a categorical cover class, while imperviousness estimates the fraction of a cell covered by hard surfaces such as pavement and rooftops. A residential cell can be classified as developed without being completely impervious, which is why the 6.64% developed share and the 1.31% mean impervious value answer different questions.
What the 1985–2025 comparison actually measures
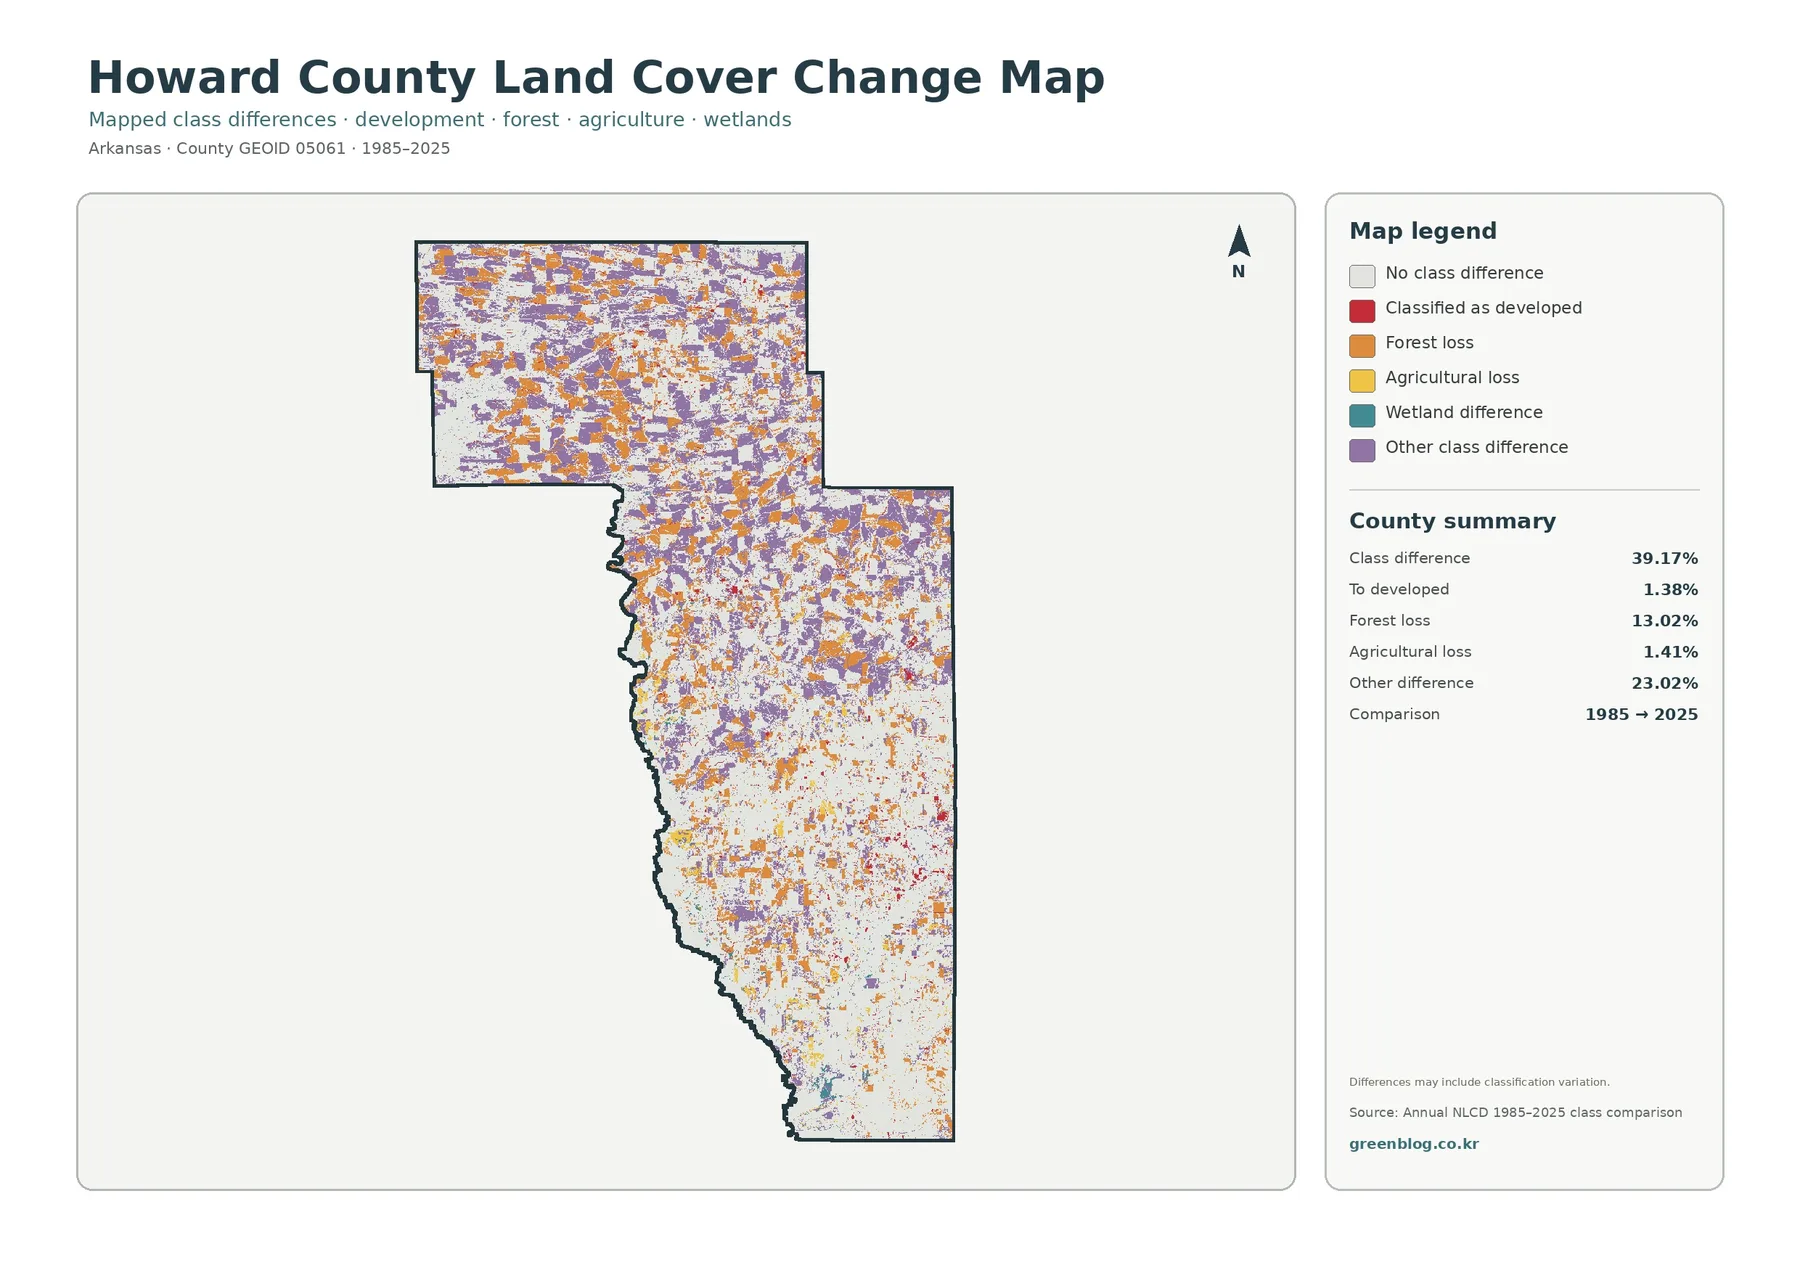
The 1985–2025 comparison marks 39.17% of the county as having a different mapped class between the two dates. Within that total, 1.38% is classified as a change to developed land, 13.02% as forest loss, 1.41% as agricultural loss, and 23.02% as other class differences. Orange forest-loss cells and purple other-difference cells are widespread in the northern and central portions of the county, while the south contains larger areas with no mapped class difference.
A 39.17% class-difference value is not a 39.17% development rate. The change-to-developed category is only 1.38%, and the map explicitly separates forest loss, agricultural loss, and other differences. Classification changes can also reflect how a cell was labeled in each observation year rather than a single simple land-use story. The large 23.02% “other difference” category is a good reason to avoid attributing the whole change figure to one cause.
The most useful approach is to compare the change view with the 2025 cover map. Northern areas can contain many difference cells while still being predominantly forest today. Likewise, agricultural cover in the southeast should be interpreted from the current map before the historical comparison is discussed. Keeping “current condition” and “change between two dates” separate makes reports and presentations much clearer.
Choosing the right view for a project
For a quick county overview, begin with the general 2025 classification and identify the broad forested north and the more agricultural southeast. The forest-and-farmland view is better when vegetation and farming are the main subjects. Switch to the impervious layer when settlement patterns, roads, rooftops, or runoff-related context matter, and use the change comparison only after the current pattern is understood.
Teachers can use the maps to ask students why one county can be both heavily forested and agriculturally important. Environmental reports can place the general cover next to the impervious view to distinguish large natural areas from compact developed centers. Habitat or watershed discussions can use the wetland and water classes as orientation, but any regulatory wetland boundary, flood zone, or water-quality conclusion needs the appropriate official dataset rather than this generalized classification alone.
The downloadable JPG files are 2480 × 1754 pixels each, larger than the WebP previews used in the article. They are the original source-resolution files supplied for this package. Printing quality still depends on the chosen physical size and printer settings, so users preparing a large-format page should check the final resolution in their layout software instead of assuming that every print size will be equally sharp.
Download the Four JPG Files
Frequently Asked Questions
Does land cover show zoning or property ownership?
No. Land cover classifies the physical surface—such as forest, agriculture, developed land, wetlands, or water. It does not establish zoning, ownership, parcel boundaries, or development rights.
Does 39.17% class difference mean 39.17% of Howard County was developed?
No. The 39.17% figure combines all mapped class differences between 1985 and 2025. Change to developed land is listed separately at 1.38%, alongside 13.02% forest loss, 1.41% agricultural loss, and 23.02% other class differences.
What is included in the download?
The ZIP contains four original JPG files: the 2025 general land-cover map, forest-and-farmland map, impervious/developed-land map, and 1985–2025 land-cover change map. Each JPG is 2480 × 1754 pixels.
Map File Information
File Information
- Included Files: Use only the versions confirmed in the article and supplied images
- File Type: Use the confirmed download contents
- Intended Use: Printing, education, presentations, and map-based projects
Related Maps
- A Craighead County Arkansas Land Cover Map
- Arkansas County Arkansas Land Cover Map
- Ashley County Arkansas Land Cover Map
Sources and Reference Data
- MRLC Annual NLCD Data
- USGS Annual NLCD Land Cover Classification
- Association of Arkansas Counties — Howard County
- University of Arkansas Division of Agriculture — Howard County Extension
- U.S. Census Bureau TIGER/Line Shapefiles
Green Map creates custom-edited map images using open geographic data sources such as geoBoundaries, Natural Earth, OpenStreetMap, and government open data.
These maps are edited visual materials, not raw data files, and are provided for education, documents, presentations, and graphic reference.