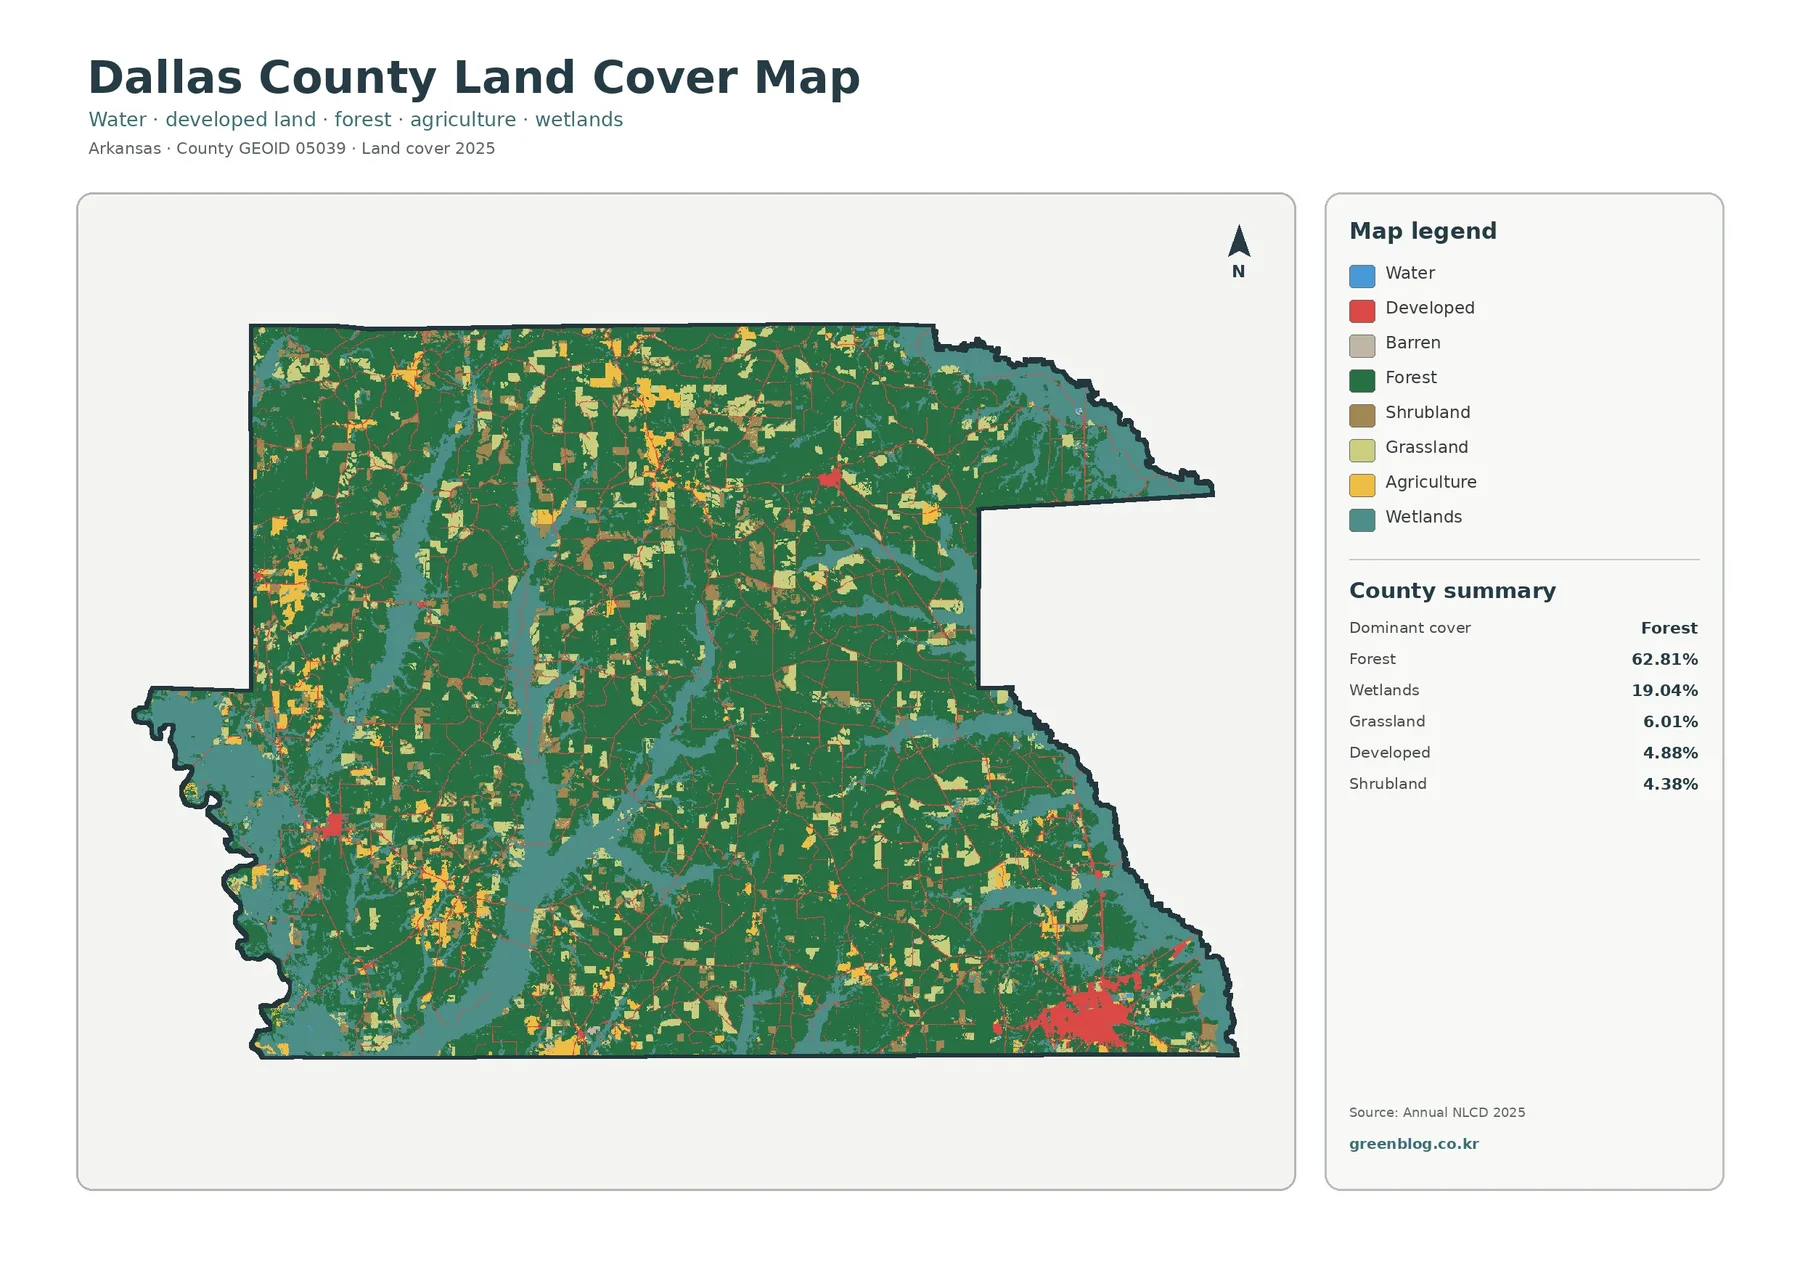
The Dallas County Arkansas Land Cover Map set presents four ways to examine the county: current land cover, forest and farmland, impervious surface, and mapped class differences from 1985 to 2025. The 2025 summary is dominated by forest at 62.81%, followed by wetlands at 19.04%. Grassland accounts for 6.01%, developed land 4.88%, shrubland 4.38%, agriculture 2.64%, and mapped water 0.15%.
Those four original maps are also available together as a ZIP containing 2480 × 1754 JPG files. The set works well when a reader needs one broad county overview, a cleaner forest-versus-open-land comparison, a closer look at paved and built surfaces, or a long-term class comparison for a lesson, report, or presentation.
Table of Contents
A forested county with wet ground woven through it
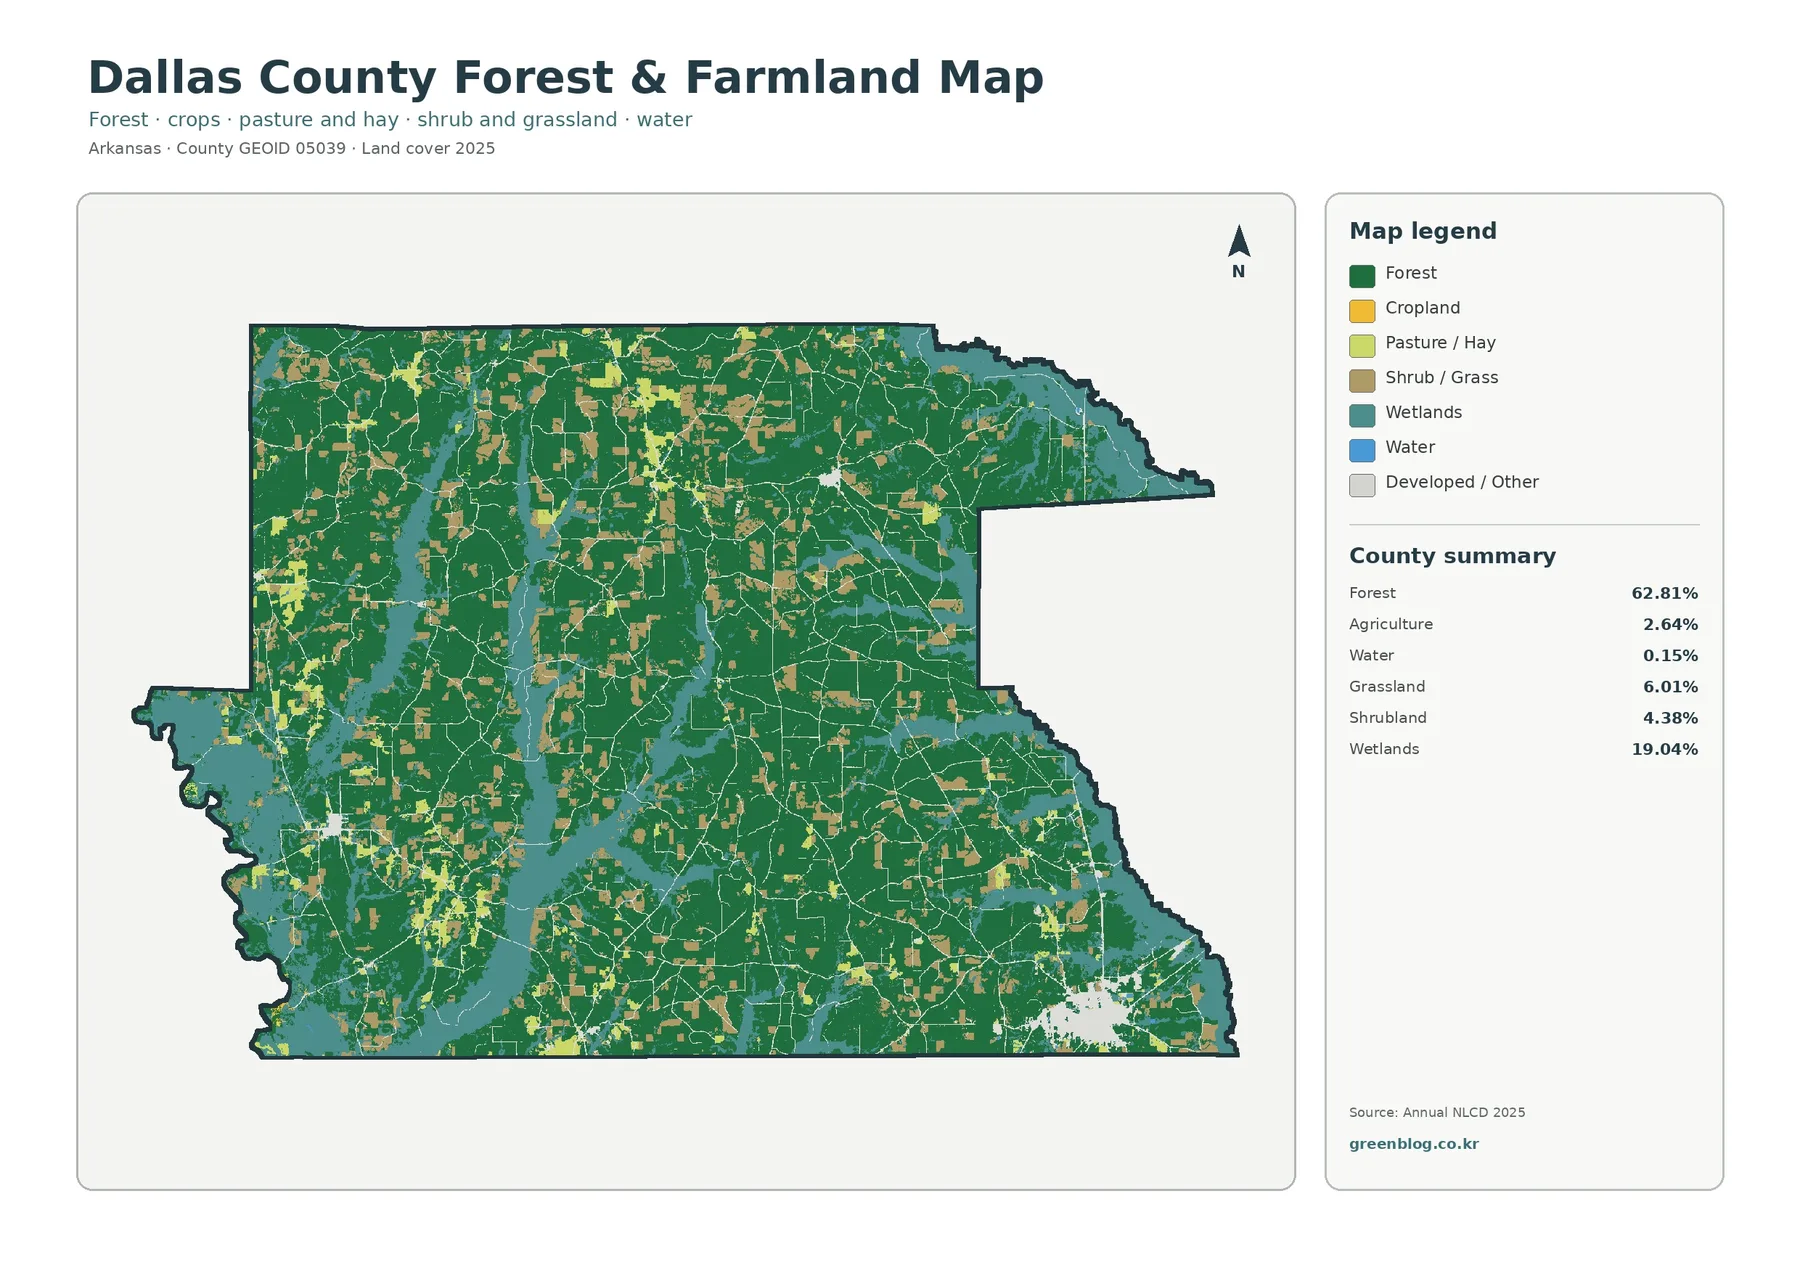
Forest is not simply the largest category in Dallas County; it covers most of the interior in broad connected blocks. Dark green extends across the north, center, and south, while agriculture appears as much smaller yellow patches scattered inside that wooded setting. The 62.81% forest share makes this pattern clear numerically, but the map adds an important second point: the remaining land is not concentrated in one single open belt.
Wetlands form the next major part of the county at 19.04%. Teal areas follow winding corridors along the western side and cut through several interior low areas, with broader wetland patches also visible in the south. The Association of Arkansas Counties describes Dallas County as a place of rolling hills and pine forests and notes that the Ouachita River forms the western county line. That local context helps explain why the irregular western edge is a useful reference when reading the wetland pattern, without claiming that every wetland cell has the same hydrologic origin.
Developed land occupies only 4.88% of the county, yet it is visually conspicuous because much of it is clustered rather than evenly dispersed. The strongest red concentration sits in the southeast. Fordyce is the county seat, and both the Association of Arkansas Counties and the University of Arkansas Cooperative Extension place key county services there. The map itself does not label towns, so that outside reference should be used as location context rather than as proof that every developed pixel belongs to one municipality.
Smaller open patches occur across the west, north-central area, and southern interior. Grassland at 6.01% and shrubland at 4.38% together cover more land than the agriculture class, which is 2.64%. This matters because a pale or open-looking area should not automatically be described as farmland. The legend separates agriculture, grassland, shrubland, wetlands, developed land, forest, water, and barren ground so that different surface covers are not collapsed into a single rural category.
Why the southeastern built footprint stands out
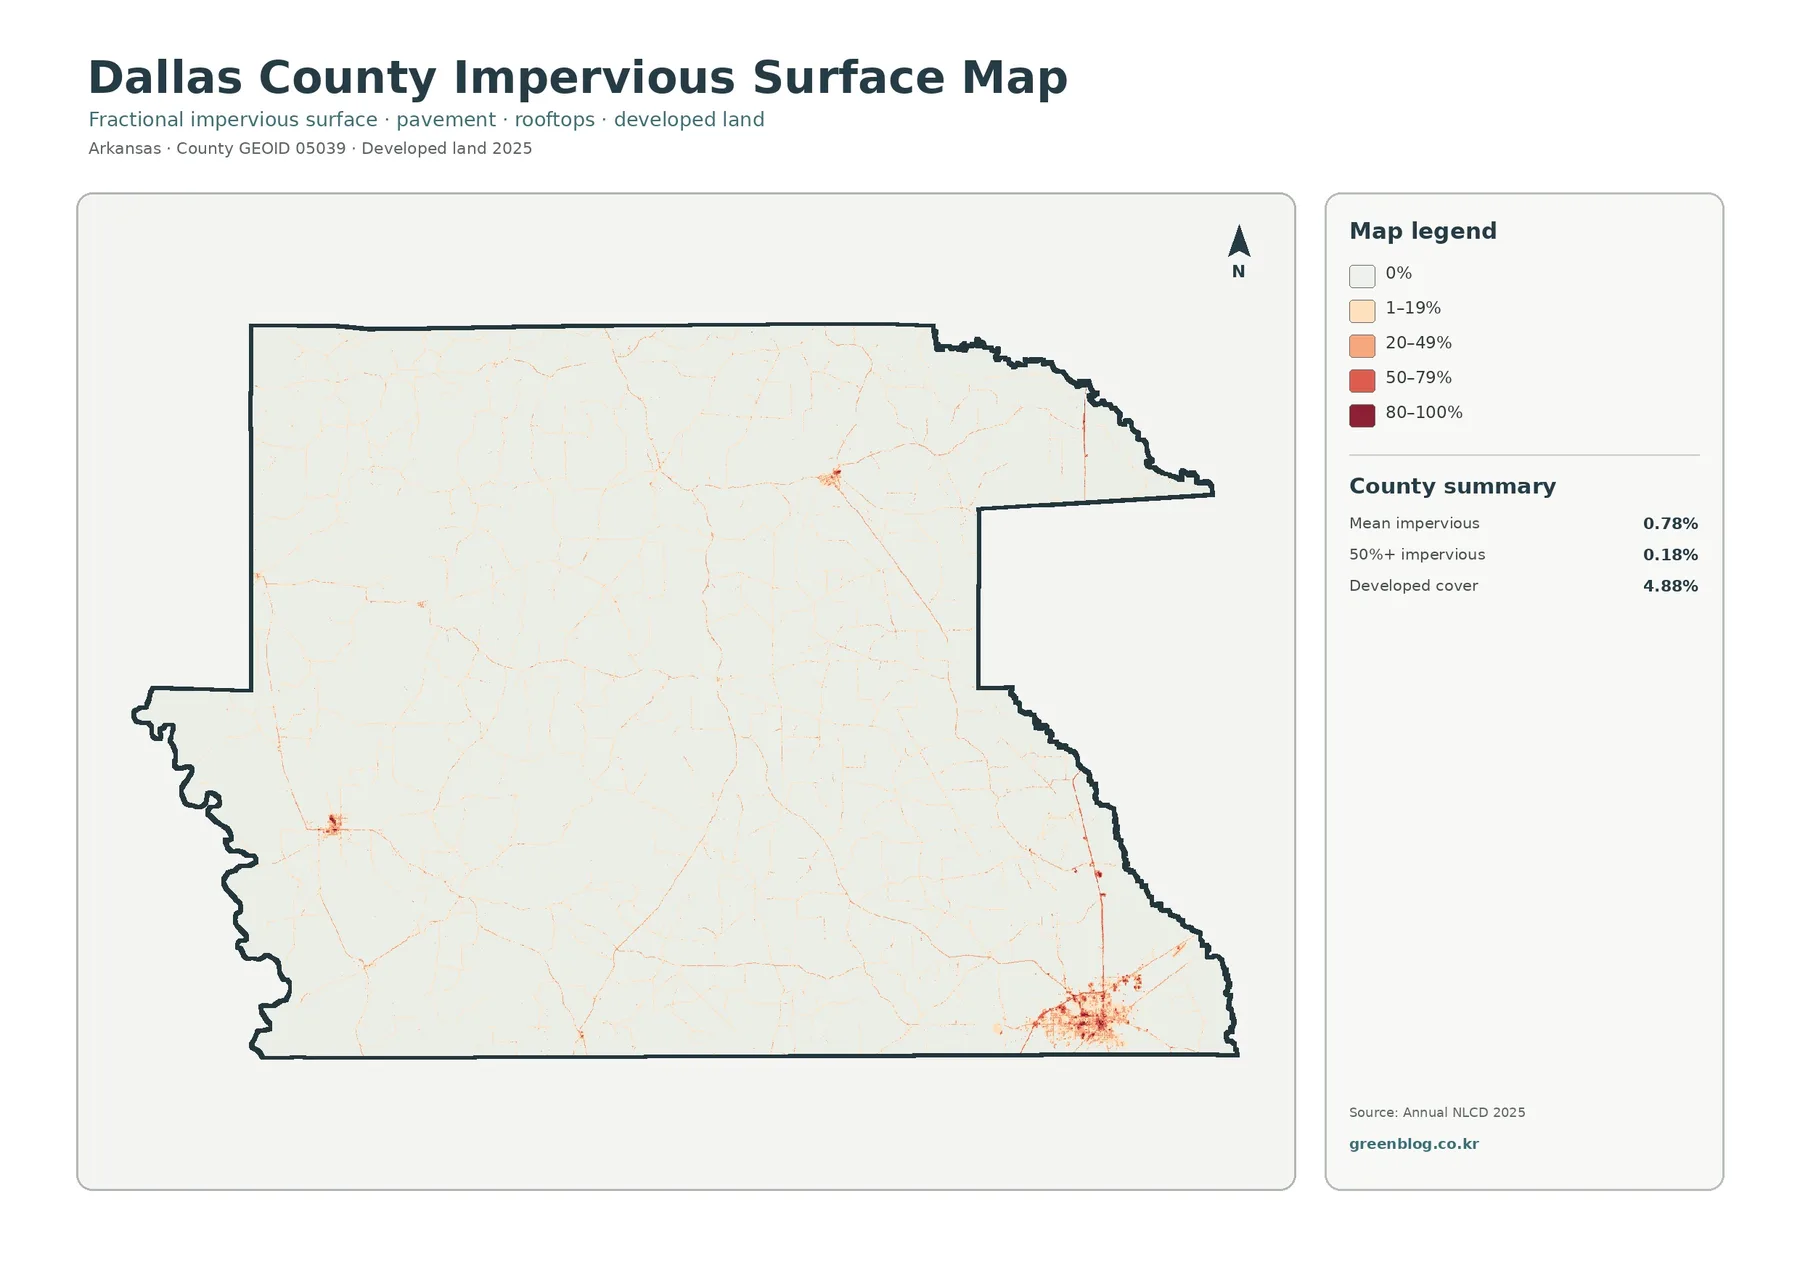
The impervious-surface view strips away most of the land-cover colors and makes paved or roofed surfaces easier to find. Impervious surface means ground such as pavement, rooftops, and parking areas where water does not readily soak into the soil. Dallas County has a mean impervious value of 0.78%, while only 0.18% of the county is mapped at 50% or greater imperviousness.
A dense orange-red cluster in the southeast is the strongest feature in this view. Fine linear traces extend outward along roads, and smaller nodes appear in the north-central and southwestern parts of the county. Against a county that is mostly forest and wetland, these compact concentrations are much easier to isolate here than on the general land-cover view. The map is therefore useful for locating built surfaces without allowing the larger forest category to dominate the visual comparison.
The developed-cover share of 4.88% should not be compared directly with the 0.78% mean impervious figure as if they measured the same thing. A developed land-cover class can include lawns, trees, exposed soil, and other surfaces that still absorb water. Impervious data focus more narrowly on the fraction covered by hard surfaces. That is why a low-density developed area may appear in the land-cover map while remaining pale in the impervious view.
High imperviousness alone does not establish flood risk, drainage failure, or water-quality problems. Those questions also depend on rainfall, slope, soils, drainage infrastructure, nearby streams, and wetland conditions. For planning context or environmental education, this image is best used to identify where built surfaces are concentrated and then paired with other hydrologic or engineering data when a risk assessment is required.
Forest, farmland, grass, and shrub cover are not evenly mixed
The forest-and-farmland view simplifies the visual competition among categories. Forest remains the dominant dark green surface, while cropland appears in smaller yellow patches and pasture or hay in lighter green. Shrub and grass cover add another set of open areas, wetlands remain teal, and developed or other surfaces are muted so that the natural and agricultural pattern can be compared more directly.
Agriculture covers 2.64% of Dallas County, so the county does not look like a broad farm plain. Cropland is scattered in modest blocks, especially in portions of the west and northwest, with additional openings in the central and southern areas. Forest surrounds many of these patches. The pattern is more useful for discussing a forested landscape containing local open areas than for suggesting that agriculture forms one continuous zone.
Grassland at 6.01% and shrubland at 4.38% deserve separate attention because their combined footprint is larger than agriculture. A map reader should not assume that every light-colored patch is a crop field or pasture. These classes describe surface cover, not ownership, zoning, or a legal land use. A shrub-dominated cell, for example, might reflect vegetation structure without saying why the land is in that condition or how it is managed.
Dallas County Cooperative Extension describes agriculture and natural resources as a core part of its local educational programming. That makes this map useful as a visual companion for county-level education, but it does not identify individual farms, timber stands, crop types, or management units. Those questions require parcel records, agricultural statistics, forestry inventories, or site-specific field information rather than a generalized land-cover image.
The western boundary is a useful anchor for reading wetlands
Water itself accounts for only 0.15% of the 2025 summary, while wetlands account for 19.04%. That difference is a reminder that open water and wetland cover are not interchangeable categories. A wetland cell may contain saturated soils or wetland vegetation without appearing as a lake or broad river surface. The general map therefore shows much more teal wetland cover than blue open water.
The Ouachita River is especially helpful as a geographic reference because local county information identifies it as the western county boundary. Teal areas trace portions of that irregular edge and continue into the county along other low corridors. Some wetland areas also broaden in the south. The image supports a statement that wetlands are concentrated near several drainage settings, but it does not support a claim that one river alone created every mapped wetland.
Wetland land cover also should not be mistaken for a regulatory wetland delineation. The map classifies broad surface characteristics from remote-sensing data. It does not establish legal jurisdiction, development restrictions, conservation status, or parcel ownership. Anyone evaluating a specific site needs official wetland, floodplain, parcel, and permitting information in addition to this county-scale map.
What changed between 1985 and 2025
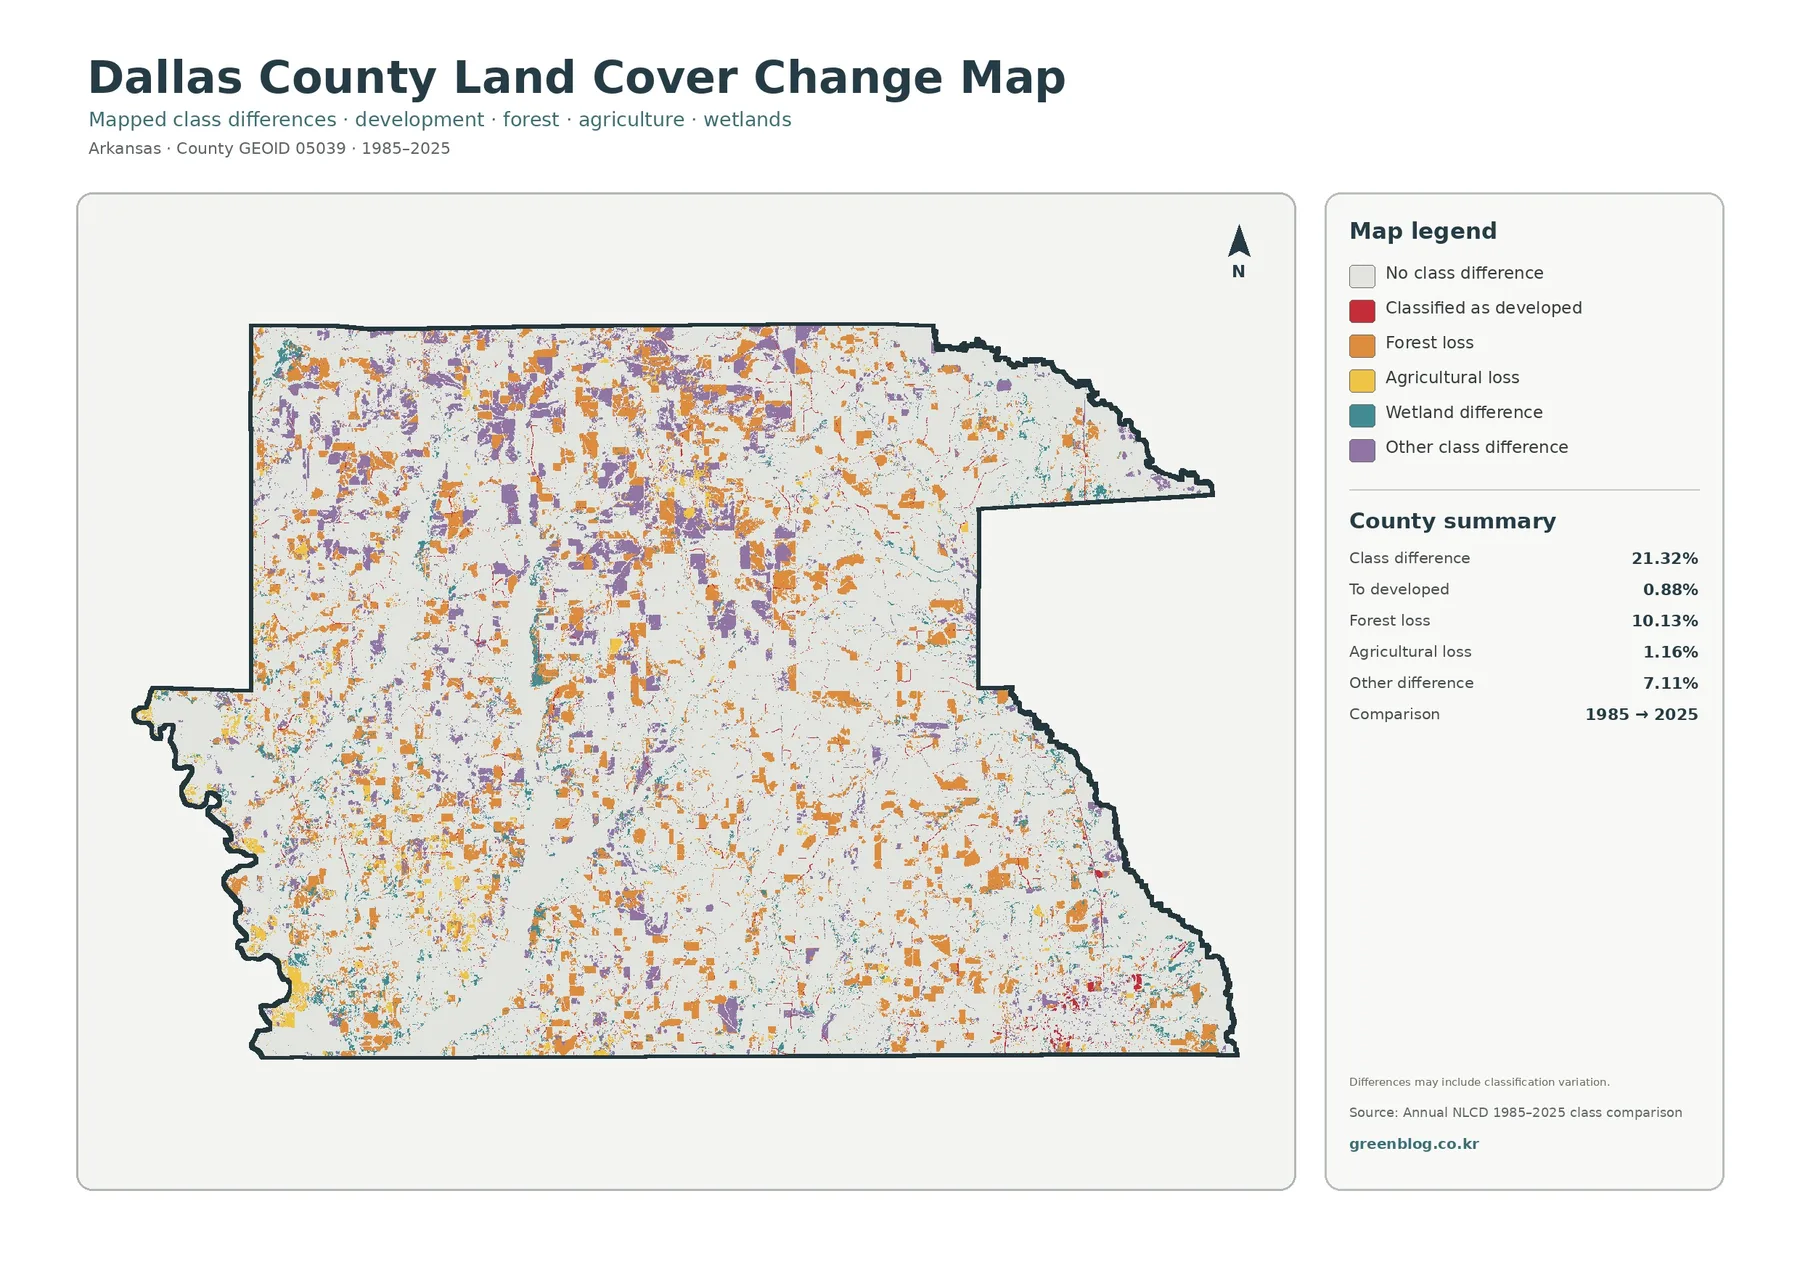
The long-term comparison reports a 21.32% class difference between 1985 and 2025. That figure is a comparison of mapped classes, not a countywide development rate. The summary separates 0.88% classified as developed, 10.13% forest loss, 1.16% agricultural loss, and 7.11% other class difference. Wetland differences also appear on the map, although the supplied summary does not assign them a separate percentage.
Orange forest-loss patches are scattered widely, especially through the northern, western, and central portions of Dallas County. Purple areas representing other class differences occur in many of the same broad regions. Red change-to-developed cells are more concentrated around the southeastern built area and appear in smaller fragments elsewhere. Teal wetland differences occur in several low areas and near portions of the western side.
A 10.13% forest-loss class does not by itself prove permanent clearing on every highlighted cell. Differences between two classification years can reflect true conversion, timber harvest followed by regrowth, vegetation-stage changes, mixed pixels, or classification variation. Determining what happened at a specific location would require intermediate-year imagery, local forestry records, aerial photographs, or field evidence.
USGS describes Annual NLCD as a representation of predominant thematic land cover for a mapping year and warns that classification products have artifacts and timing constraints. For Dallas County, the safest use of the change view is to locate areas where the 1985 and 2025 classes differ, then compare those places with the current land-cover and forest views. That approach separates a useful spatial clue from an unsupported story about cause.
How to combine the four views for a practical comparison
For a county overview, begin with the current land-cover map. It establishes the scale of forest and wetlands and shows why small developed clusters remain visually important despite their limited countywide share. The forest-and-farmland view can then answer a different question by making cropland, pasture or hay, shrub and grass cover easier to separate from the larger forest background.
A presentation about towns, roads, or stormwater context benefits more from the impervious map. The southeastern built concentration and thin road traces stand out without the distraction of many land-cover classes. For a historical comparison, place the change map beside the 2025 map instead of presenting it alone. Viewers can then see what the current surface is and where the two selected years differ.
Watershed or environmental education can use the western county edge as a familiar reference, then trace the wetland bands that continue into the interior. Habitat comparisons can contrast the extensive forest with open grass, shrub, and agricultural patches. These are broad context uses. Habitat quality, stream condition, timber value, crop productivity, or regulatory status are not measured by the four maps and require separate datasets.
Printed handouts are easier to follow when one map is given a clear purpose. A lesson about land-cover proportions can use the general view, while a worksheet about human surfaces can use the impervious image. A report discussing change should include the comparison years in the caption and explain that the colored cells mark class differences rather than automatically documenting development, deforestation, or wetland loss at a site.
Download the four Dallas County JPG maps
The download package contains the four original JPG maps used for this page. Each file is 2480 × 1754 pixels. The set includes the 2025 land-cover map, forest and farmland map, impervious-surface/developed-land map, and the 1985→2025 class-difference map. Keeping the maps as separate files makes it easier to choose only the view needed for a document, class, or slide deck.
For a report, retain the legend and year in the image so readers can interpret the colors correctly. If the map is cropped for a presentation, avoid removing the legend or the county summary that contains the supplied percentages. The original JPGs are best treated as reference graphics rather than parcel maps, and they can be paired with local records when a project needs greater geographic detail.
Scale, classification, and date limits
Land-cover products are raster classifications. In plain terms, the landscape is divided into small grid cells and each cell receives a representative class. A cell can contain more than one real surface, such as trees beside a road or a building next to grass. Those mixed pixels mean that narrow features and small boundaries can look simplified at county scale.
The current maps are labeled 2025. Construction, timber activity, vegetation recovery, farm management, or other changes after that observation period are not represented here. A project that depends on current site conditions should check recent aerial photography and local records. These maps are strongest when the goal is to compare broad county patterns using one consistent classification framework.
Land cover is also different from zoning and legal land use. A forest pixel does not identify an owner or a management plan. An agriculture pixel does not name a crop or define a farm boundary. A developed pixel does not say what uses are legally allowed. Parcel-level decisions require the appropriate county, state, federal, or professional source rather than a generalized satellite-derived map.
Frequently Asked Questions
What is the dominant 2025 land cover in Dallas County?
Forest is the dominant class at 62.81%. Wetlands are second at 19.04%, followed by grassland at 6.01%, developed land at 4.88%, shrubland at 4.38%, agriculture at 2.64%, and water at 0.15%. The map is most informative when those percentages are considered together with where each class is concentrated.
Why is developed cover 4.88% while mean impervious surface is only 0.78%?
Developed land-cover classes can include lawns, trees, soil, and other permeable surfaces around buildings and roads. Impervious data focus on hard surfaces such as pavement and rooftops. A developed area can therefore contain a relatively small fraction of impervious material, especially where buildings are spread out.
Does the 21.32% class difference mean 21.32% of Dallas County was developed after 1985?
No. The 21.32% figure combines several kinds of differences between the 1985 and 2025 classifications. The supplied summary lists 0.88% change to developed, 10.13% forest loss, 1.16% agricultural loss, and 7.11% other class difference, with wetland differences also visible. It should be read as a class-comparison measure, not a development rate.
Map File Information
The ZIP contains the four original Dallas County land-cover JPG maps shown on this page.
- File Type: Four JPG files in one ZIP archive
Related Maps
- A Craighead County Arkansas Land Cover Map
- Arkansas County Arkansas Land Cover Map
- Ashley County Arkansas Land Cover Map
Sources and local context
- MRLC Annual NLCD Data — access to Annual NLCD science products
- USGS Annual NLCD Land Cover Classification — class definitions, product notes, and interpretation caveats
- U.S. Census Bureau TIGER/Line Shapefiles — county boundary reference
- Association of Arkansas Counties — Dallas County — local overview including Fordyce, pine forests, and the Ouachita River
- University of Arkansas Cooperative Extension — Dallas County Programs — county agriculture and natural-resources education
Green Map creates custom-edited map images using open geographic data sources such as geoBoundaries, Natural Earth, OpenStreetMap, and government open data.
These maps are edited visual materials, not raw data files, and are provided for education, documents, presentations, and graphic reference.