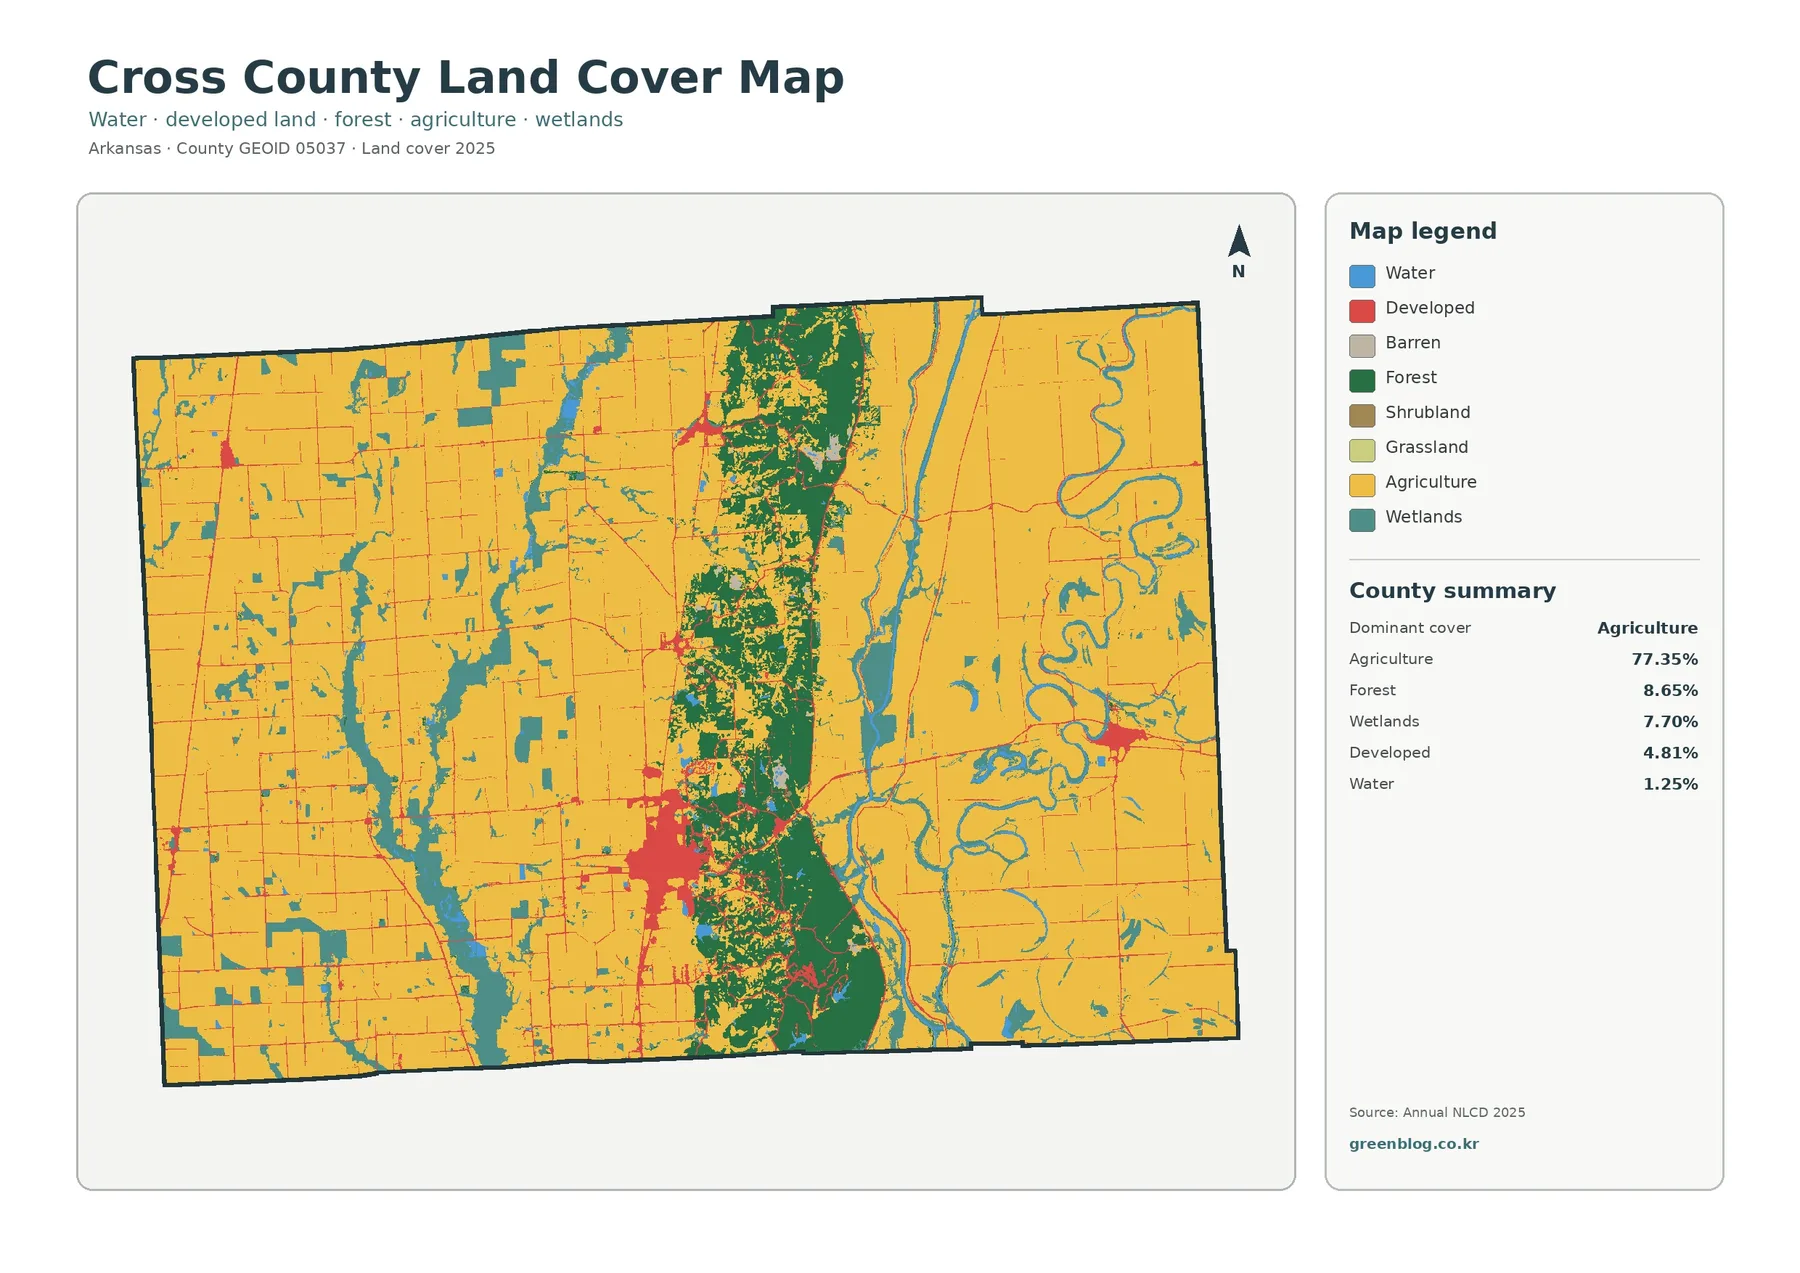
The Cross County Arkansas Land Cover Map set describes a county dominated by agriculture but divided by a very different central landscape. Agriculture accounts for 77.35% of the 2025 classification, while a narrow north–south band of forest cuts through broad farm country. Wetlands follow several drainage corridors, and the largest developed cluster sits around the county’s main population center.
Four views are included here: general land cover, forest and farmland, impervious surface with developed land, and a 1985–2025 class comparison. The four original 2480×1754 JPG maps are also available together in one download, which makes the set useful for classroom work, regional reference, environmental presentations, and side-by-side map comparisons.
Table of Contents
Why the middle of Cross County looks unlike the farm plains
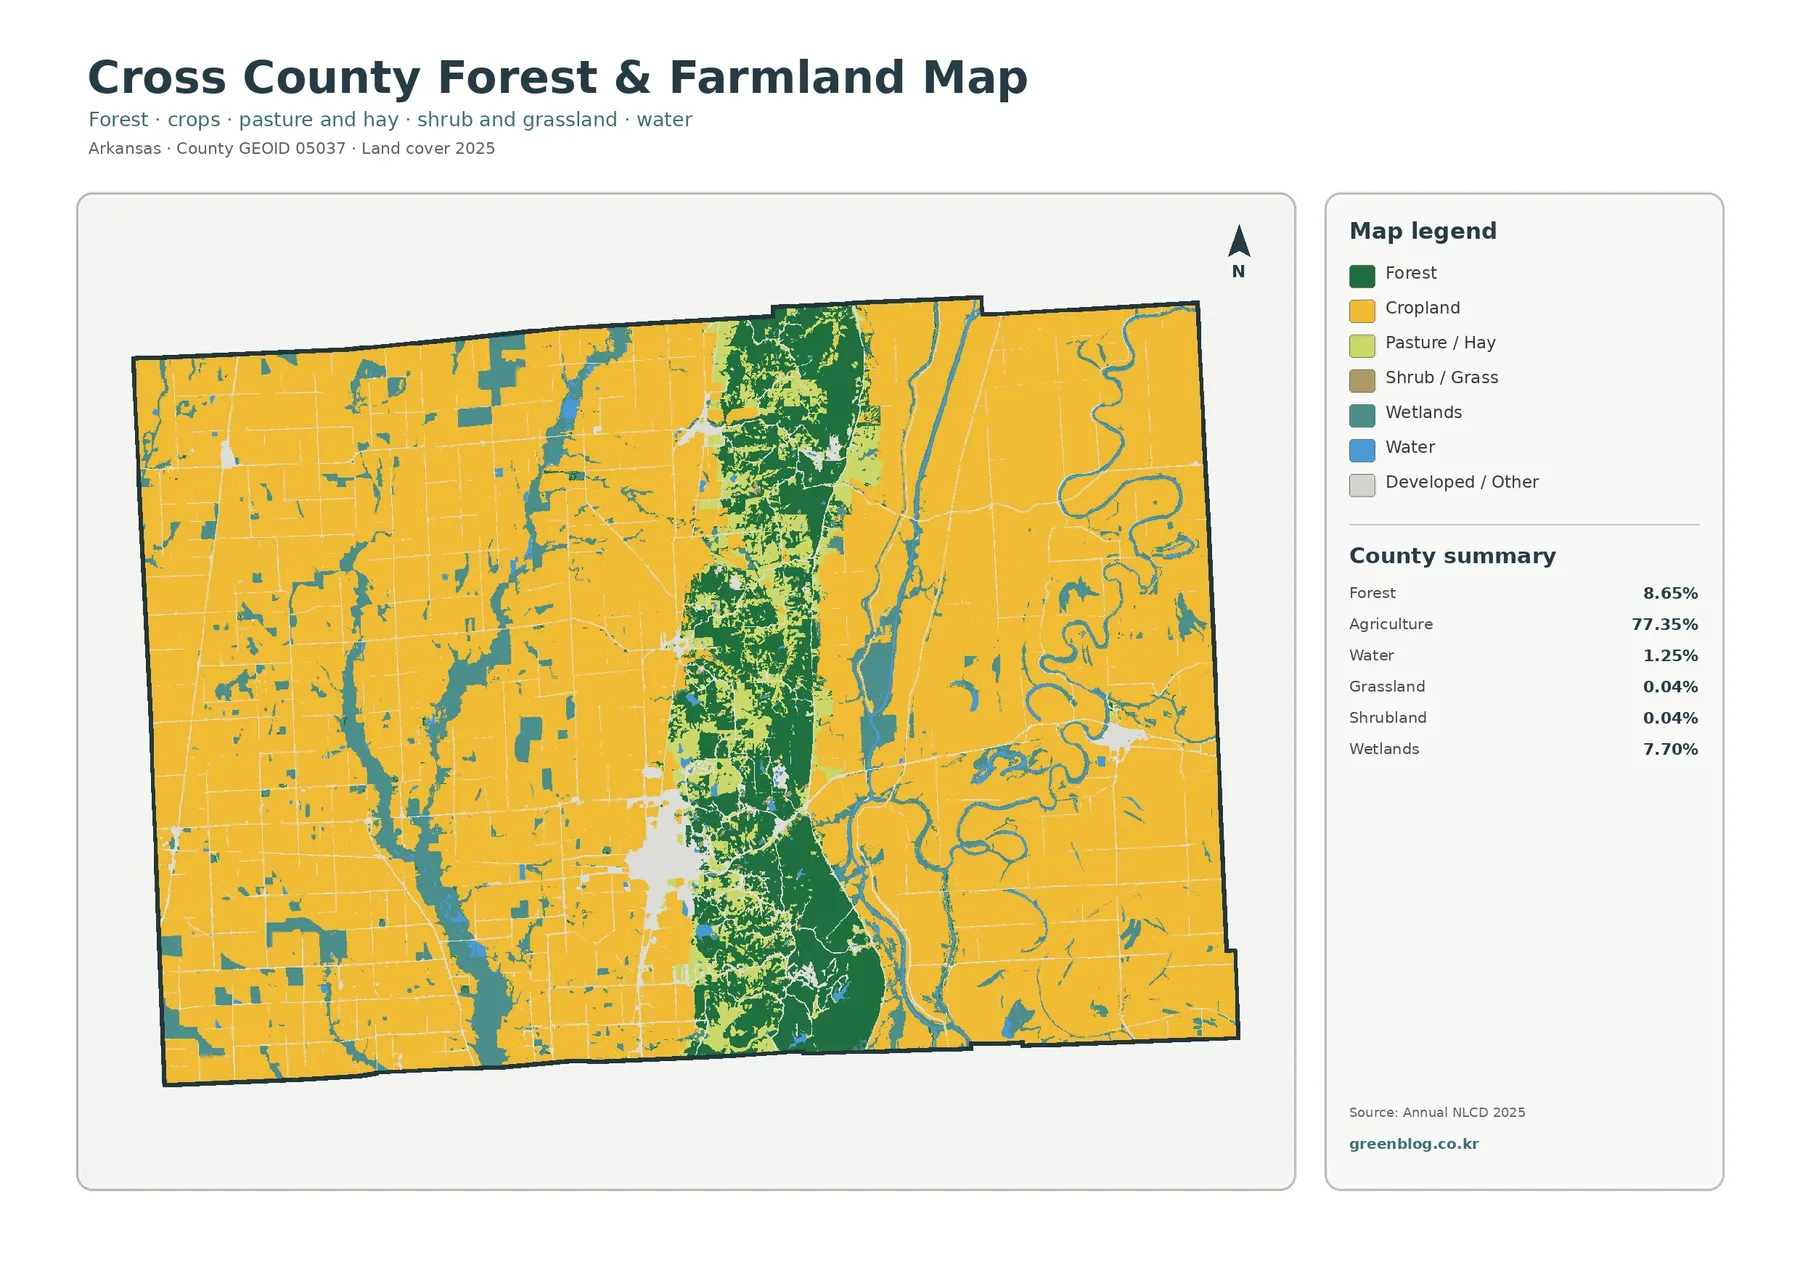
A first look at the 2025 land-cover view is mostly yellow because cropland and other agricultural cover extend across both the eastern and western sides of Cross County. The pattern changes sharply near the middle. Dark green forest forms a long, relatively narrow band from north to south, creating a visible break between the two large agricultural areas.
That arrangement matches a geographic description from the Association of Arkansas Counties, which characterizes the eastern and western parts of Cross County as rich, flat Delta farmland and the center as rolling hills. The wooded strip on the map corresponds with the Crowley’s Ridge landscape. Cross County’s official site also identifies agriculture as the predominant industry, so the large share of mapped agricultural cover fits the county’s present-day land-cover pattern without requiring the map to identify individual crops.
Forest represents 8.65% of the county, but its location makes it much more noticeable than the percentage might suggest. Most of the green is concentrated through the center rather than scattered evenly across the county. A county with the same forest percentage spread in small patches would look very different, which is why the map should be read as a pattern of locations as well as a table of percentages.
Wetlands cover 7.70%, appearing as teal strips and irregular patches around watercourses and low-lying areas. They occur in the farm plains as well as along the edges of the central wooded area. Water itself accounts for 1.25%. These blue and teal features occupy far less area than agriculture, yet they interrupt the fields often enough to matter when studying drainage, habitat, or the relationship between farming and natural cover.
Development is compact compared with the agricultural footprint
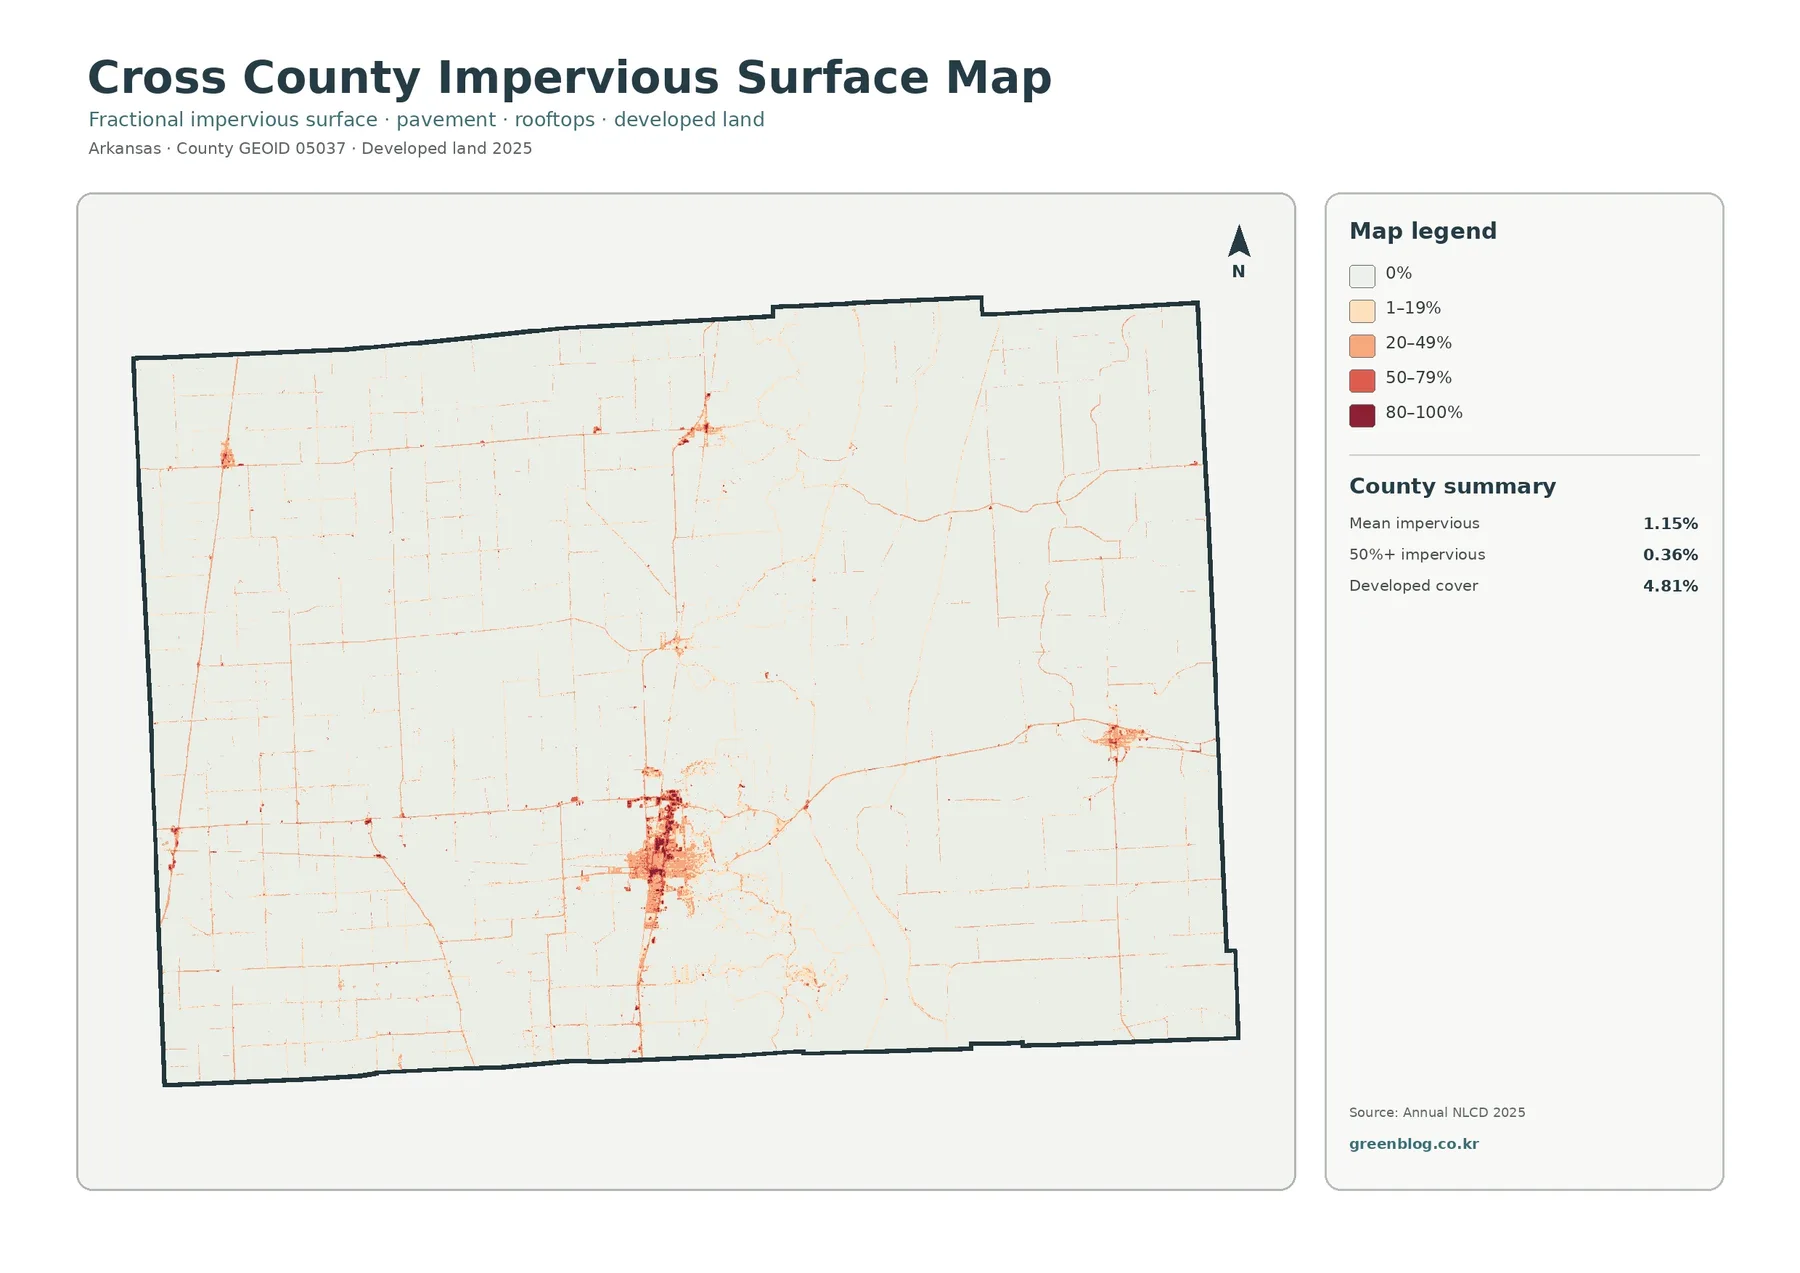
Developed land accounts for 4.81% of the 2025 county classification. Its distribution is not uniform. The strongest cluster lies in the south-central part of Cross County, while smaller concentrations appear in the northwest, north-central area, and east. The official county website identifies Wynne as the county seat and largest town, with Cherry Valley, Hickory Ridge, and Parkin among the other incorporated cities. Those settlement locations provide useful context for the separated developed clusters visible in the map set.
The impervious-surface view narrows the question from “developed land” to surfaces such as pavement, rooftops, and parking areas that do not readily absorb water. Cross County has a mean impervious value of 1.15%, and 0.36% of the county falls in the 50%-or-more impervious category. Both values are much smaller than the 4.81% developed-land figure because a developed classification can include lawns, trees, soil, and other surfaces that still allow water to soak into the ground.
A dense patch stands out around the south-central developed area, and thin lines extend outward along the rural road network. Smaller towns form isolated nodes instead of merging into one broad urban region. That pattern is helpful for explaining why a county can have an extensive transportation network and several communities while still remaining overwhelmingly agricultural in its overall land-cover totals.
Impervious values should not be treated as a flood or runoff-risk map on their own. Drainage depends on rainfall, slope, soil, ditches, streams, wetlands, and infrastructure in addition to pavement and roofs. This layer is best used to locate where hard surfaces are concentrated and then combined with hydrology or engineering data when a project requires an actual drainage assessment.
Agriculture surrounds the wooded Crowley’s Ridge corridor
The forest-and-farmland view removes much of the visual competition from the general classification and makes the county’s two dominant landscapes easy to compare. Cropland spreads across most of the flat land on either side of the center. Forest is concentrated along the ridge, while wetlands trace low areas and drainage features through the fields.
Cross County’s official website lists rice, soybeans, sweet potatoes, corn, and cotton among its primary crops. Those facts explain the county’s agricultural economy, but the land-cover map does not identify which crop occupies a particular field. The 77.35% agricultural figure should therefore be read as surface cover, not as a crop inventory, farm ownership map, or legal land-use designation.
The central forest band has local context beyond its color on the map. County information describes Village Creek State Park as lying on Crowley’s Ridge, where the rolling terrain contrasts with the surrounding Delta plain. The map cannot show park boundaries or forest ownership by itself, but the ridge setting helps explain why a relatively small countywide forest percentage appears in such a continuous and recognizable north–south shape.
Grassland and shrubland are each only 0.04% in the supplied summary, so they are minor components of this countywide picture. Their small presence is a reminder not to force every legend class into equal prominence. For Cross County, the useful comparison is agriculture first, then the wooded ridge and wetlands, followed by the smaller developed and water areas.
The 1985–2025 comparison shows limited but clustered differences
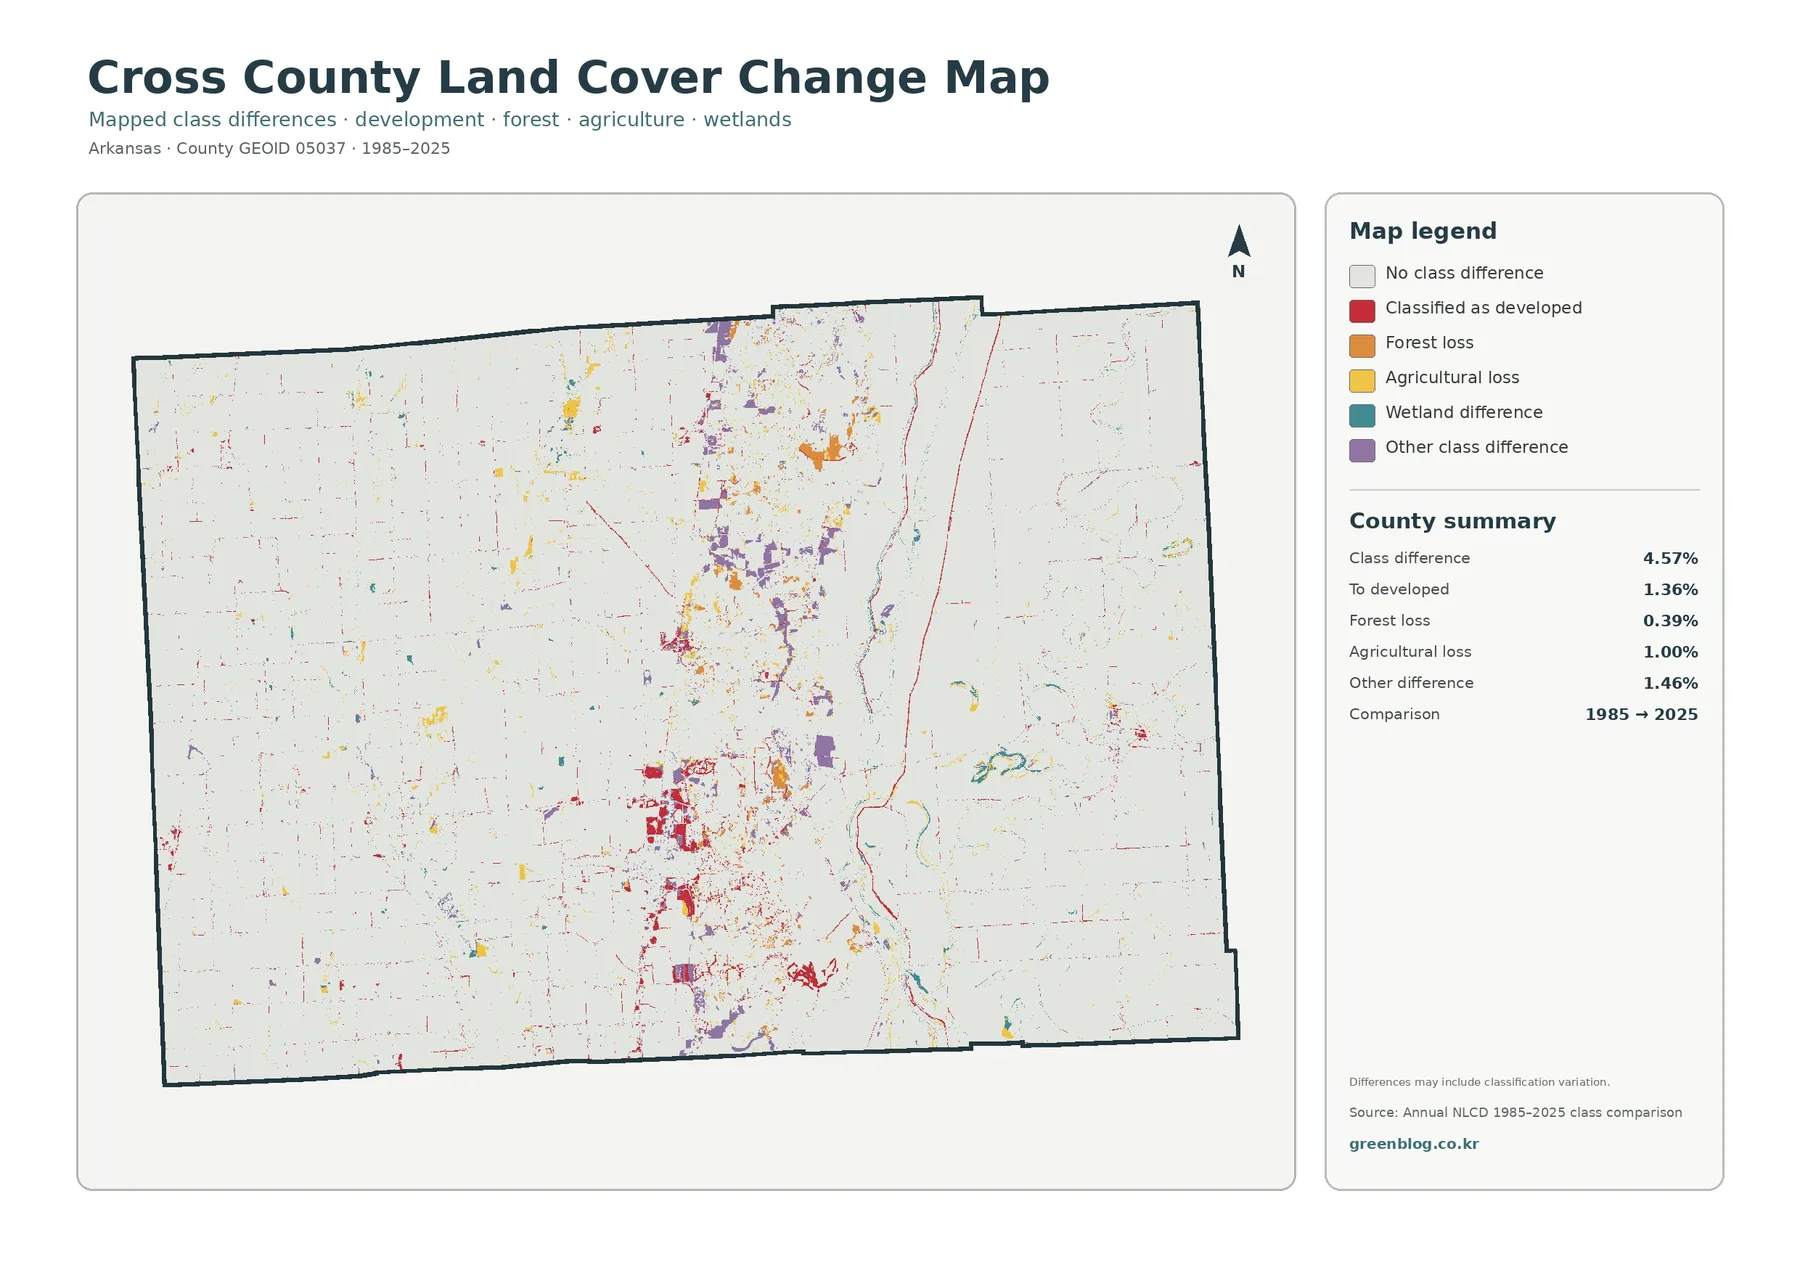
The change map compares the classification at the same locations in 1985 and 2025. A total of 4.57% of the county is marked with a class difference. That number is not a development rate. The summary separates 1.36% classified as a change to developed land, 0.39% marked as forest loss, 1.00% as agricultural loss, and 1.46% as other class difference.
Red development-change marks are most noticeable around the south-central settlement area and along several thin corridors. Orange forest-loss patches and purple other differences occur within and near the central ridge. Yellow agricultural-loss marks are scattered across the plains. Most of the county remains pale because the two selected years received the same broad class at those locations.
None of those colors explains a cause. A location marked as agricultural loss may have moved to another class for several reasons, and a small difference can also reflect classification behavior in a mixed 30-meter cell. Satellite conditions, class definitions, or a boundary between two cover types can affect individual cells, especially where fields, trees, roads, and wet areas meet.
For a careful comparison, start with the 2025 land-cover map, note the current agricultural plain, forested ridge, wetlands, and developed clusters, and then examine the change layer. If the exact timing or cause of a change matters, intermediate-year imagery, aerial photographs, local planning records, or field observations are needed. The map is a screening and explanation tool rather than proof of a parcel-level land conversion.
Choose the map according to the question
Use the general land-cover view when an audience needs one picture of the county’s present landscape. It combines agriculture, forest, wetlands, development, and water, so it works well as an overview for a report, a classroom introduction, or a regional comparison with neighboring Arkansas counties.
The forest-and-farmland map is more effective when the question concerns farming, wooded uplands, or the contrast between Crowley’s Ridge and the Delta plains. Removing most developed detail makes the central forest band easier to see. Wetlands also remain visible, which is useful for discussions that connect agriculture with drainage corridors or habitat.
For settlement and transportation topics, the impervious layer gives a clearer picture than the broad developed class. Hard-surface concentrations around Wynne and smaller communities can be compared with thin road traces across the agricultural landscape. If the assignment is about long-term change, the 1985–2025 layer is the appropriate final comparison after the current map has established where each major cover type is located.
All four views use the same county boundary, so they can be placed side by side without changing geographic extent. That consistency is useful in presentations: one map can establish the overall pattern, a second can isolate the feature being discussed, and the change layer can provide historical context without forcing too much information into a single figure.
What the percentages do and do not tell you
Countywide percentages are valuable for comparison, but they can hide concentration. Forest is only 8.65% yet forms one of the most distinctive shapes on the map because much of it lies through the middle. Wetlands are 7.70% and appear as numerous ribbons and patches rather than one large block. Developed land is 4.81%, but a substantial share is clustered around a few communities.
Land cover is also different from zoning, ownership, parcel boundaries, or a development-permission map. Annual NLCD classifies what is on the surface at the scale of raster cells. A field classified as agriculture says nothing about who owns it, and a developed cell does not establish what a local zoning ordinance allows there.
The supplied current classification is dated 2025. New construction, crop changes, forest clearing, wetland changes, or road work after that observation period will not appear. When a decision depends on present conditions at a specific property, use current aerial imagery, field verification, cadastral information, and local government records in addition to this countywide map set.
Download the four Cross County land-cover JPGs
The download contains the four original JPG files used for this page: general land cover, forest and farmland, impervious surface with developed land, and the 1985–2025 land-cover comparison. Each image is 2480×1754 pixels, preserving the supplied source dimensions rather than enlarging the maps beyond their original resolution.
Frequently Asked Questions
What is the dominant 2025 land cover in Cross County?
Agriculture is dominant at 77.35%. Forest accounts for 8.65%, wetlands 7.70%, developed land 4.81%, and water 1.25%. The agricultural area is broad on both sides of the county, while much of the forest forms a narrow central band along the Crowley’s Ridge landscape.
Why is developed cover 4.81% when mean impervious surface is only 1.15%?
Developed classes can include a mixture of buildings, pavement, lawn, trees, and soil. Impervious surface counts the hard surfaces that resist water infiltration, such as roofs and pavement. A low-density developed area can therefore be classified as developed while still having a relatively modest impervious percentage.
Does the 4.57% 1985–2025 difference mean that 4.57% of Cross County was developed?
No. The 4.57% figure covers all locations where the two selected years have different mapped classes. Only 1.36% is specifically categorized as a change to developed land. Forest loss, agricultural loss, other differences, and possible classification variation are also part of the comparison.
Map File Information
The ZIP contains the four original Cross County land-cover JPG maps described on this page.
- File Type: four JPG images in one ZIP archive
Related Maps
- A Craighead County Arkansas Land Cover Map
- Arkansas County Arkansas Land Cover Map
- Ashley County Arkansas Land Cover Map
Sources and reference material
- MRLC Annual NLCD Data – official access to Annual NLCD land-cover products.
- USGS Annual NLCD Land Cover Classification – definitions for developed, forest, agriculture, wetlands, water, and other classes.
- Cross County, Arkansas official website – county geography, communities, agriculture, and local information.
- Association of Arkansas Counties – Cross County – background on the Delta farmland, central rolling hills, agriculture, and natural areas.
Green Map creates custom-edited map images using open geographic data sources such as geoBoundaries, Natural Earth, OpenStreetMap, and government open data.
These maps are edited visual materials, not raw data files, and are provided for education, documents, presentations, and graphic reference.