Elmore County Alabama Land Cover Map brings together four views of the same east-central Alabama county: 2025 land cover, forest and farmland, fractional impervious surface, and mapped class differences from 1985 to 2025. Forest is the largest 2025 class at 49.19%, but the county is not a single continuous woodland. Farmed and open areas, developed clusters, wetlands, and broad water corridors interrupt the forest pattern in several distinct parts of the county.
The four original 2480 × 1754 JPG maps are available in one ZIP, while the WebP images in the article are sized for online viewing. The set works well for reports, classroom comparison, presentation graphics, and general environmental reference because each map keeps the same county outline while emphasizing a different surface characteristic.
Table of Contents
Forest and water shape the first impression of Elmore County
The supplied 2025 summary gives forest a 49.19% share of Elmore County. Agriculture accounts for 20.93%, developed land 11.71%, wetlands 6.94%, and water 5.40%. The forest-and-farmland view also reports shrubland at 2.61% and grassland at 2.59%. Those numbers make forest the clear leading category, yet the map is visually diverse because water bodies, agricultural patches, wet areas, and development break the green cover into several large and small pieces.
Dark green is especially widespread through the north, center, and east, with additional large forest blocks toward the south. Agricultural colors become more common across western sections and in the southeast. Developed land is not spread evenly across the county. The strongest concentrations appear near the southwestern edge and in a central-southern cluster, with smaller concentrations and narrow traces elsewhere. This is a useful example of why a countywide percentage should always be read together with the map itself.
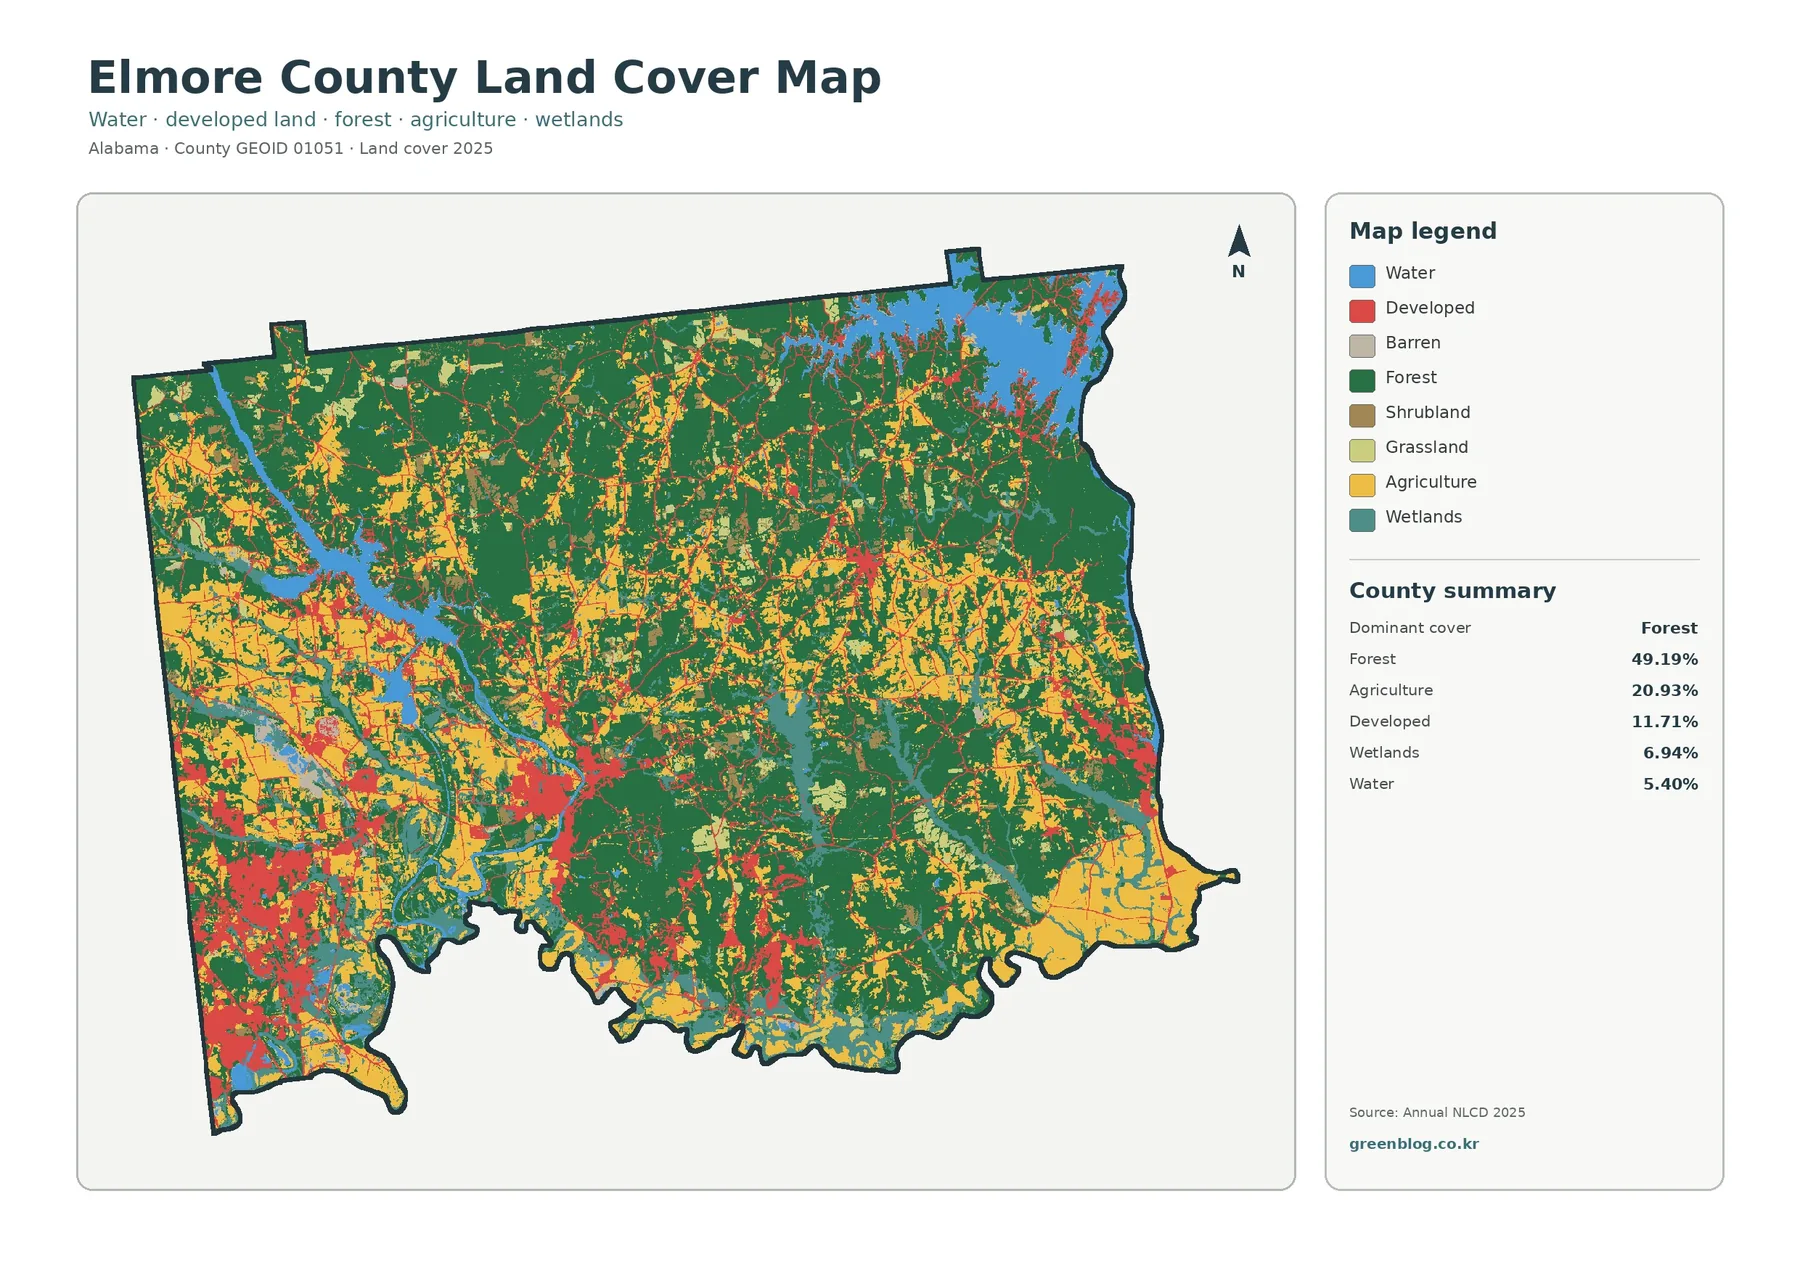
The legend includes water, developed land, barren land, forest, shrubland, grassland, agriculture, and wetlands. It should not be treated as a list of equally important county features. Forest and agriculture occupy the broadest areas. Water and wetlands are also prominent because they form coherent corridors and large patches even though their percentage shares are smaller. Barren land is included in the legend but is not reported among the leading percentages in the supplied county summary, so the map does not support describing it as a defining land-cover type.
The Coosa and Tallapoosa rivers provide a practical geographic frame
Elmore County’s official website places the county in east-central Alabama and states that it is drained by the Coosa and Tallapoosa rivers. The two rivers meet a few miles south of Wetumpka to form the Alabama River. That description is useful when reading the supplied land-cover image, where broad blue water areas and branching wetland colors interrupt the forest and agricultural cover. The thematic map does not label every water body, but the county’s official river geography explains why water is such a visible part of the overall pattern.
Wetumpka, the county seat, sits on the Coosa River just above the junction with the Tallapoosa. The city’s official history describes a setting against the Appalachian foothills and along the river. The current land-cover map shows a developed concentration in the central-southern part of the county near large water features. It is reasonable to use Wetumpka as a geographic reference for that area, but the map itself is not a municipal-boundary or street map, so individual red pixels should not be assigned to a specific road or city parcel without another source.
The southwestern edge is another important developed area. Elmore County lists Millbrook, Coosada, Prattville, and other communities among its municipalities and notes that part of Prattville lies in the county. The impervious map contains some of its strongest orange and red clusters in that southwestern corner. That visual alignment helps orient a reader, while still leaving the exact municipal boundaries to an administrative map rather than this land-cover product.
A closer rural view separates cropland, pasture, woodland, and wet areas
The forest-and-farmland map changes the emphasis by separating cropland from pasture and hay while keeping forest, shrub and grassland, wetlands, water, and developed or other land visible. This makes the county’s 20.93% agricultural share easier to interpret. Broad agricultural areas are more apparent in the west and southeast, but they are mixed with woodland rather than forming one uninterrupted block. Pasture and hay add lighter open areas around and between the stronger cropland colors.
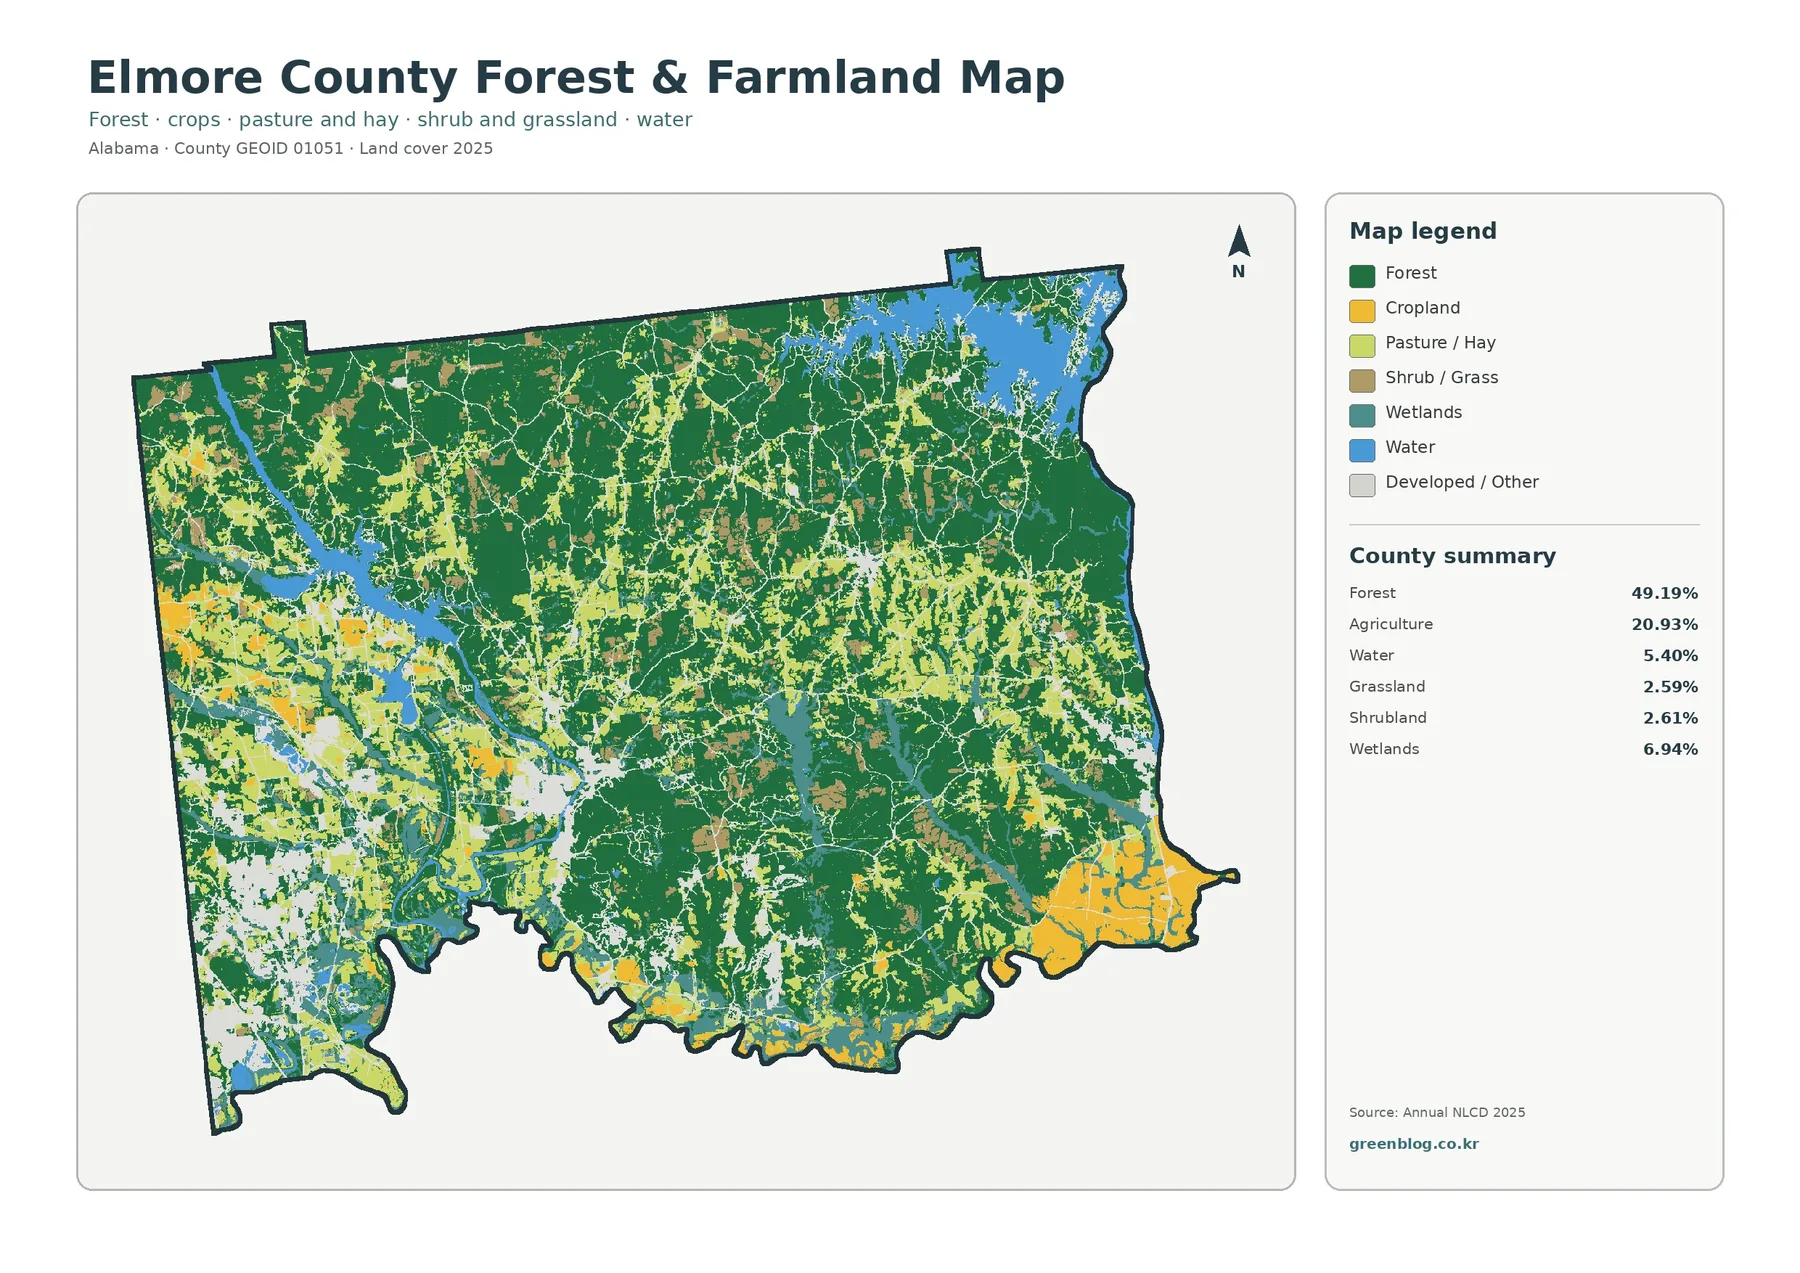
Forest remains more continuous across much of the north and east. In the middle of the county, however, the rural classes become more fragmented, with agriculture, forest, wetlands, water, and developed or other land appearing in close proximity. This map is especially helpful when a project needs to discuss rural surface cover without treating every non-urban area as the same. A wooded ridge, a cultivated field, a pasture, a wetland edge, and open grass can all look “green” in a photograph while representing different mapped classes.
Land-cover agriculture should not be confused with farm ownership or legal land use. A cell classified as cropland or pasture tells the reader how the surface was categorized from remotely sensed information. It does not identify a property owner, field boundary, crop, zoning designation, conservation status, or development right. The same limit applies to forest. Dark green does not establish whether woodland is public, private, protected, managed for timber, or available for another use.
Impervious surface isolates the county’s harder-built footprint
Impervious surface means pavement, rooftops, and similar hard materials that do not readily absorb rainfall. Elmore County’s mean impervious value is 2.52% in the supplied 2025 summary, and 0.97% of the mapped area is at least 50% impervious. Those figures are much smaller than the 11.71% developed-land share because the two products measure different things. A developed cell can contain houses and roads while still including lawns, trees, soil, or other permeable ground.
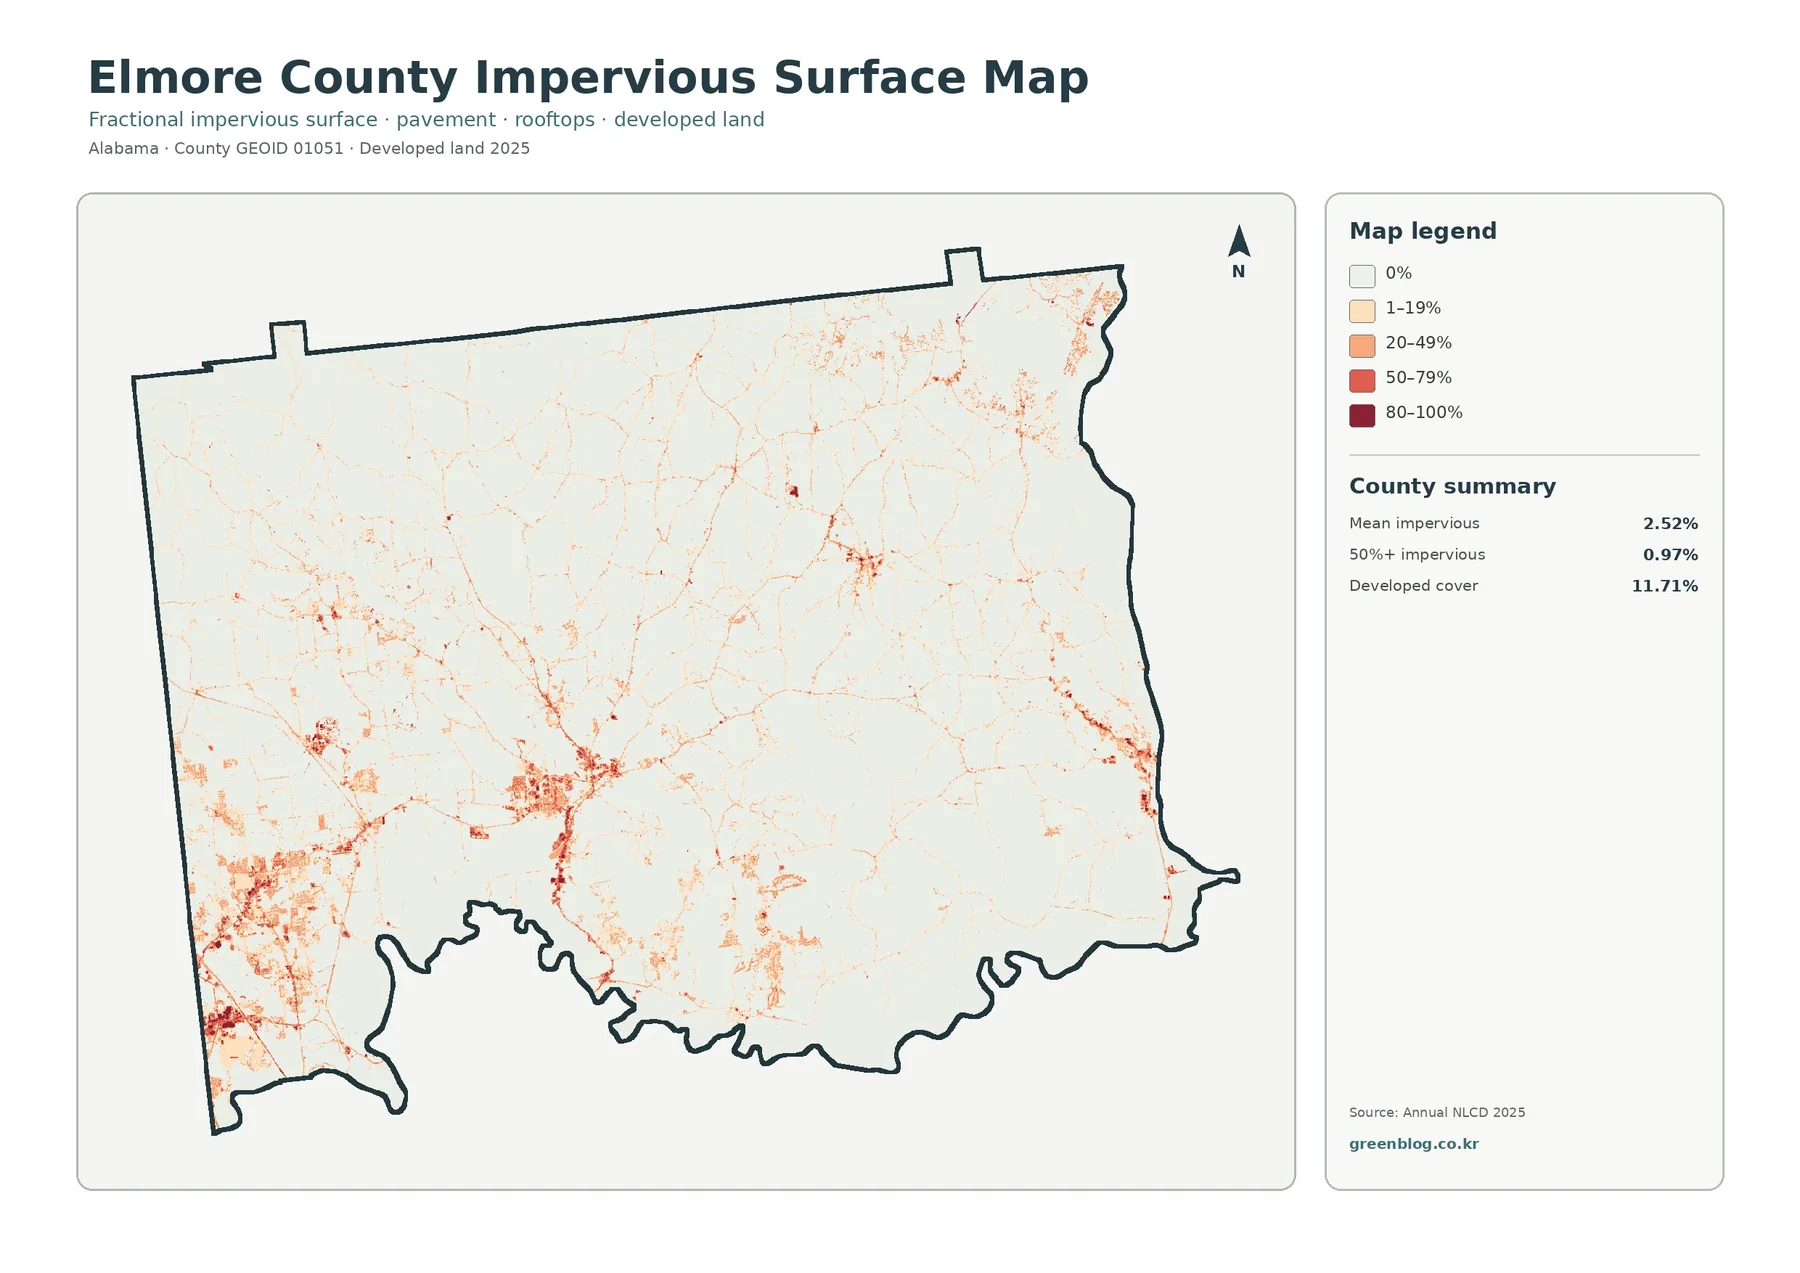
Most of the county remains very pale on this map. Stronger orange and red values collect in the southwest and around a central-southern developed cluster, while thinner traces branch through other parts of the county. This selective pattern is useful because it removes much of the visual weight of forest and agriculture and focuses attention on hard-covered surfaces. It is better for comparing concentrations of pavement and rooftops than for describing the full extent of developed land.
The map can support a general discussion of stormwater context, but it is not a flood or drainage model. Runoff also depends on rainfall, slope, soil, vegetation, drainage systems, stream networks, and local grading. A planning or environmental report can use the impervious layer to identify broad concentrations that deserve closer attention, then combine it with hydrology and engineering information before making a site-specific claim.
The 1985–2025 map records class differences, not a complete history of land use
The change map compares the mapped class at two endpoints. Its summary reports class differences across 31.85% of Elmore County. Of the displayed categories, 5.09% is marked as classified to developed, 6.20% as forest loss, 3.40% as agricultural loss, and 16.63% as other difference. The legend also includes wetland difference as a separate class. Because “other difference” is the largest reported component, the map should not be reduced to a simple narrative of development replacing forest or farmland.
Red developed-change pixels appear strongly in parts of the southwest and around current developed concentrations, but they are not confined to one location. Orange forest-loss patches and purple other differences are spread much more widely. Agricultural-loss colors appear in scattered areas, and wetland differences form another distinct category around some low-lying or water-associated places. The geographic spread is valuable for identifying locations to investigate, but the colors do not tell the reader which project, harvest, management decision, flood, or other event produced the difference.
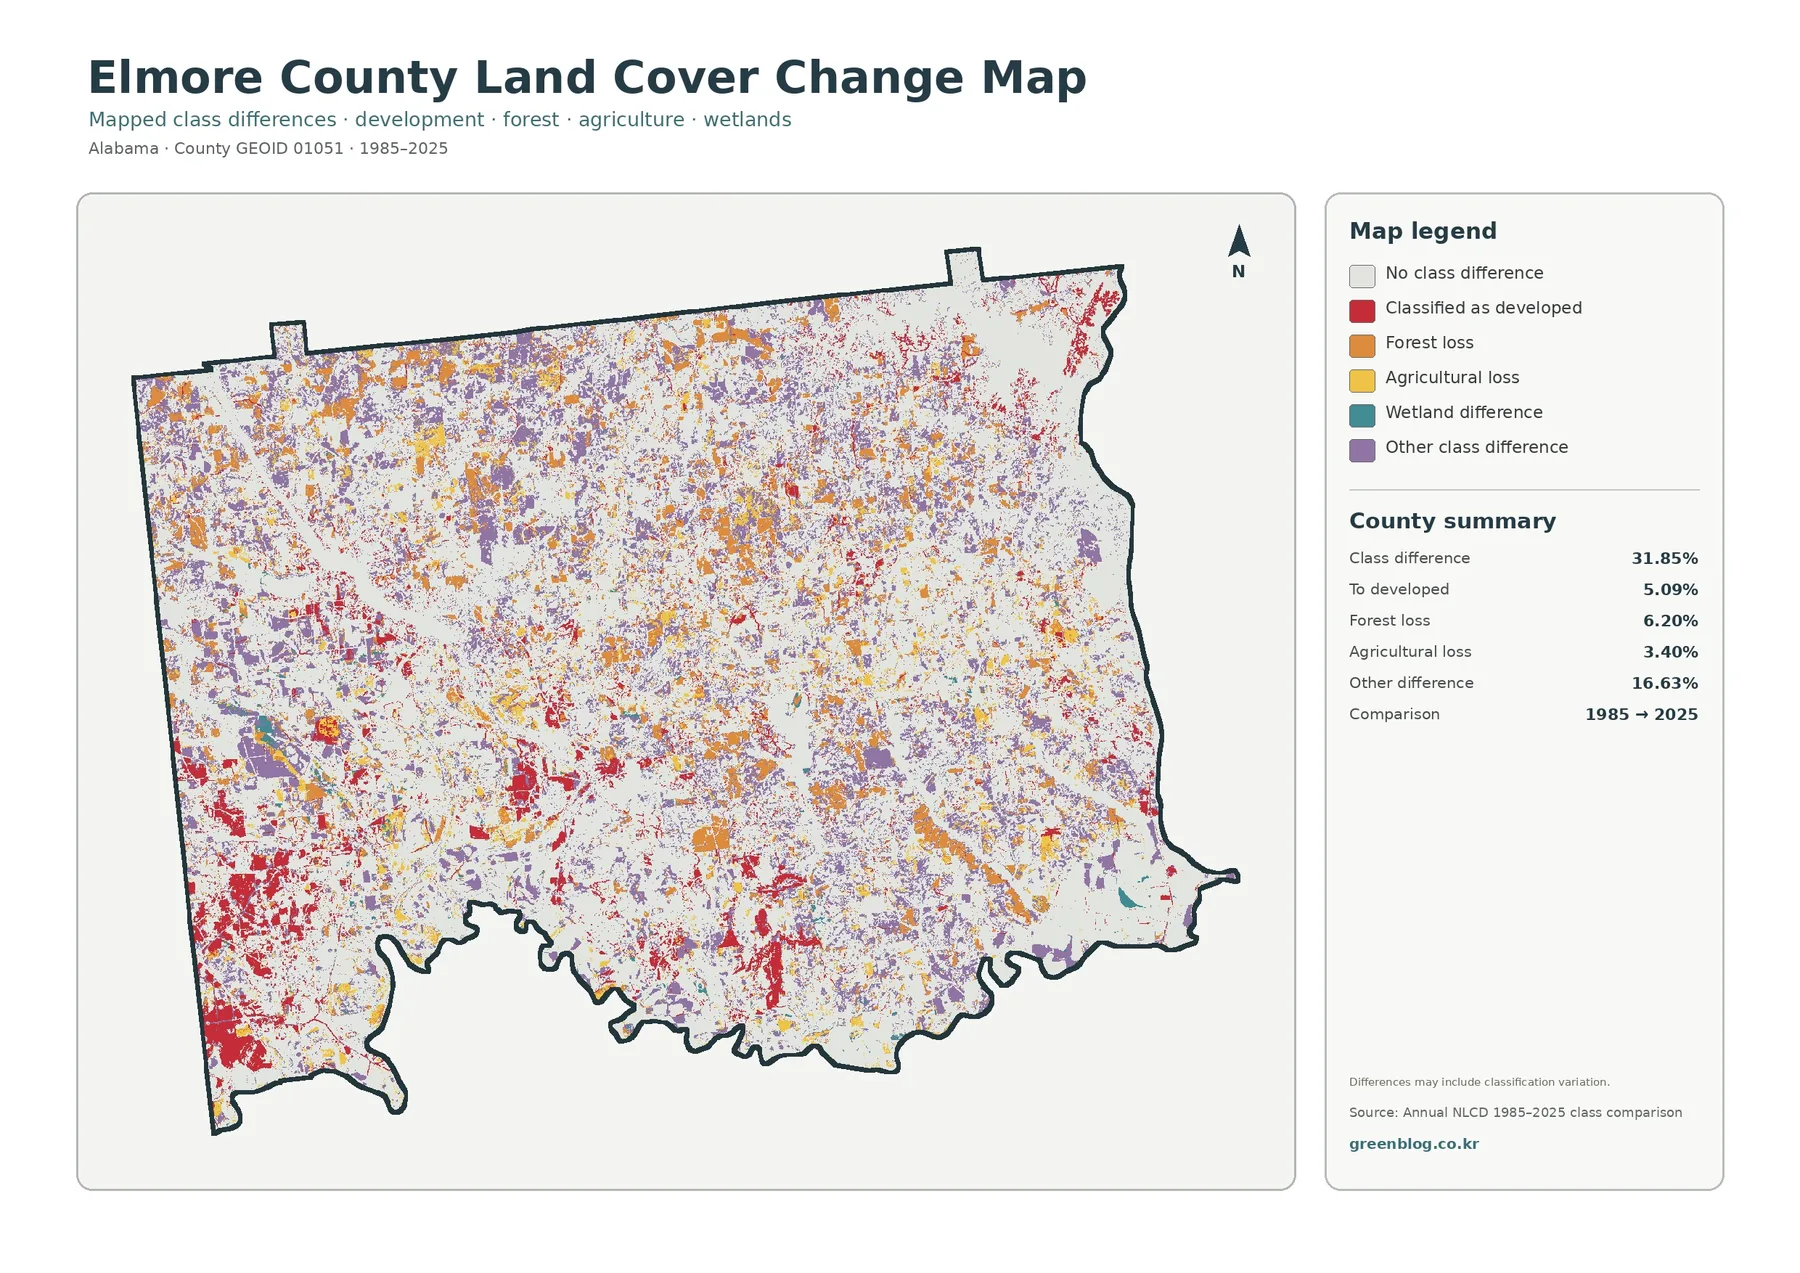
The warning printed on the supplied map is important: differences may include classification variation. Annual NLCD is a 30-meter raster product, meaning the landscape is divided into grid cells. A single cell can contain trees, field edges, pavement, buildings, and water at the same time. If the dominant signal differs between the endpoint years, its assigned class can change even when the real ground transition is more complex than a one-step conversion. Important historical claims should therefore be checked against annual data, aerial imagery, or local records.
A simple comparison workflow keeps the four products from being mixed up
Begin with the general land-cover map and locate the broad forest, agricultural, water, wetland, and developed areas. Then move to the forest-and-farmland view to separate cropland from pasture and hay and to see how those open areas fit among the wooded blocks. The impervious image should come next when the question narrows to paved and roofed surfaces. Only after establishing the current pattern should the 1985–2025 map be used to ask where the mapped class differs between the two endpoints.
This order prevents a common mistake. A location that is developed in 2025 does not have to be colored “classified to developed” on the change map if it was already mapped as developed in 1985. A wooded area can also contain scattered change pixels while remaining predominantly forest in the current map. Each image answers a different question, so the best interpretation comes from matching the statement to the product that actually measures it.
Useful applications for teaching, reports, and regional comparison
For a geography class, Elmore County provides a strong example of a forest-led county where water and developed corridors still have a visible role. Students can compare the 49.19% forest share with the actual distribution and explain why the county is not uniformly wooded. They can also contrast developed cover at 11.71% with mean imperviousness at 2.52% to learn that a developed category can include substantial permeable ground.
Environmental education can use the water and wetland pattern to discuss how thematic maps organize surface information around major river systems. The county’s official description of the Coosa and Tallapoosa rivers gives a clear geographic reference without requiring the land-cover map itself to label every river reach. For regional comparisons, keeping the same Annual NLCD year and legend allows Elmore County to be placed beside neighboring counties without changing the basic classification framework.
Presentation designers can use the four matching county outlines as a sequence. The general map establishes the landscape, the forest-and-farmland map narrows the rural classes, the impervious view highlights hard surfaces, and the change map adds a time comparison. None of the four should be used as a parcel survey, zoning map, wetland jurisdiction determination, engineering plan, or proof that a specific property changed use.
Download the four supplied JPG originals
The WebP previews used in the article measure 1800 × 1273 pixels. The ZIP contains four original JPG files at 2480 × 1754 pixels each. The asset manifest identifies these as the supplied original resolution and does not mark them as meeting the package’s A3 high-resolution reference. For ordinary documents and presentations, the originals preserve more source detail than a browser screenshot. For large-format printing, test the intended physical size first rather than assuming a print resolution that the source package does not claim.
Scale and legal-use limits matter when the map is enlarged
Annual NLCD is designed for consistent regional land-cover analysis, not surveyed parcel boundaries. At 30-meter resolution, narrow roads, small buildings, thin streams, field margins, and forest edges can be smaller than a cell or mixed with another surface inside the same cell. Enlarging the JPG makes the pixels larger on screen, but it does not create finer ground information. A sharp color edge should therefore not be interpreted as an exact legal or ecological boundary.
Land cover is also different from zoning, ownership, and permitted land use. Agricultural cover does not prove that a parcel is legally zoned for agriculture. Developed cover does not establish a building right. A wetland class is not a regulatory wetland determination, and forest cover does not show whether land is protected, publicly owned, or managed for timber. Property, permitting, engineering, and legal questions require current authoritative records and, when appropriate, field verification.
Frequently Asked Questions
What is the largest land-cover class in Elmore County?
Forest is the largest class in the supplied 2025 summary at 49.19%. Agriculture is 20.93%, developed land 11.71%, wetlands 6.94%, and water 5.40%. The map shows why the forest percentage should not be read as uniform cover: farmed areas, water, wetlands, and developed clusters divide the wooded landscape in several parts of the county.
Why is developed cover 11.71% while mean imperviousness is only 2.52%?
Developed land is a categorical land-cover class, while fractional impervious surface estimates the portion of a cell covered by hard material such as pavement and rooftops. Low-density development may include substantial grass, trees, and soil. A cell can therefore be classified as developed without being mostly impervious, so the two percentages are not expected to match.
Does every colored change pixel prove that land use changed between 1985 and 2025?
No. The image records a difference in mapped land-cover class between the two endpoint years, and the map itself warns that classification variation may be included. The colors are best used to locate candidate areas for closer study. Historical interpretation should be checked with annual land-cover data, aerial imagery, local records, or field information before a specific cause is claimed.
Map File Information
The ZIP contains four original JPG maps of Elmore County covering 2025 land cover, forest and farmland, impervious surface, and mapped class differences from 1985 to 2025.
- File Type: ZIP containing four JPG images
Related Maps
- Autauga County Alabama Land Cover Map
- Baldwin County Alabama Land Cover Map
- Barbour County Alabama Land Cover Map
Sources and Further Reading
- MRLC Annual NLCD Data — official access to Annual NLCD land-cover and related products.
- USGS Annual NLCD Land Cover Classification — definitions for the land-cover classes represented by the map legend.
- U.S. Census Bureau TIGER/Line Shapefiles — official county-boundary and geographic-reference data.
- Elmore County Commission: County Operations — official county background on location, the Coosa and Tallapoosa rivers, Wetumpka, and local municipalities.
- City of Wetumpka: History — official context for Wetumpka’s Coosa River and Appalachian foothills setting.
Green Map creates custom-edited map images using open geographic data sources such as geoBoundaries, Natural Earth, OpenStreetMap, and government open data.
These maps are edited visual materials, not raw data files, and are provided for education, documents, presentations, and graphic reference.