The Crittenden County Arkansas Land Cover Map presents a 2025 county dominated by agriculture but edged by a much wetter landscape along its deeply curved eastern boundary. Agriculture accounts for 76.35% of the mapped area, while wetlands, water, and a concentrated developed zone create strong local contrasts. The four views on this page make it possible to compare broad cover, farm and forest patterns, hard surfaces, and long-term classification differences without treating them as the same measurement.
The original four JPG maps are available together in the download section at the supplied 2480 × 1754 pixel source resolution. They can be used as county reference graphics, classroom examples, environmental-study figures, or presentation images after first checking which layer best matches the question being asked.
Table of Contents
A county where fields occupy most of the interior
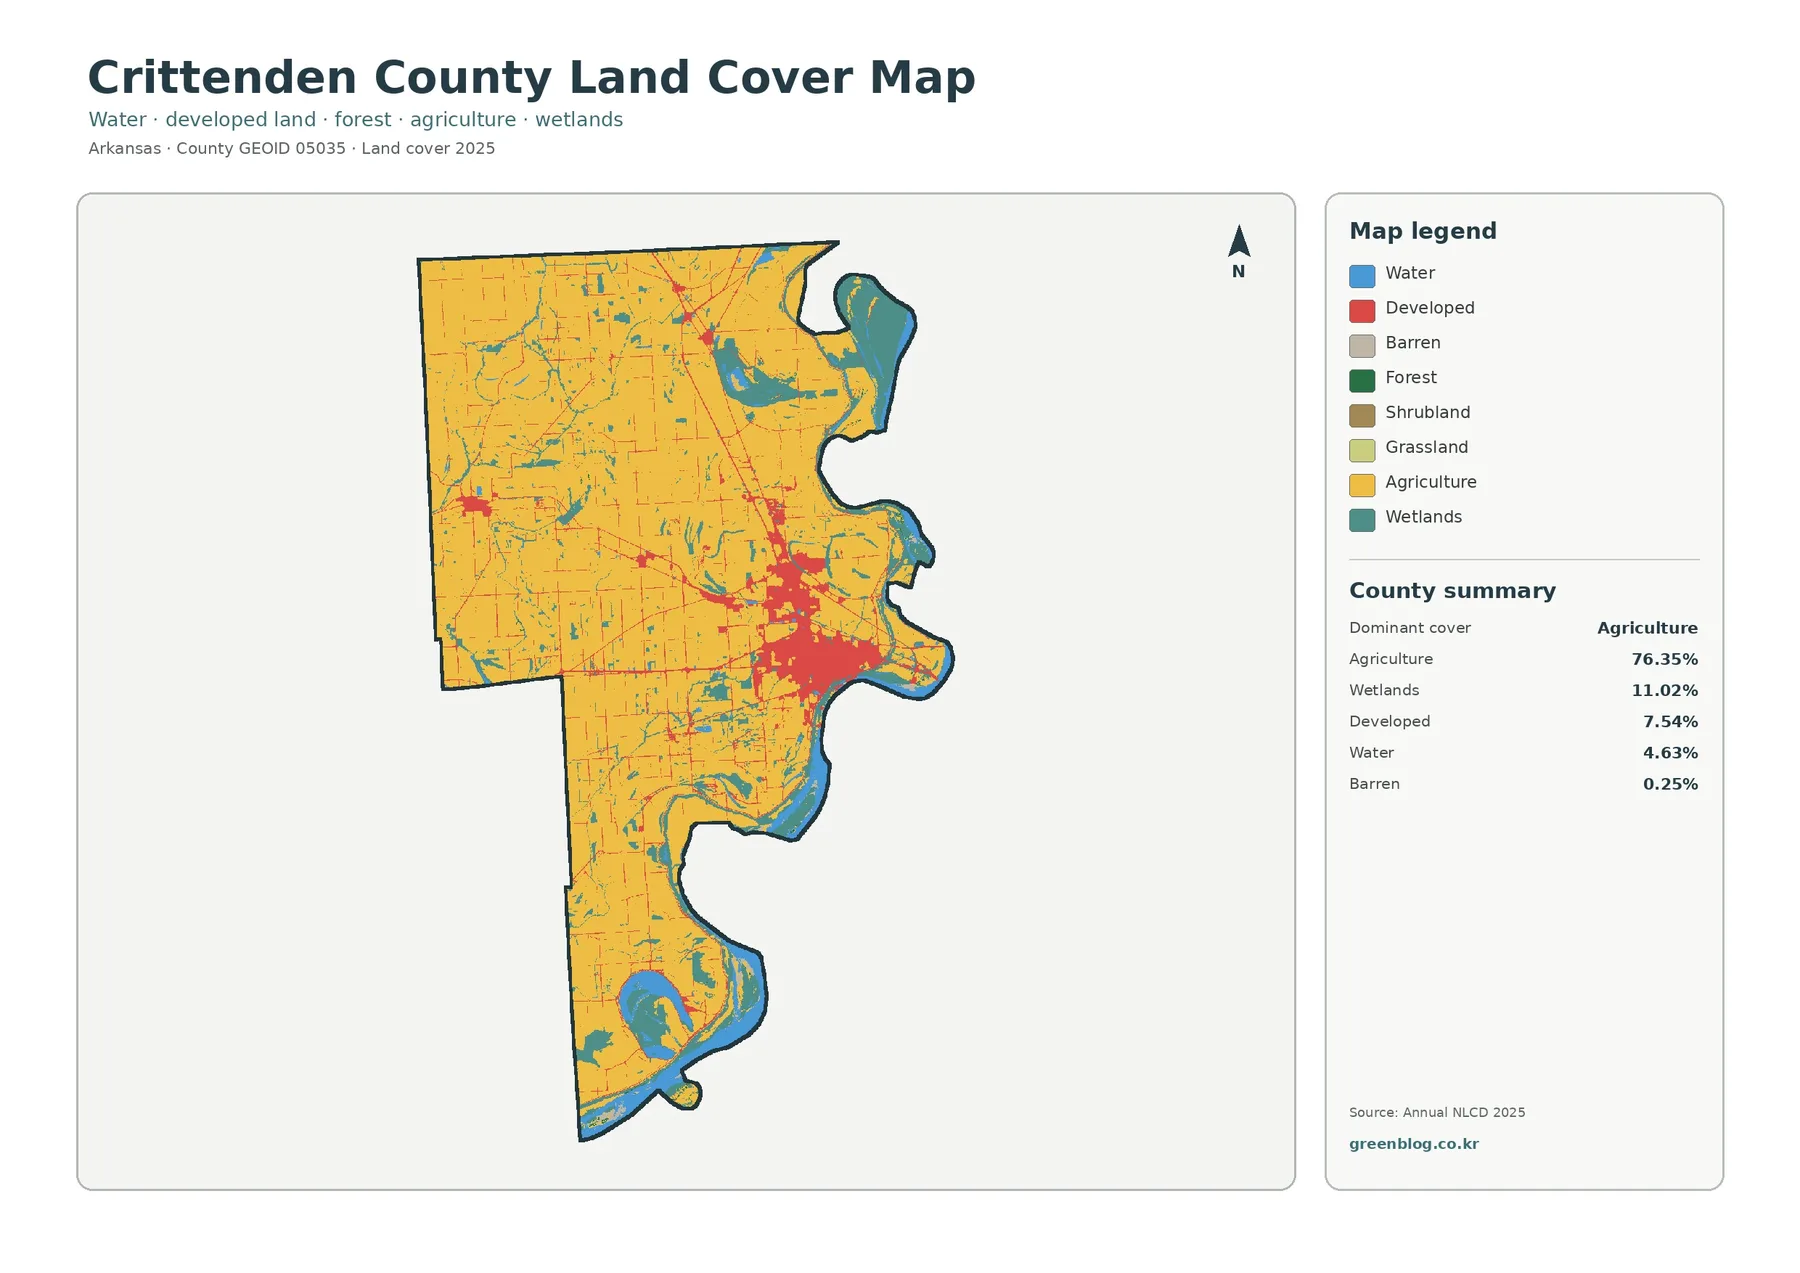
Agriculture is not merely the largest class in Crittenden County; it forms the continuous visual background across much of the map. The supplied 2025 summary assigns 76.35% of the county to agriculture. Wetlands account for 11.02%, developed cover for 7.54%, water for 4.63%, and barren land for 0.25%. A separate forest-and-farmland summary reports only 0.14% forest, along with 0.07% grassland and essentially no mapped shrubland. Those values describe a landscape very different from the forest-heavy counties found farther west in Arkansas.
The broad yellow agricultural areas are most continuous away from the eastern river edge and the main developed concentration. They extend from the northern block through the central interior and into the long southern portion of the county. Thin wetland and water traces break the fields in places, and a few developed centers interrupt the agricultural cover. That distribution matters because a countywide percentage alone cannot show whether farming is concentrated in one corner or spread across nearly the entire interior.
Wetlands and water define the eastern edge
The county’s wet classes are smaller than agriculture in total area, yet their location gives them unusual visual importance. Wetlands make up 11.02% and water 4.63%. Both become much more prominent near the winding eastern boundary, where large blue and teal areas follow broad river bends and lowland features. Additional narrow wetland traces run through the farm interior. In the southern part of the county, curved water and wetland shapes again interrupt the agricultural matrix rather than appearing as isolated dots.
These colors should be read as land-cover classes, not as flood zones, parcel boundaries, or regulatory wetland determinations. Land cover classifies what the surface was interpreted to be covered by at the observation time. It does not establish ownership, zoning, development rights, or the legal status of a wet area. River level, seasonal vegetation, and later land changes can also affect what a visitor would see on the ground today. For site-specific work, a current hydrologic or parcel source is needed in addition to this county-scale view.
The farm-focused view makes the lack of forest unmistakable
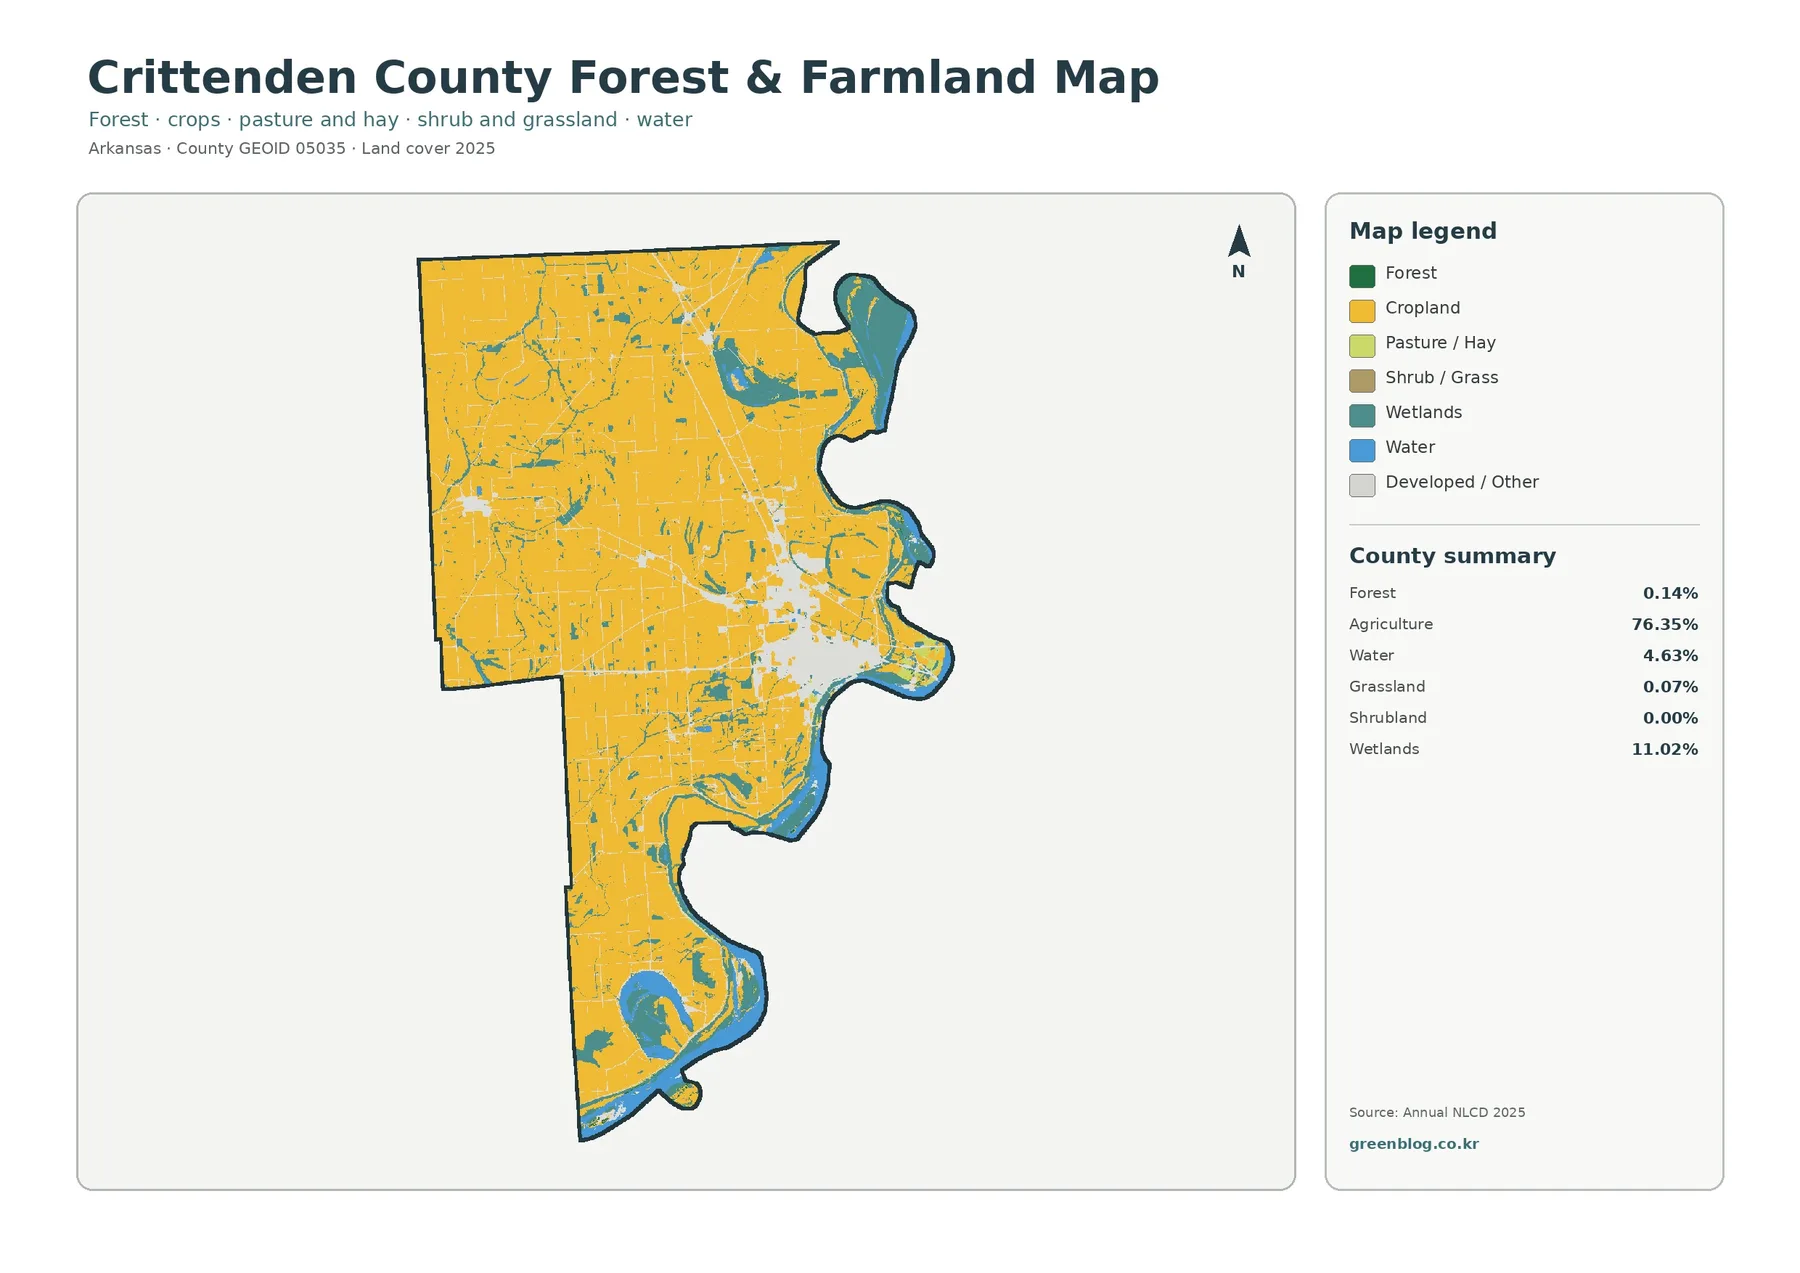
Removing much of the visual competition from developed land makes the agricultural pattern even clearer. The forest-and-farmland map retains the same 76.35% agriculture share while reporting forest at just 0.14%. Dark green therefore appears only in tiny fragments rather than large connected blocks. Grassland is 0.07%, shrubland is 0.00% in the supplied summary, and the water and wetland classes remain visible because they are important interruptions in an otherwise farm-dominated county.
A county-specific source adds useful context without turning the map into a crop map. The University of Arkansas System Division of Agriculture’s Crittenden County Extension program identifies row crops such as soybeans, cotton, rice, corn, grain sorghum, and wheat among its main agricultural interests. The land-cover image does not distinguish those crops from one another, and it does not show individual farm ownership. Its value is broader: it shows how strongly agricultural surface cover dominates the county and where water, wetlands, development, and very small nonfarm classes break that pattern.
Built land is compact rather than evenly scattered
Developed cover represents 7.54% of the county, far below the agricultural share, but its compact shape makes it one of the most noticeable features. A large red cluster occupies the east-central part of the map, and thinner developed lines extend outward from it. Smaller built patches appear farther west and north. This is a useful example of why visual prominence and percentage are different ideas: a relatively small countywide class can stand out when much of it is concentrated in one connected area.
The Crittenden County Extension office lists communities including Marion, West Memphis, Earle, Crawfordsville, Turrell, and Horseshoe Lake among the places it serves. Those names are not printed on the supplied land-cover graphics, so the safest approach is to use a separate road or place map when exact city identification matters. The land-cover layer is better suited to showing where developed surfaces form a cluster and where they give way to broad agricultural or wetland cover.
Impervious surface reveals the harder core inside developed land
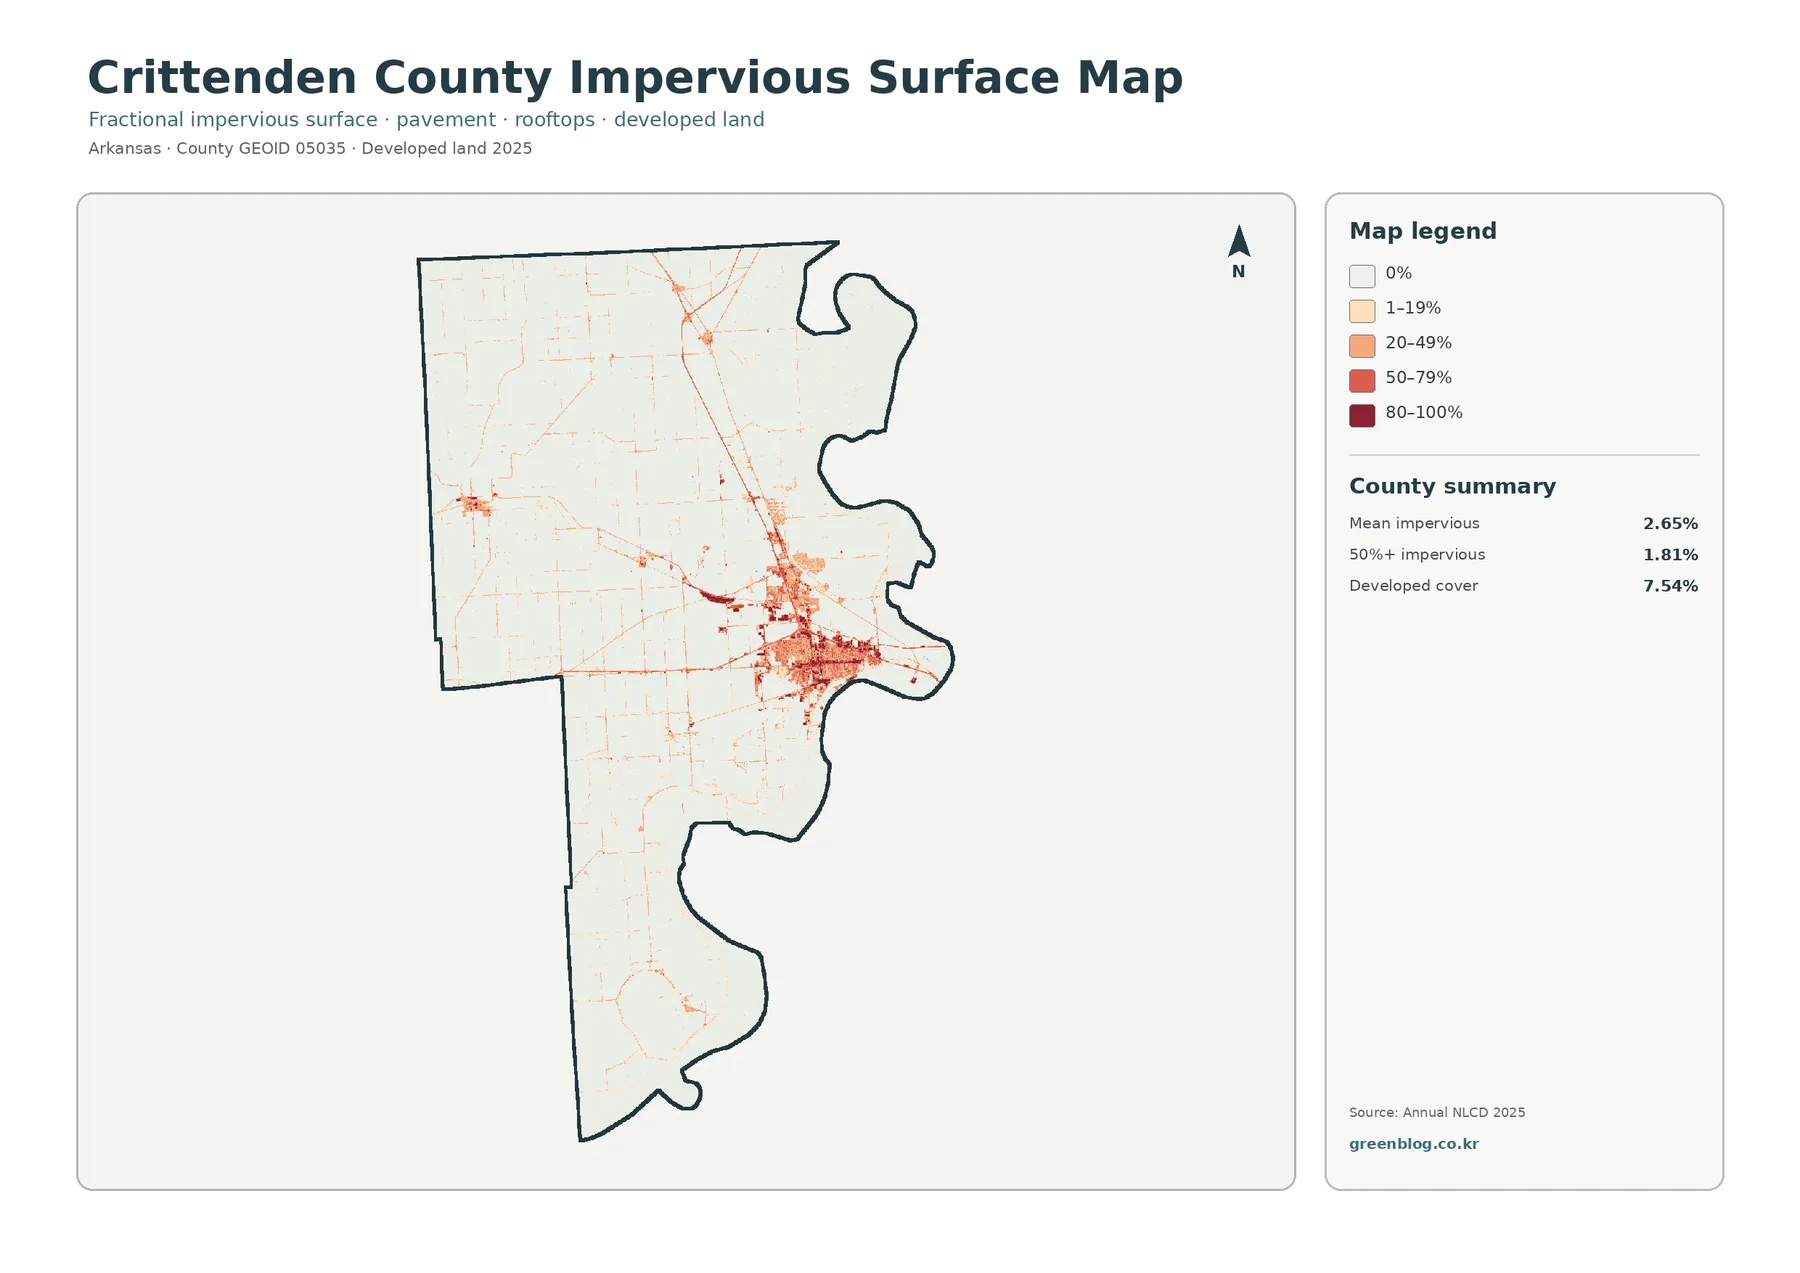
Impervious surface means pavement, rooftops, parking lots, and other surfaces that allow little water to soak into the ground. The countywide mean in the supplied impervious map is 2.65%. Areas with at least 50% impervious cover account for 1.81% of the county, while the broader developed land class covers 7.54%. Those numbers should not match. A developed cell can contain lawns, trees, bare soil, or other permeable surfaces along with buildings and pavement.
The darkest impervious colors are concentrated in the same east-central area where developed cover is most continuous. Elsewhere, hard surfaces appear mainly as narrow lines and small nodes set within a much lighter agricultural background. This layer is useful when a project needs to separate the general idea of “developed” land from the surfaces most likely to shed rainfall rapidly. It does not, however, provide storm-drain capacity, flood depth, or parcel-level runoff estimates.
The 1985–2025 comparison is a classification difference map
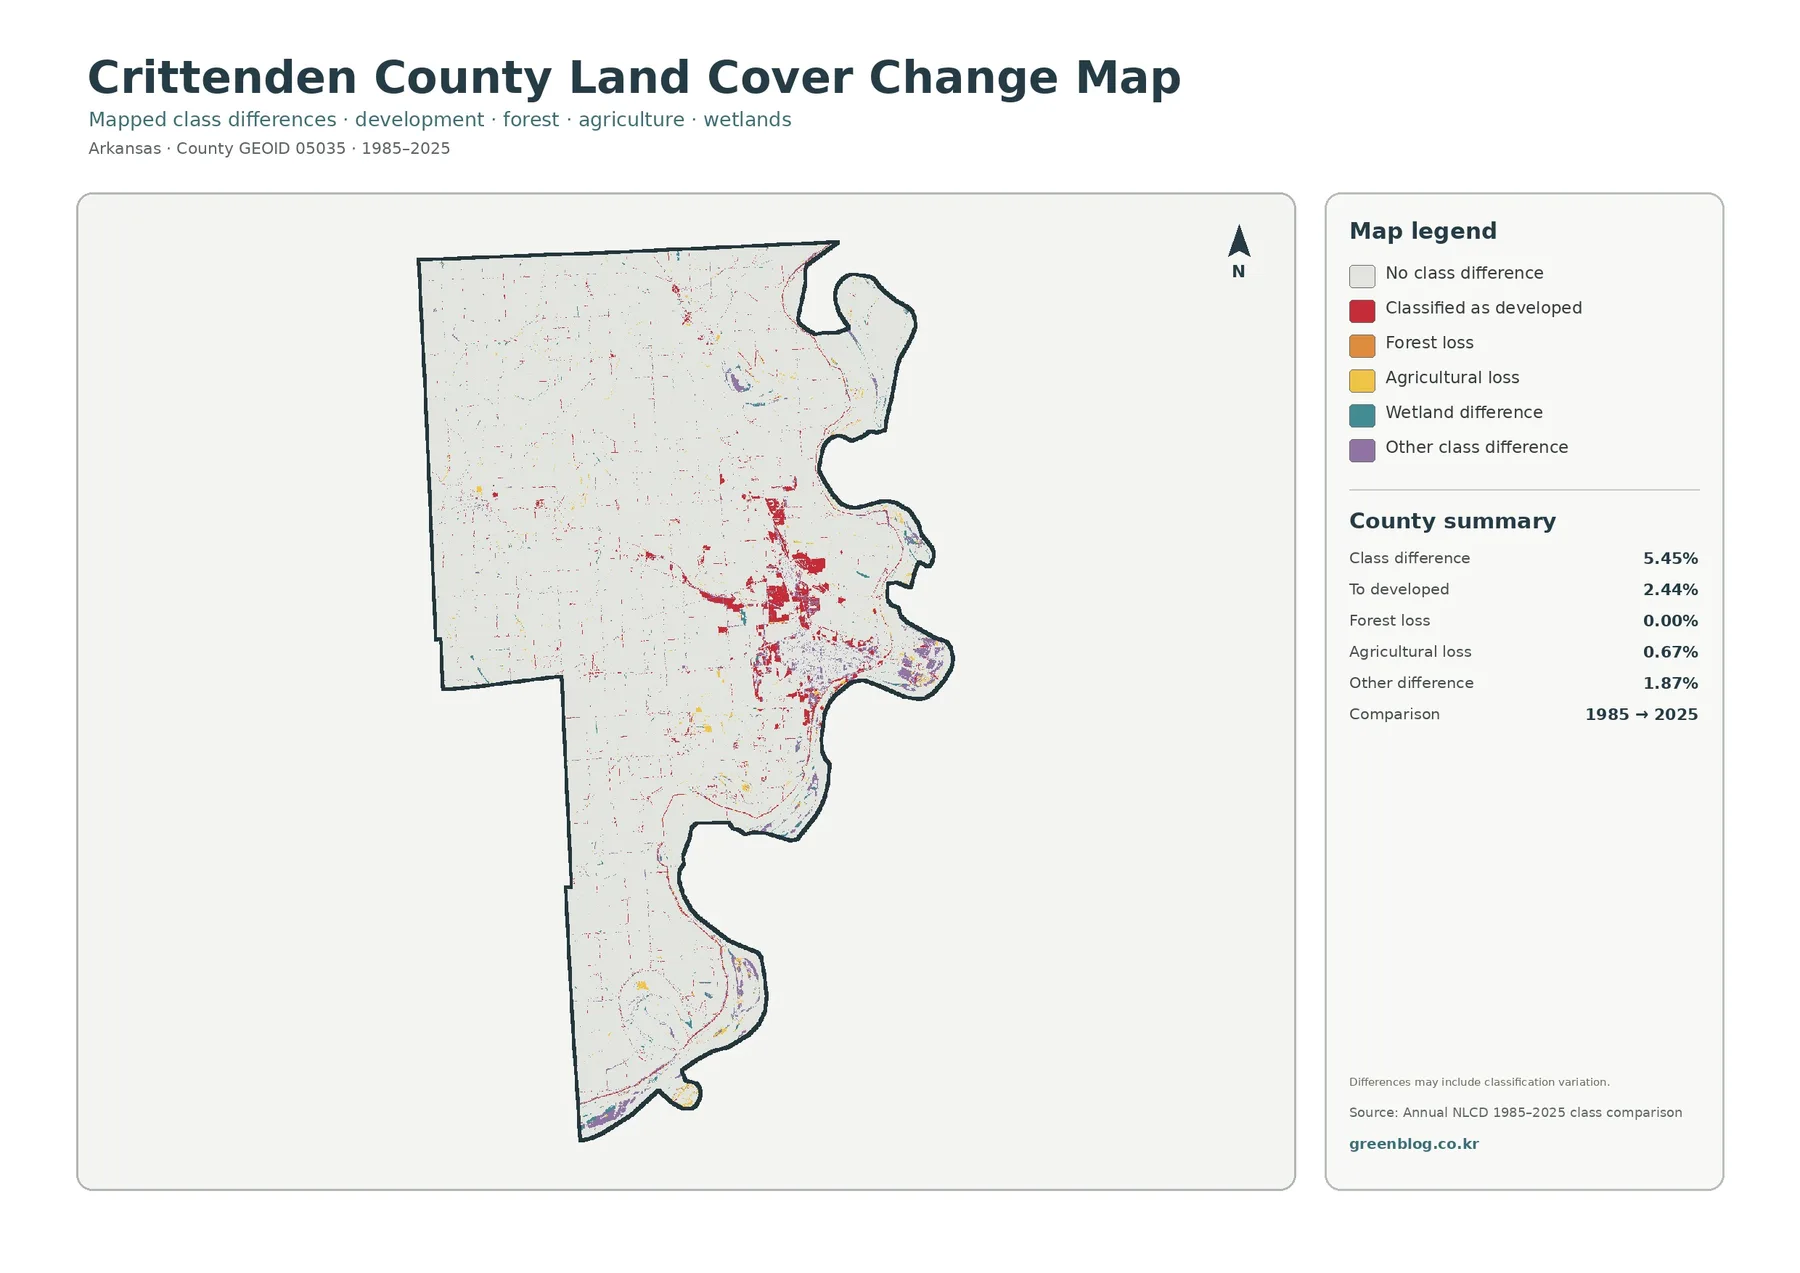
The long-term comparison reports class differences across 5.45% of the county. Of that total, 2.44% is mapped as a difference to developed cover, agricultural loss is 0.67%, forest loss is 0.00%, and other class differences account for 1.87%. The strongest concentration of change colors lies around the present east-central developed cluster. Smaller differences appear along parts of the eastern wet corridor and in scattered locations through the farm interior and southern section.
It would be misleading to call the full 5.45% a development rate or a measure of physical land loss. The layer compares two classified land-cover surfaces, 1985 and 2025. Some differences represent a new class, while others can reflect wetland variation, mixed pixels, classification methods, or conditions at the observation dates. The map itself notes that differences may include classification variation. That caution is especially important along narrow water features and boundaries where a 30-meter raster cell can contain more than one type of surface.
Compare the four views instead of reading each one alone
The general cover map answers the fastest question: what dominates Crittenden County in 2025? The answer is agriculture, with wetlands, developed land, and water forming the main secondary classes. The forest-and-farmland view then clarifies how little forest is present and keeps water and wetlands visible as breaks in the farm pattern. Moving to impervious cover narrows attention to hard built surfaces rather than the entire developed class. The change view adds a time comparison but requires the most caution because a class difference is not automatically a confirmed land-use event.
For classroom use, the set works well for explaining why percentage and location should be considered together. Agriculture dominates by area, while a small developed share is visually prominent because it is concentrated. Wetlands are much smaller than agriculture but form an important continuous edge in several places. For environmental or planning context, the four views can support questions about where farm cover approaches wet areas, where hard surfaces are concentrated, and where the historical comparison deserves a closer look using more detailed sources.
What the maps can and cannot resolve
Annual NLCD products are raster classifications. In practical terms, the landscape is represented as a grid, so a single cell summarizes an area rather than tracing every fence line, ditch, driveway, tree row, or building edge. A mixed pixel may contain more than one surface type even though the final product assigns a class or value to that location. These maps are therefore suitable for county-scale comparison and visual reference, not for surveying a property or deciding whether a particular parcel can be farmed, built on, or regulated.
Date matters as well. The current-cover maps represent the supplied 2025 classification, while the comparison uses 1985 and 2025. Construction, cropping, vegetation, water levels, and wet conditions can change after an observation year. The Crittenden County Arkansas Land Cover Map is best treated as a structured overview of the county’s surface pattern at those mapped dates. Current field conditions should be checked with newer imagery or an appropriate local source when the decision depends on what exists at a specific site today.
Download the Crittenden County four-map JPG set
The downloadable ZIP contains the four original JPG files represented on this page: general land cover, forest and farmland, impervious surface and developed land, and the 1985–2025 land-cover comparison. Each supplied JPG is 2480 × 1754 pixels at its original source resolution. Keeping the maps separate makes it easier to select one clear figure for a report or combine several views when the subject needs both current conditions and historical context.
Frequently Asked Questions
What is the dominant 2025 land-cover class in Crittenden County?
Agriculture is dominant at 76.35%. The next largest mapped classes are wetlands at 11.02%, developed cover at 7.54%, and water at 4.63%. Forest is only 0.14% in the supplied forest-and-farmland summary.
Why is developed cover 7.54% while mean impervious cover is only 2.65%?
Developed land is a broader classification that can include permeable surfaces such as grass, trees, and soil. Impervious cover measures hard surfaces such as pavement and roofs, so the countywide impervious average is expected to be lower than the full developed-land share.
Does the 5.45% class difference mean 5.45% of the county was developed?
No. The 5.45% figure is the share of cells whose mapped class differs between the 1985 and 2025 comparison. The supplied summary separately identifies 2.44% as differences to developed cover, and classification variation can also contribute to the comparison.
Map File Information
The ZIP contains four original Crittenden County JPG maps covering 2025 land cover, farm and forest patterns, impervious surface, and 1985–2025 class differences.
- File Type: Four JPG files in one ZIP archive
Related Maps
- A Craighead County Arkansas Land Cover Map
- Arkansas County Arkansas Land Cover Map
- Ashley County Arkansas Land Cover Map
Sources and Reference Data
- MRLC Annual NLCD Data — official access point for Annual NLCD land-cover products.
- USGS Annual NLCD Land Cover Classification — definitions and background for interpreting land-cover classes.
- University of Arkansas Division of Agriculture — Crittenden County Programs — county-specific agriculture and natural-resources information, including the local row-crop focus.
- U.S. Census Bureau TIGER/Line Shapefiles — boundary and geographic reference data.
Green Map creates custom-edited map images using open geographic data sources such as geoBoundaries, Natural Earth, OpenStreetMap, and government open data.
These maps are edited visual materials, not raw data files, and are provided for education, documents, presentations, and graphic reference.