This page brings together four 2025 land-cover views of Yuma County, Arizona and provides the original JPG maps in one downloadable ZIP. Shrubland is the dominant mapped class at 75.93%, while barren land accounts for 14.13%. Agriculture covers 5.05% and forms its clearest blocks in the west and along a narrower band across the middle of the county. Developed land is only 1.96% overall, but its strongest cluster is also concentrated in the west.
Table of Contents
A broad shrub-and-barren landscape with a much busier western edge
Yuma County looks simple at first because shrubland occupies most of the outline, especially across the north and east. A closer look shows a second major component: large barren patches in the southwest, south, and several central areas. These two classes create the dominant background of the county. Agriculture and developed land occupy much smaller shares, yet their tight clustering makes them visually important. The western part of the map contains the largest concentration of cropland colors, developed red, and several adjoining wetland or other non-shrub surfaces.
Reading the 2025 land-cover map beyond the dominant class
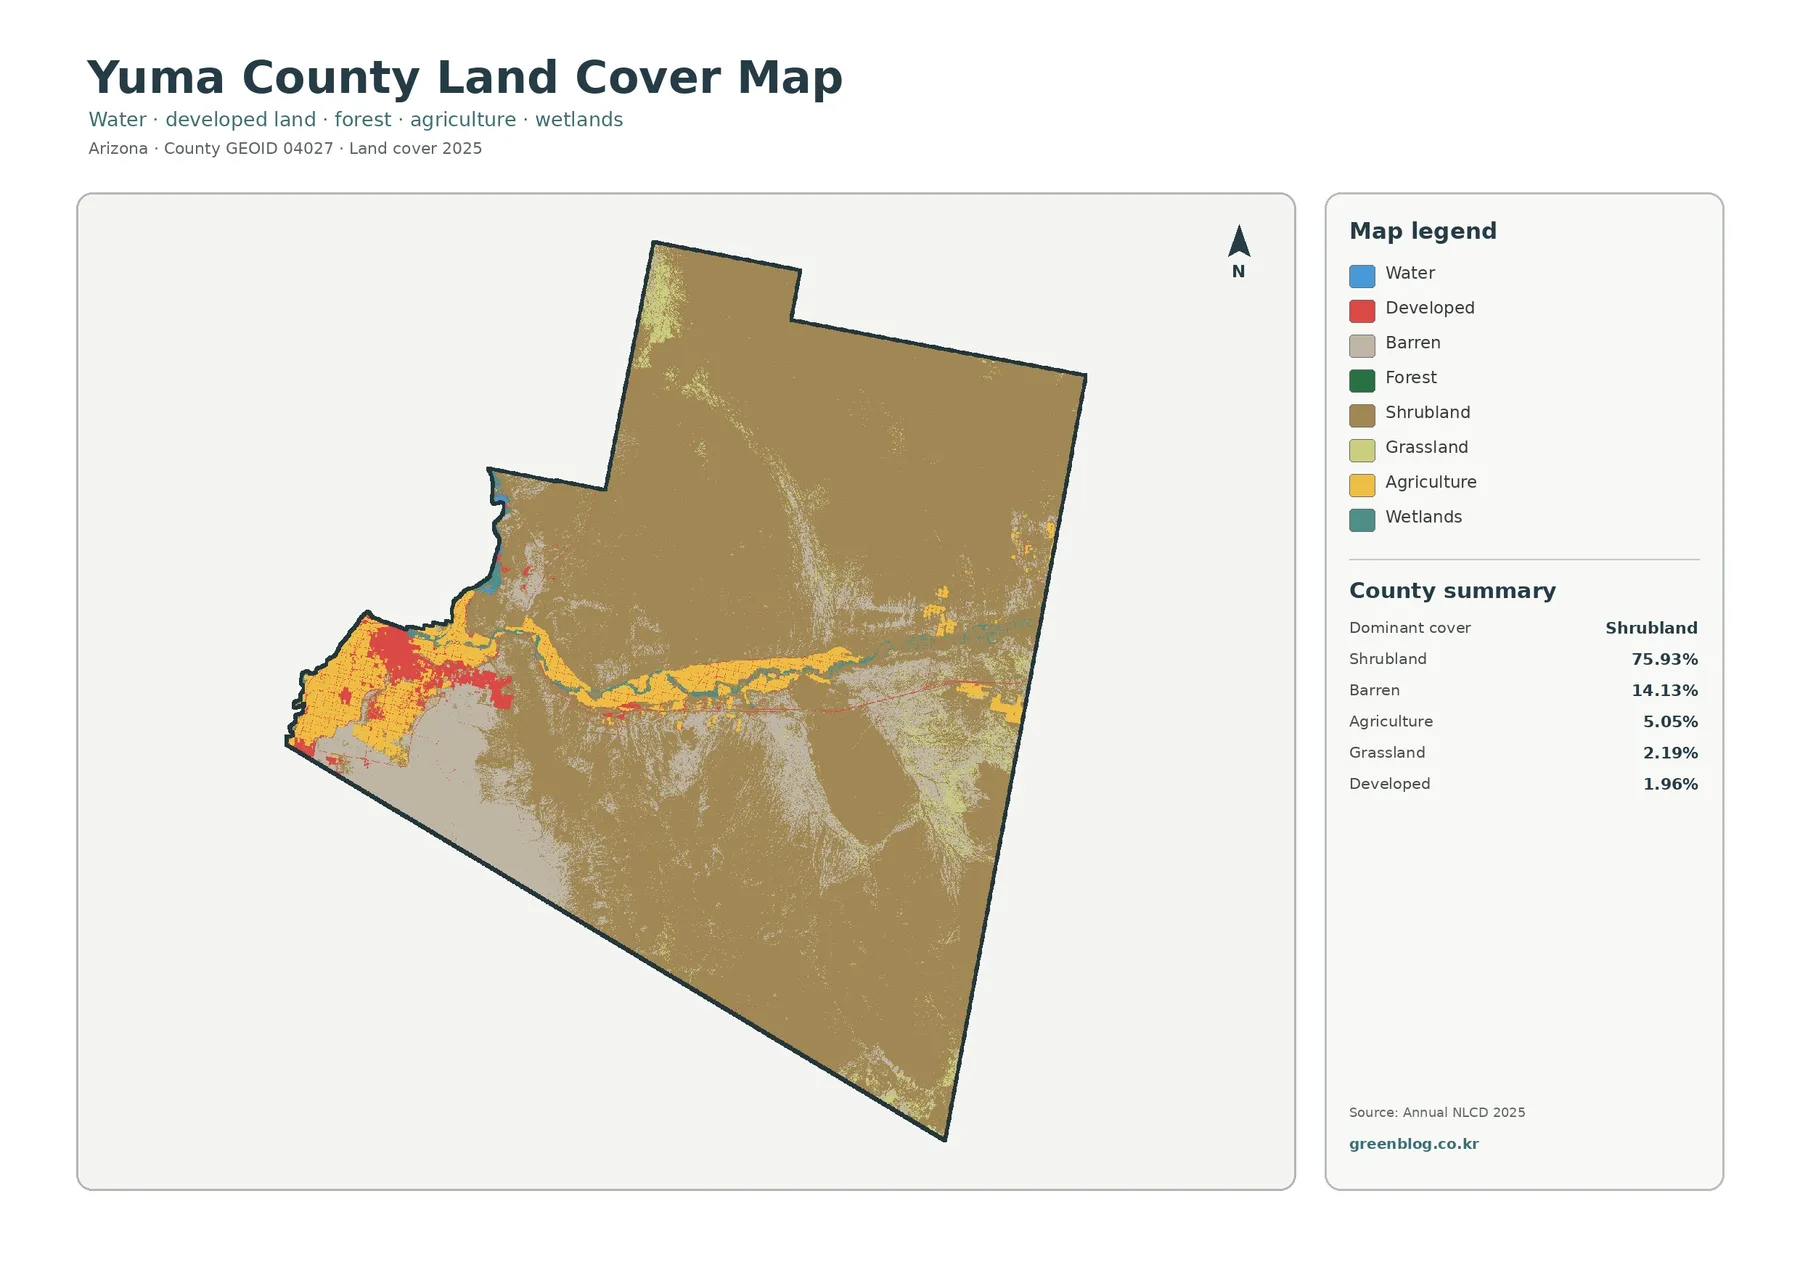
The general land-cover map is the best place to start because it keeps all of the major classes visible at once. Shrubland, shown in brown, covers 75.93% and extends through most of the northern and eastern portions of the county. Barren land is the second-largest class at 14.13%. Its gray areas are especially noticeable in the southwest and south, with additional patches extending through the central and eastern parts of the map. Grassland is much smaller at 2.19% and does not form the same countywide background.
Agriculture accounts for 5.05%. The largest yellow blocks are packed into the west, while thinner agricultural areas follow a central east-west strip and smaller clusters appear farther east. Developed land represents 1.96%, with the most obvious red concentration in the same broad western area. Wetlands and water are minor by area but still useful for orientation. The forest-and-farmland summary reports 0.66% wetlands and 0.06% water, and the map shows these classes close to the central band and parts of the western edge.
Farmland stands out clearly even though forest rounds to 0.00%
The forest-and-farmland view simplifies the color scheme so agriculture can be compared directly with shrub and grass, wetlands, water, and the remaining developed or other surfaces. Its county summary reports 5.05% agriculture, 75.93% shrubland, 2.19% grassland, 0.66% wetlands, 0.06% water, and 0.00% forest. The forest value should be read carefully. A rounded 0.00% in this classification does not mean there are literally no trees anywhere in Yuma County; it means the mapped forest class does not register as a measurable rounded county share in the supplied 2025 summary.
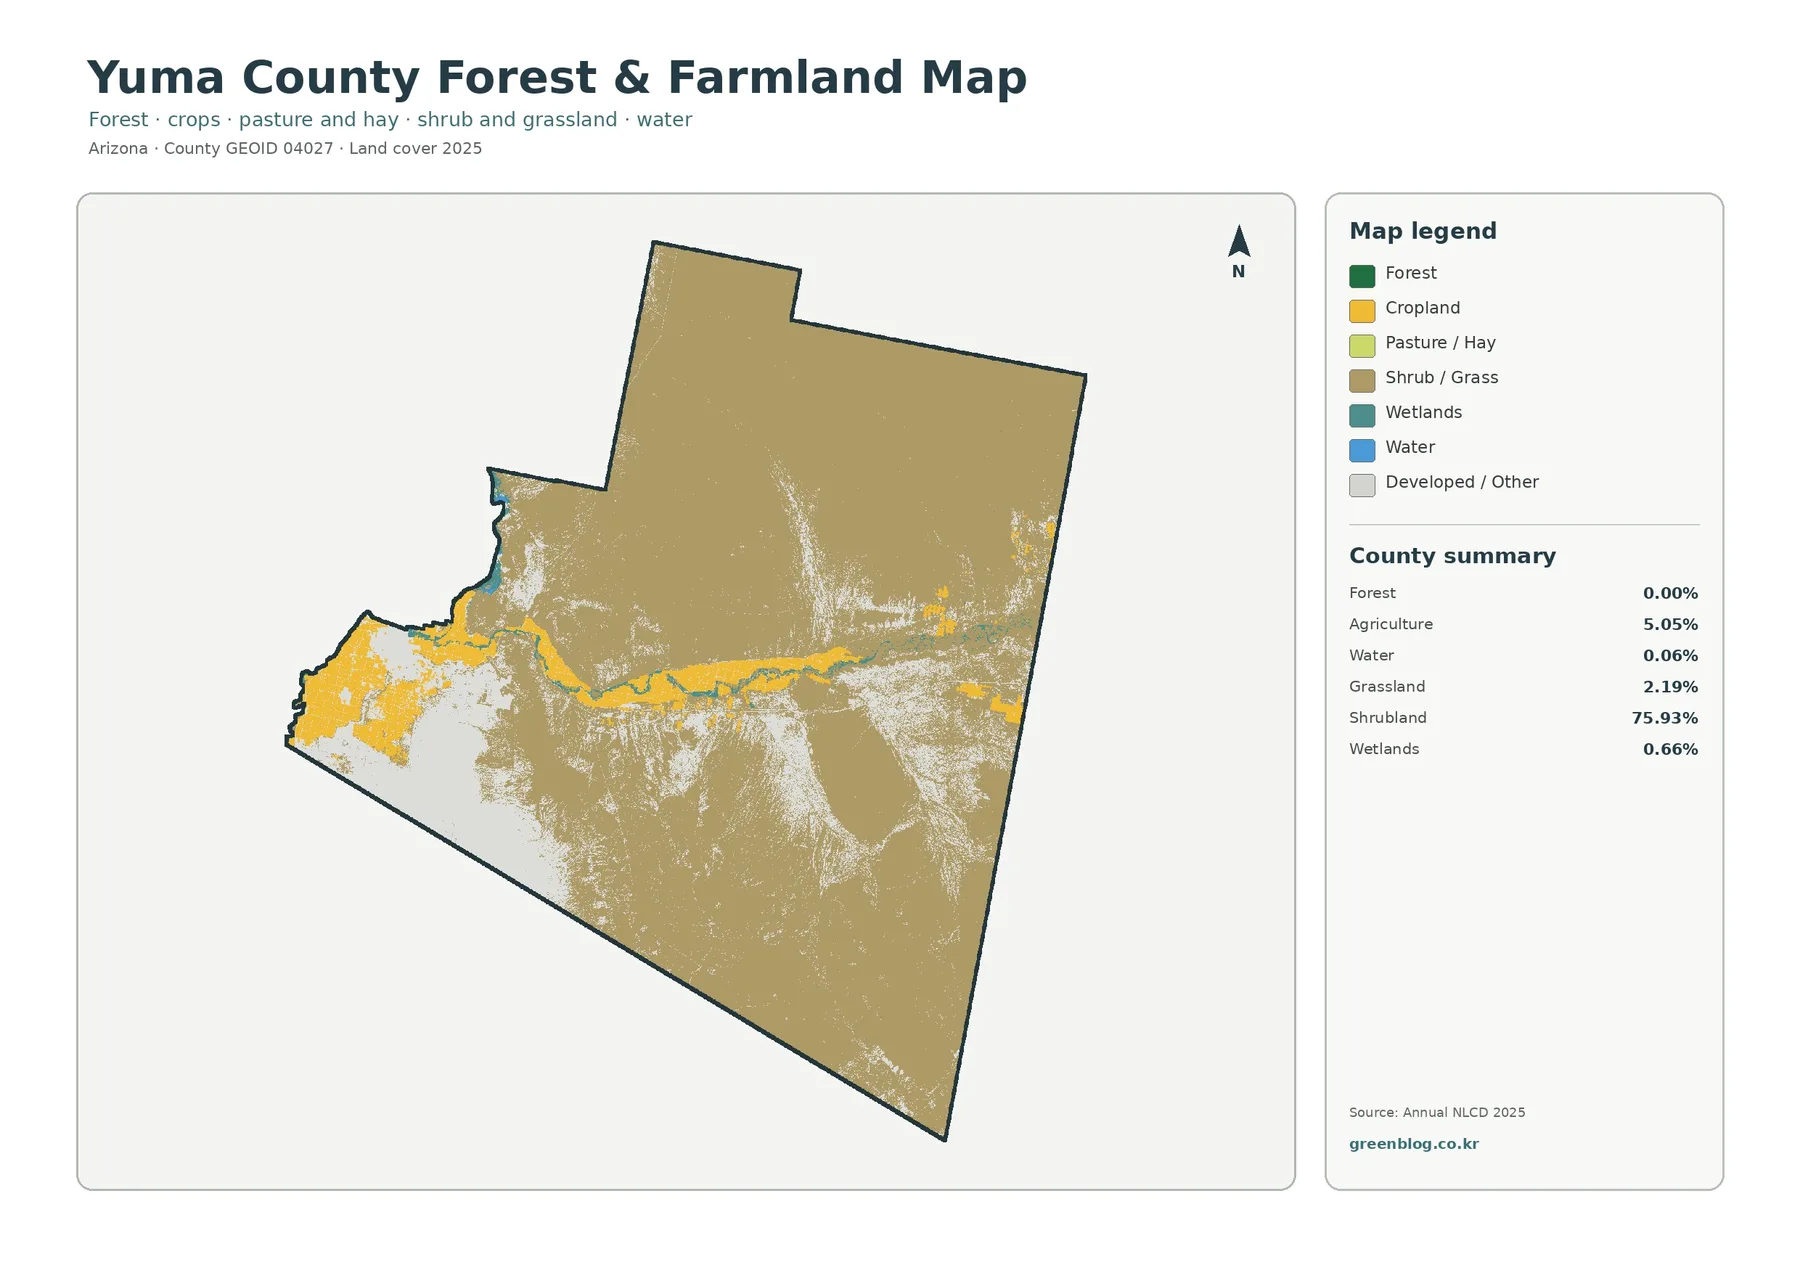
Once the other classes are muted, the agricultural pattern becomes easier to follow. Broad cropland blocks occupy the west, and smaller yellow patches continue along the middle of the county. A few additional groups appear near the eastern side. The surrounding landscape remains overwhelmingly shrub and grass, with large areas of developed or other surfaces shown in a neutral color. This makes the map useful when the question is not “What covers the county overall?” but “Where are the agricultural surfaces within the larger desert landscape?”
Low countywide impervious values hide a concentrated western footprint
Impervious surface means hard cover such as pavement, rooftops, and parking areas where water does not easily soak into the ground. The supplied summary reports a mean impervious value of 0.74%. Areas at 50% or more impervious cover make up 0.55%, while the land-cover map classifies 1.96% of the county as developed. These numbers are related but they measure different things. A developed land-cover cell can still contain soil, vegetation, or open space, so developed acreage does not need to match the average impervious percentage.
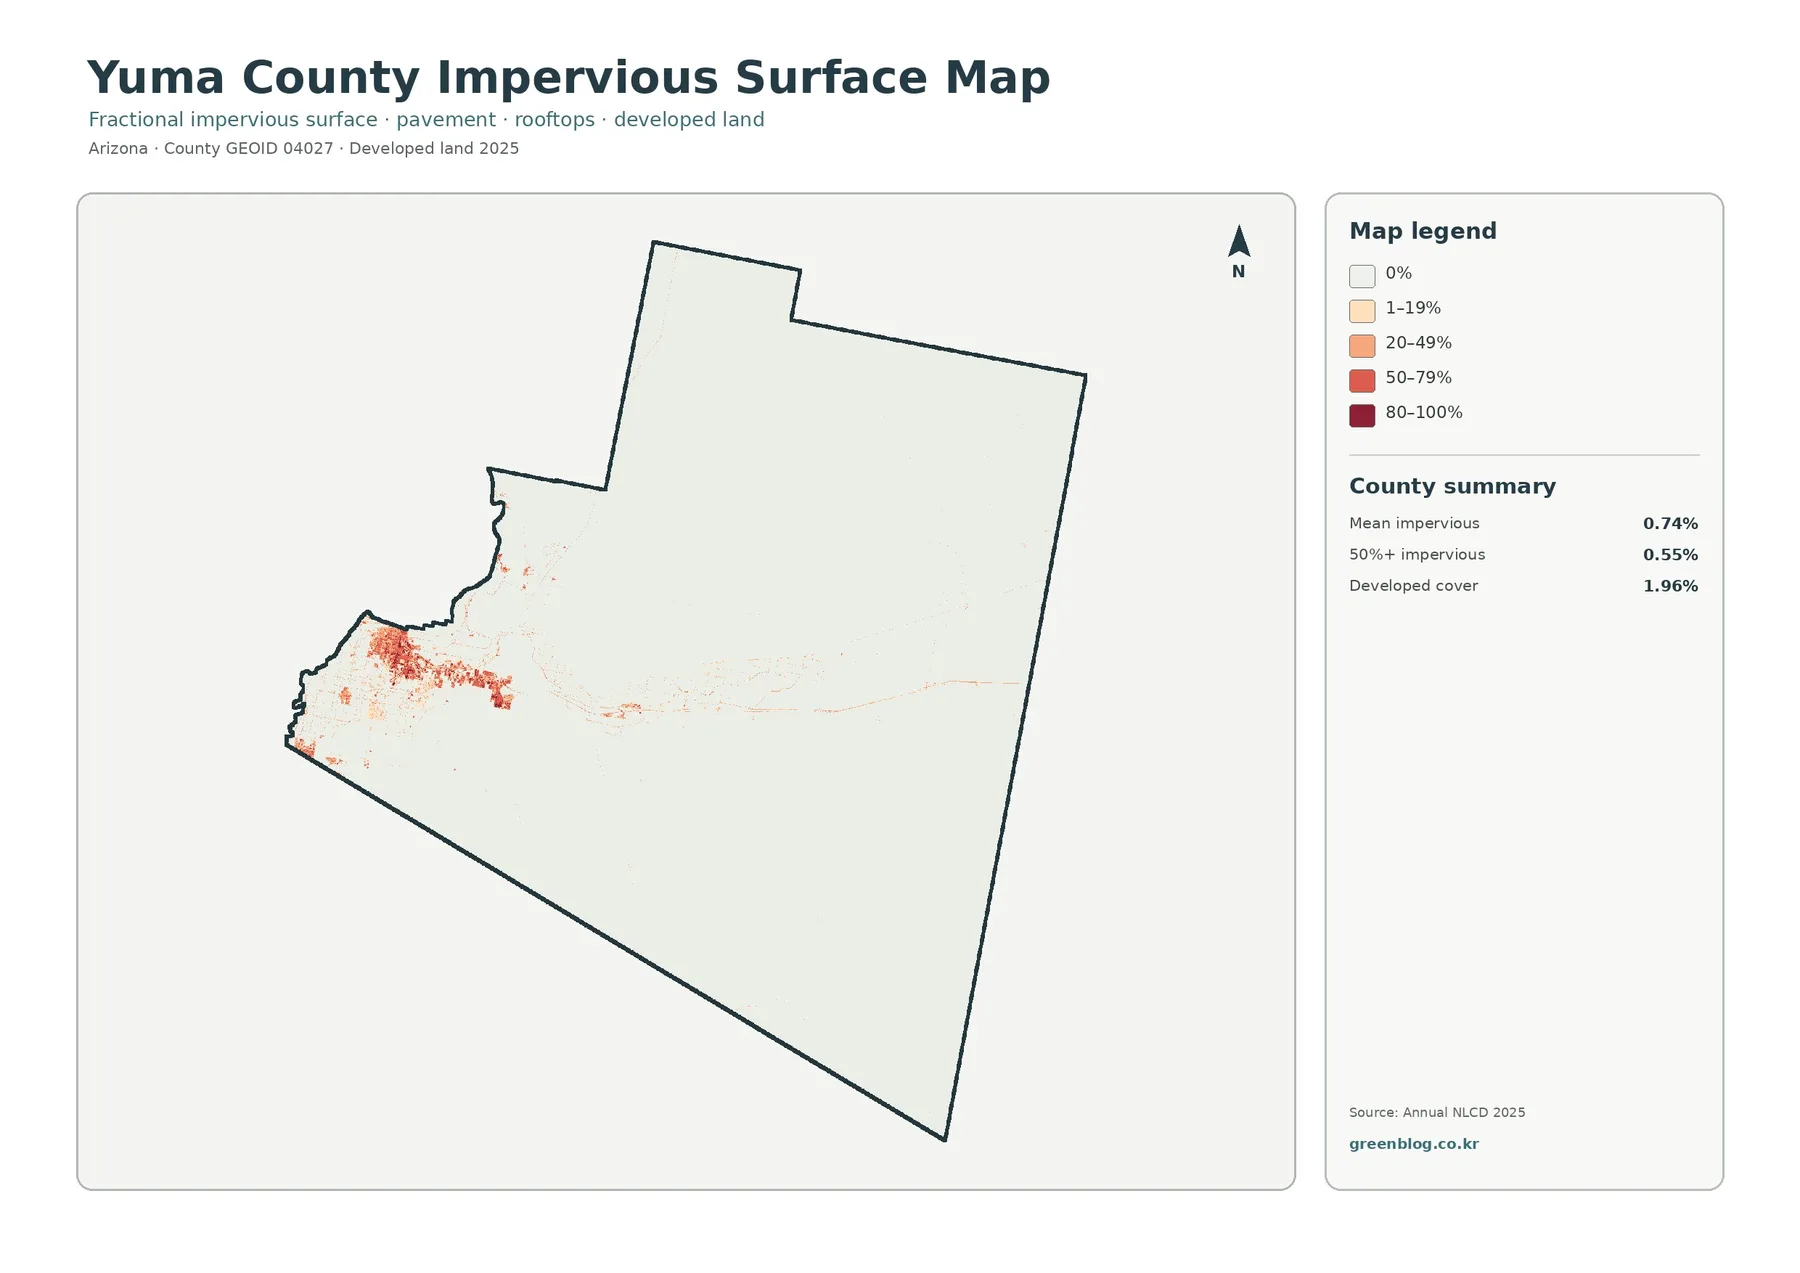
Most of the county is nearly white on this map, showing very low impervious values across the broad northern, eastern, and southeastern areas. The strongest orange and red cluster lies in the west. It corresponds broadly with the developed concentration on the general land-cover map, while thin lines and scattered points extend away from the main cluster. A faint east-west network is also visible across the middle, but it remains much less intense than the western group.
The 1985–2025 map records 9.85% class difference, not one single type of change
The change map compares the 1985 and 2025 classifications and marks cells where the mapped class differs. The county summary reports 9.85% class difference. Within that total, 0.94% is classified as a change to developed land, 0.71% as agricultural loss, 0.00% as forest loss, and 8.14% as other class difference. The dominance of the “other” category is important. This is not simply a map of urban growth or farmland conversion; it is a broader comparison of classification outcomes across two dates.
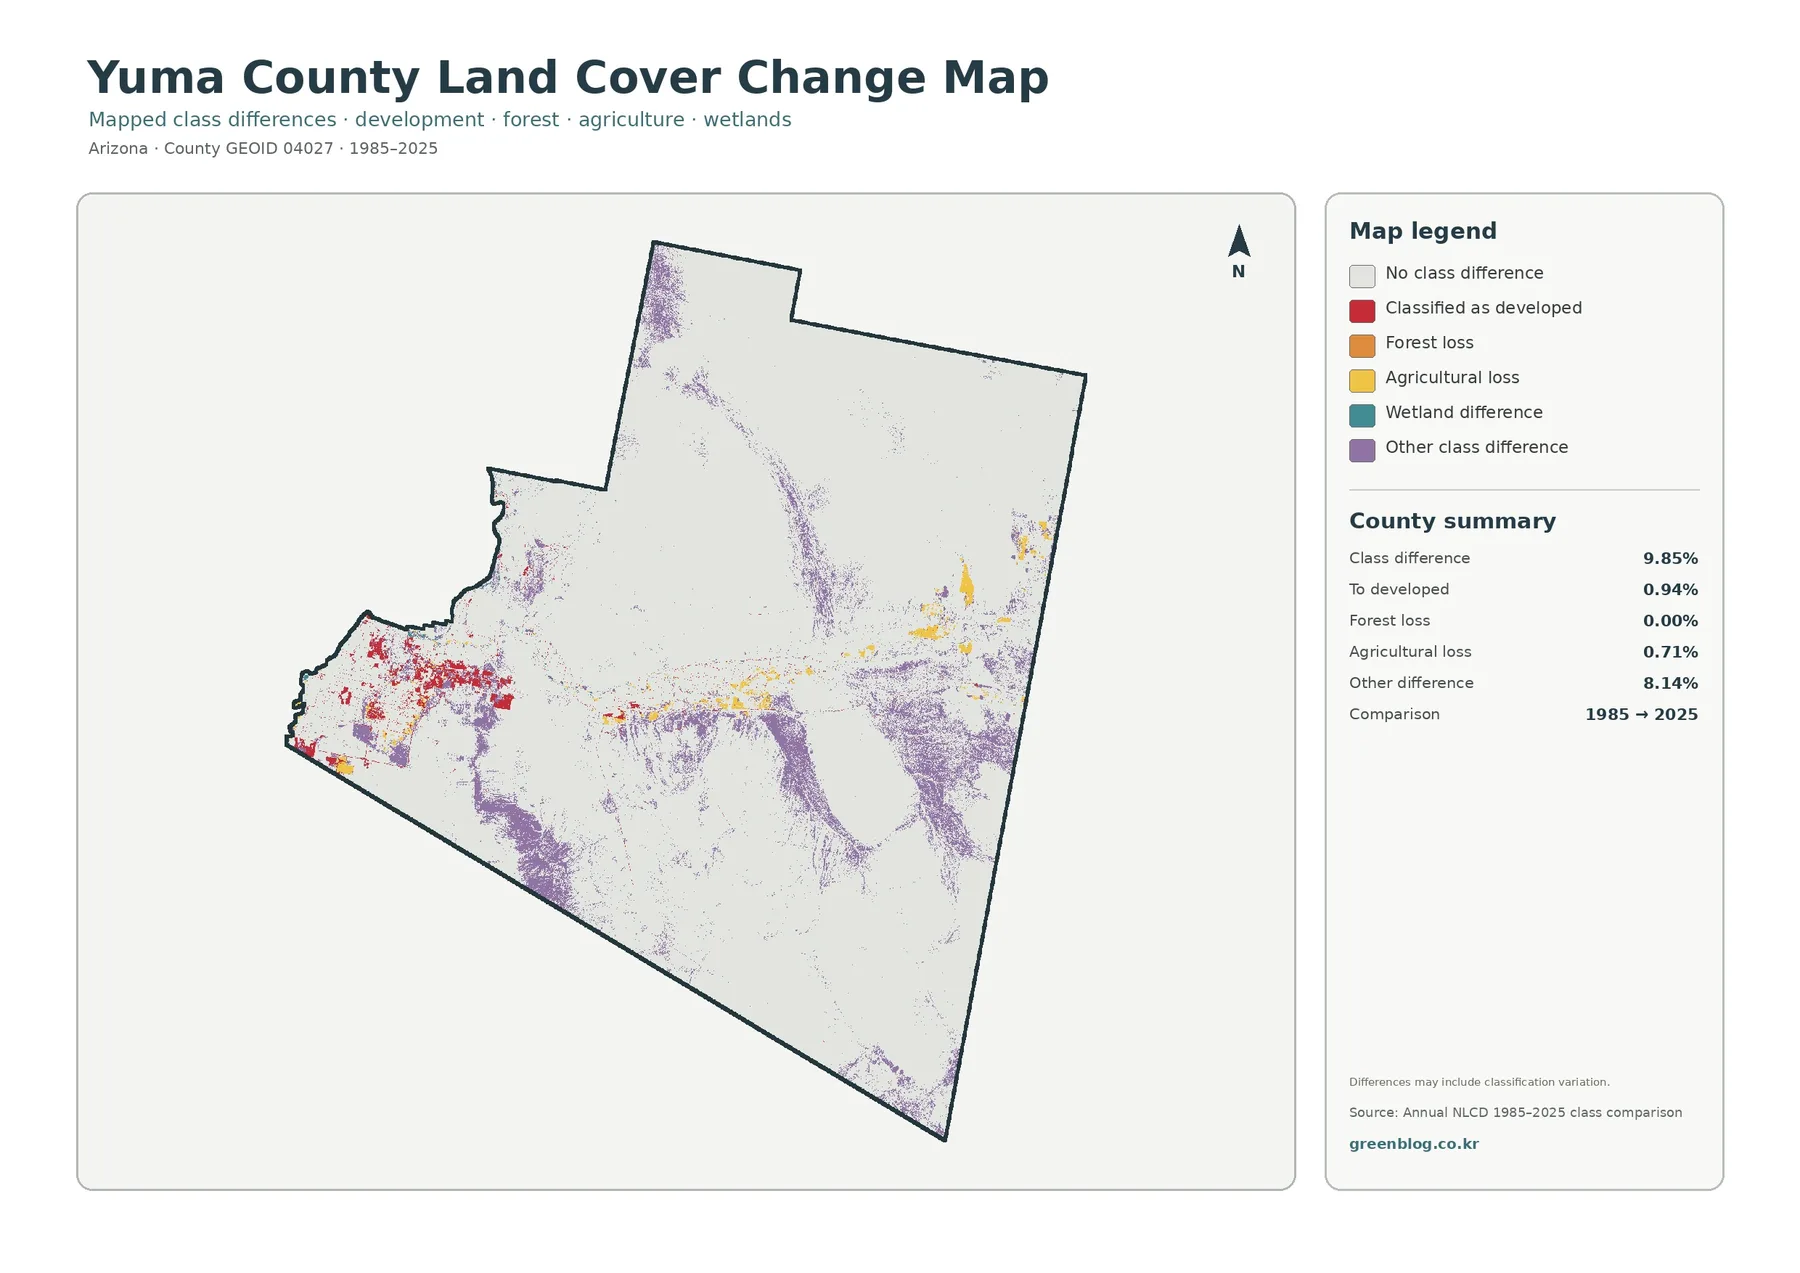
Red change-to-developed cells are most concentrated in the west, where the current developed and impervious maps also show their strongest clusters. Yellow agricultural-loss areas appear in parts of the west, along the central band, and in smaller eastern locations. Purple “other class difference” covers a much broader set of patches across the south and middle, with additional areas in the northwest. That broad distribution matches the 8.14% summary and shows why the overall 9.85% figure cannot be assigned to one cause.
Download the four original JPG maps and keep the legends with them
The download contains four JPG files: the general land-cover map, the forest-and-farmland map, the impervious-surface/developed-land map, and the 1985–2025 land-cover change map. They can be used individually or placed side by side for comparison. A classroom handout might pair the general map with the farmland view, while a presentation about developed surfaces can add the impervious map and then use the change map to discuss where classifications differ between the two dates.
Choosing the right map for agriculture, development, and planning context
Official planning documents answer a different set of questions. Yuma County’s 2030 Comprehensive Plan lists planning areas such as North Gila, Yuma Mesa, and Northwest Yuma and addresses land-use planning rather than satellite land-cover classification. That distinction is useful in project work: use the land-cover maps to describe the mapped surface, and use the county’s planning documents when you need official planning areas, land-use designations, or policy context.
Thirty-meter raster cells generalize small features and mixed surfaces
Annual NLCD land cover is a raster product built from 30-meter cells. In plain language, the landscape is divided into a grid and each cell receives a representative classification. A single cell can contain more than one real-world surface, such as bare soil, shrubs, a narrow road, the edge of a field, or part of a building. The resulting map is therefore a generalized county-scale picture rather than a parcel survey.
Frequently Asked Questions
What is the dominant land-cover class in Yuma County?
Shrubland is the dominant 2025 class at 75.93%. Barren land follows at 14.13%, agriculture at 5.05%, grassland at 2.19%, and developed land at 1.96%. The forest-and-farmland summary also lists 0.66% wetlands, 0.06% water, and 0.00% forest. These are countywide land-cover classifications, not parcel-level land-use or ownership values.
Why is developed land 1.96% while mean impervious surface is only 0.74%?
Developed land is a land-cover class, while impervious surface measures the share of a cell covered by hard surfaces such as pavement and rooftops. A developed cell can include soil, vegetation, and open areas, so the values do not need to match. The supplied map also reports that areas at 50% or more impervious cover account for 0.55%, showing that highly hardened surfaces are limited to a small portion of the county.
Does the 9.85% class difference mean that 9.85% of the county was physically converted?
No. The 9.85% figure is the share of cells with different mapped classes in the 1985 and 2025 comparison. It includes 0.94% classified as change to developed, 0.71% agricultural loss, and 8.14% other class difference, while forest loss is 0.00%. Classification variation and mixed pixels can also contribute, so a specific local cause needs to be checked with additional dated imagery or records.
Map File Information
Yuma County Land Cover Four-Map Package
- File Type: Four JPG files in one ZIP archive
Related Maps
- Apache County Arizona Land Cover Map
- Cochise County Arizona Land Cover Map
- Coconino County Arizona Land Cover Map
Sources and reference material
- MRLC Annual NLCD Data — Official access to Annual NLCD land-cover and related datasets.
- USGS Annual NLCD Land Cover Classification — Official background on the land-cover classes used in Annual NLCD.
- U.S. Census Bureau TIGER/Line Shapefiles — Official geographic boundary data for counties and other census geographies.
- Yuma County 2030 Comprehensive Plan — Official county planning context, including planning areas and land-use elements.
- University of Arizona Cooperative Extension – Yuma County — County-specific agricultural, soil, and community education resources.
Green Map creates custom-edited map images using open geographic data sources such as geoBoundaries, Natural Earth, OpenStreetMap, and government open data.
These maps are edited visual materials, not raw data files, and are provided for education, documents, presentations, and graphic reference.