The Cochise County Arizona Land Cover Map presents a county where shrubland is the clear baseline rather than a minor background class. The 2025 summary assigns 87.54% of the county to shrubland, with forest at 5.81%, agriculture at 2.75%, developed land at 2.06%, and grassland at 0.81%. Against that broad dry-land cover, mountain forest patches, agricultural blocks, and a handful of developed clusters stand out sharply.
Four map views are included: general land cover, forest and farmland, impervious surface/developed land, and a 1985–2025 class-difference map. The WebP images are for on-page viewing, while the four original JPG maps can be downloaded together from the file box below. They are useful for county-scale comparison, teaching, presentations, and environmental reference, but they are not parcel, zoning, ownership, or development-permission maps.
Table of Contents
Shrubland sets the frame for nearly every comparison
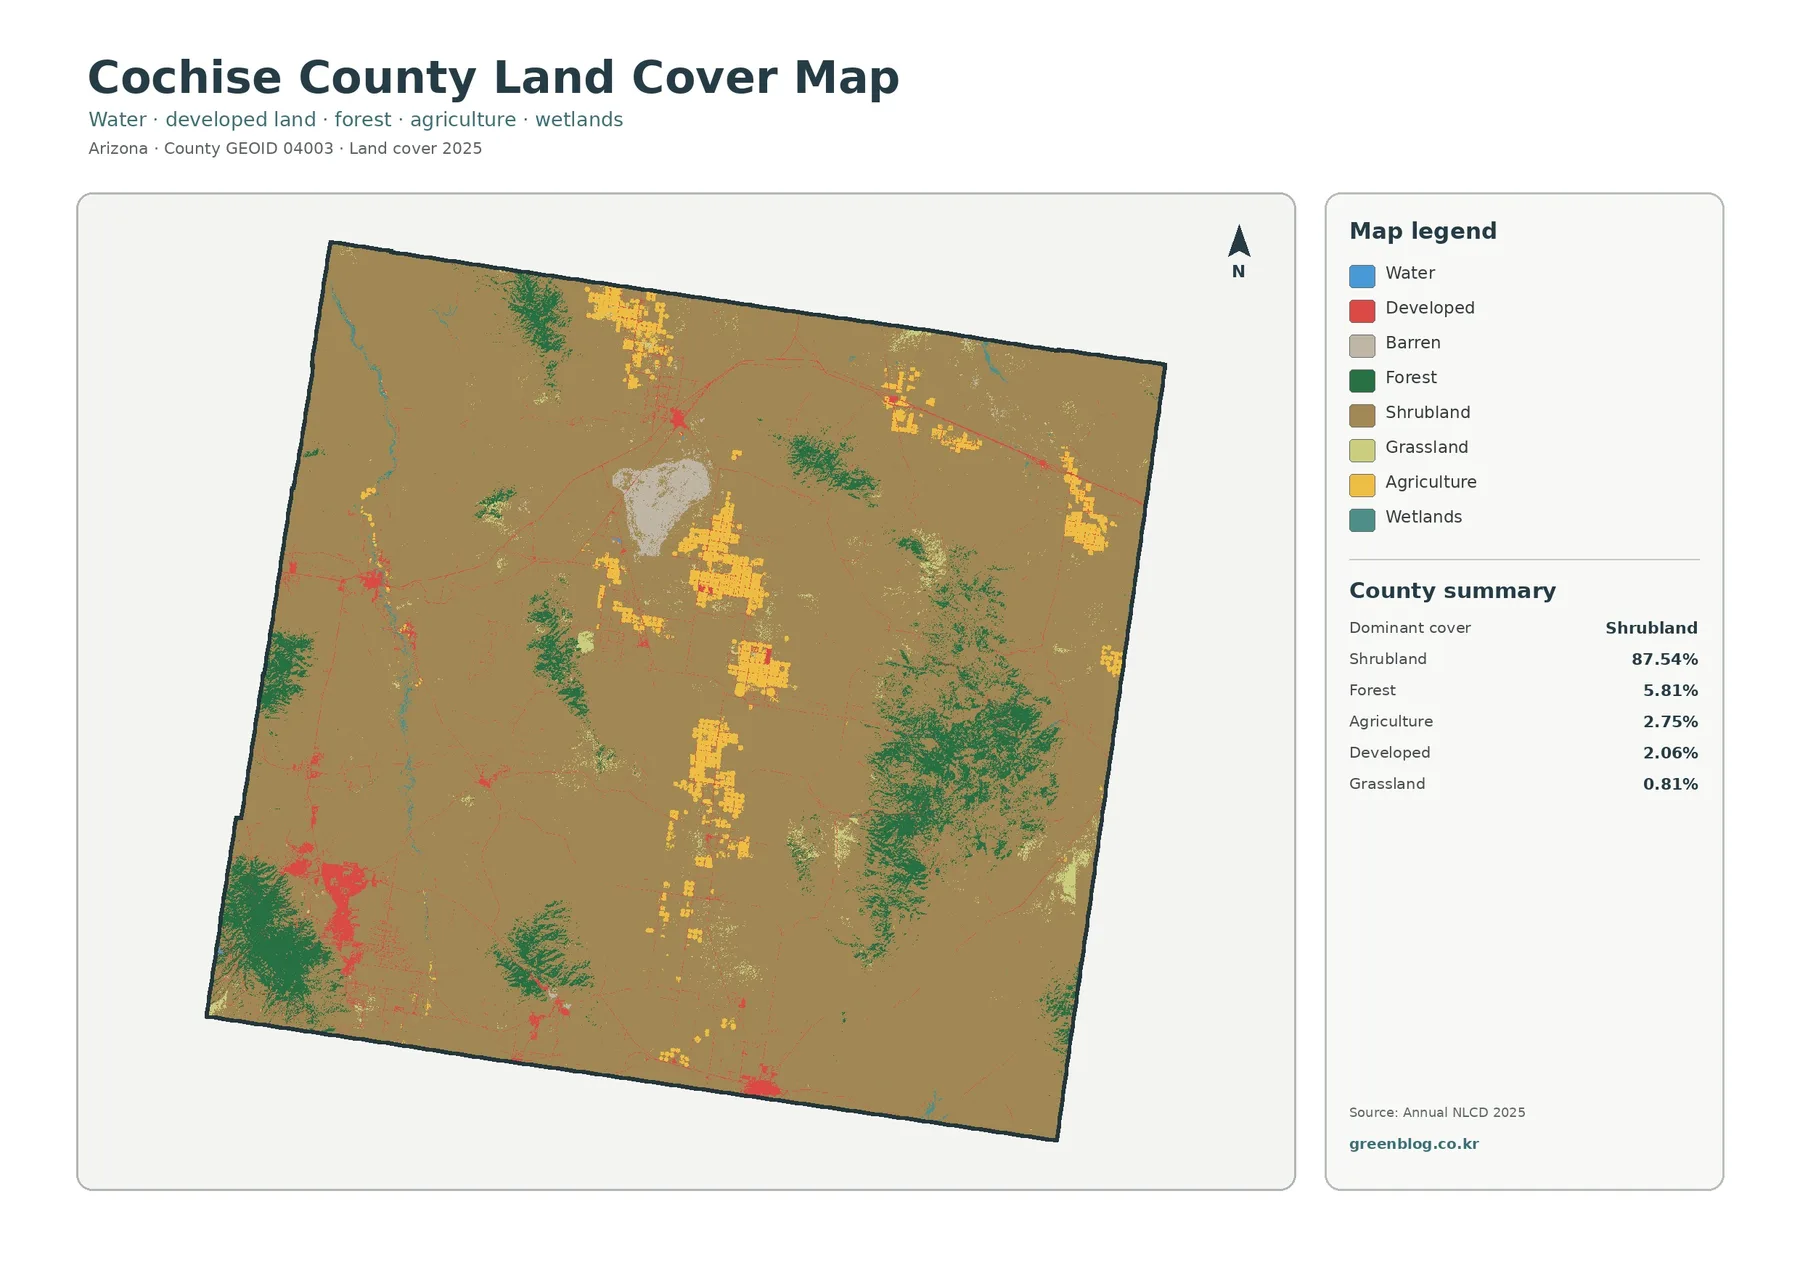
The general map is useful precisely because its dominant class is so extensive. Brown shrubland covers most of the county, but it is interrupted by dark green forest on several mountain blocks, yellow agricultural areas in a few broad bands and rectangles, and red developed clusters that occupy only a small share of the total area. The map therefore works best as a comparison of exceptions within a shrub-dominated landscape rather than as a simple statement that the county is mostly shrubland.
Built surfaces are concentrated rather than countywide
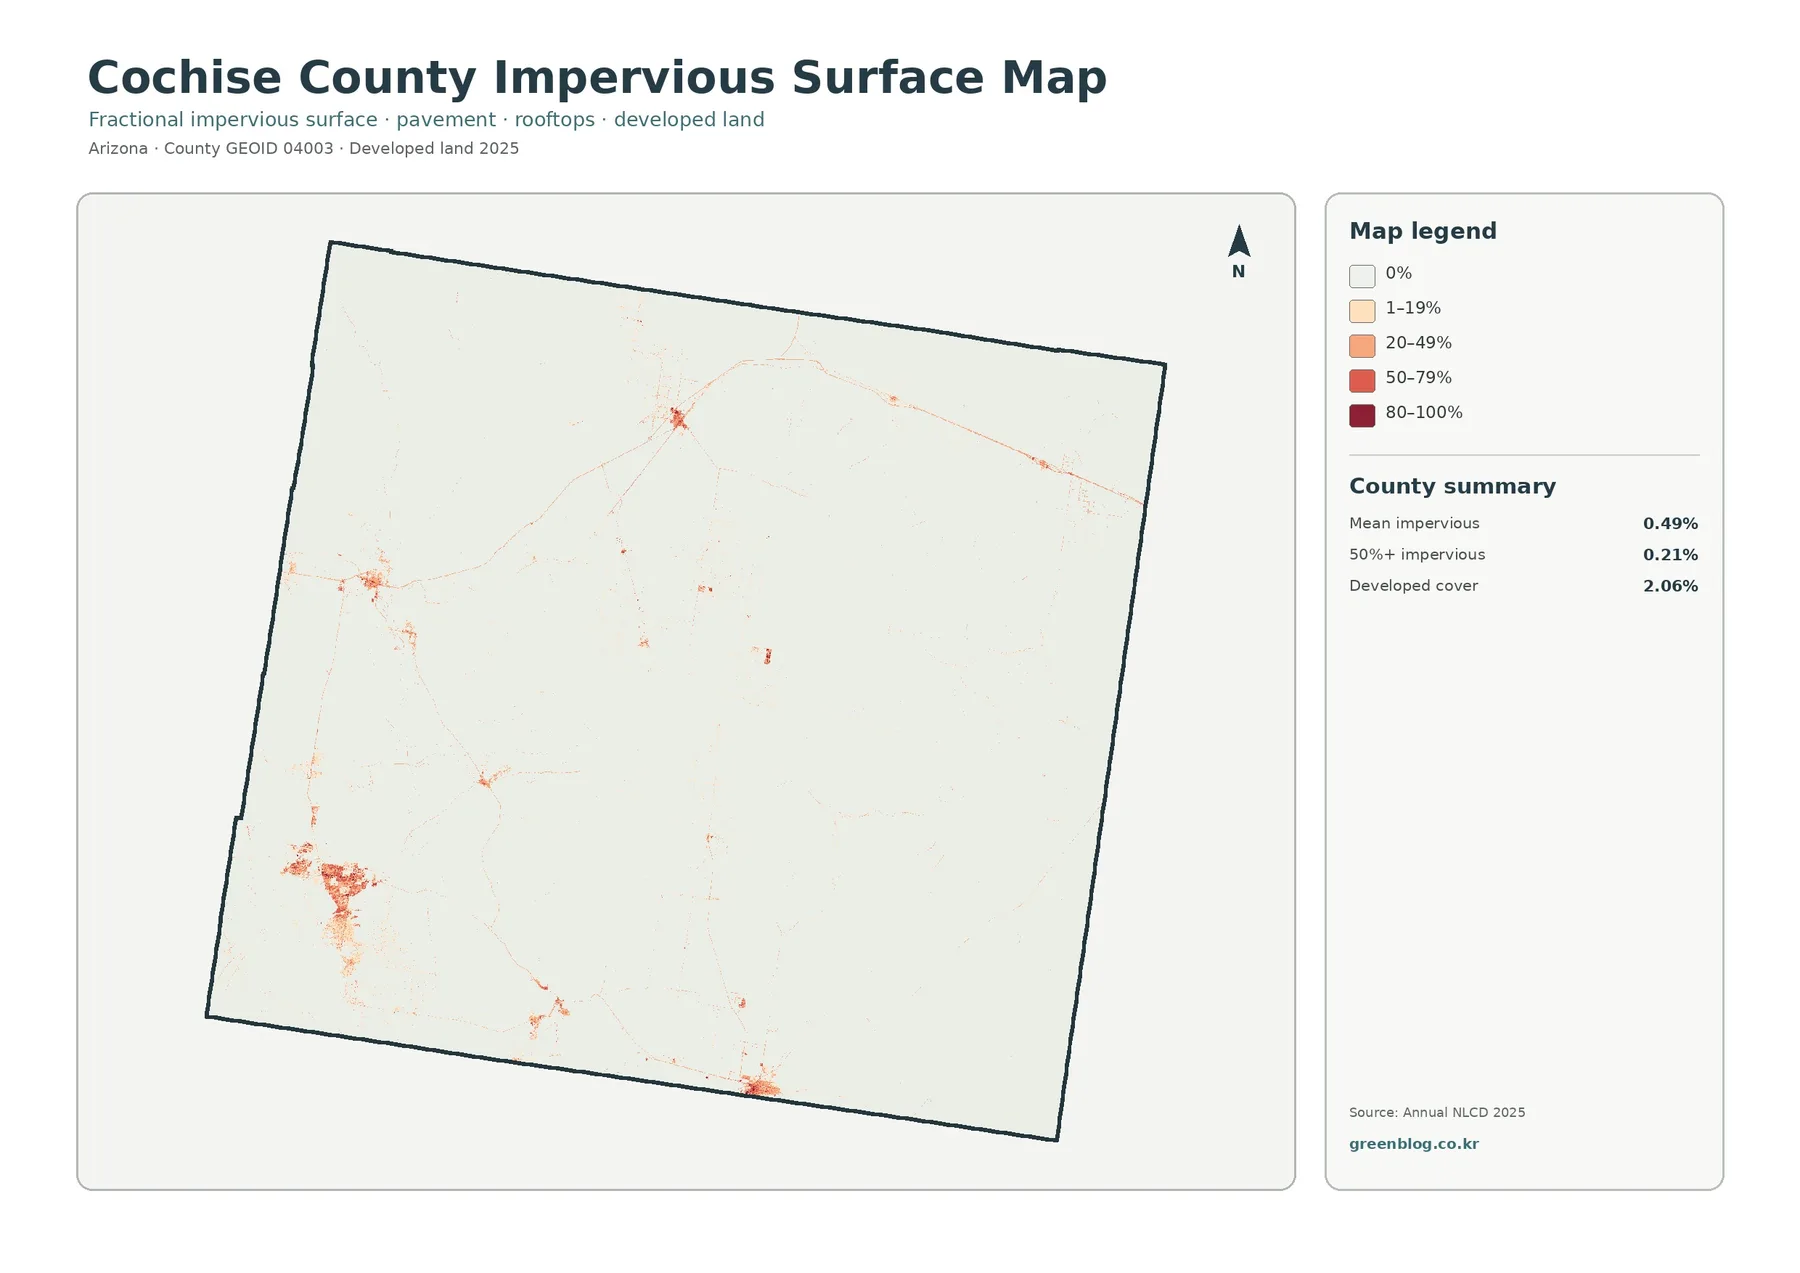
The impervious map strips away most land-cover classes and asks a narrower question: where are pavement, rooftops, and other surfaces that shed water rather than absorb it concentrated? Most of Cochise County is in the 0% or very low range. Stronger orange and red values appear in a few town-scale clusters and along thin connecting lines, making the built pattern far more localized than the general developed-land color might suggest.
The three summary values on this map should be kept separate. Mean imperviousness is 0.49%, the share mapped at 50% or greater imperviousness is 0.21%, and developed cover is 2.06%. Developed land can include vegetation, exposed soil, yards, and other permeable surfaces, especially in lower-density areas. Imperviousness measures the hard-surface fraction inside the mapped cell, so there is no reason for the two percentages to match.
Mountain forest patches and agricultural blocks tell different stories
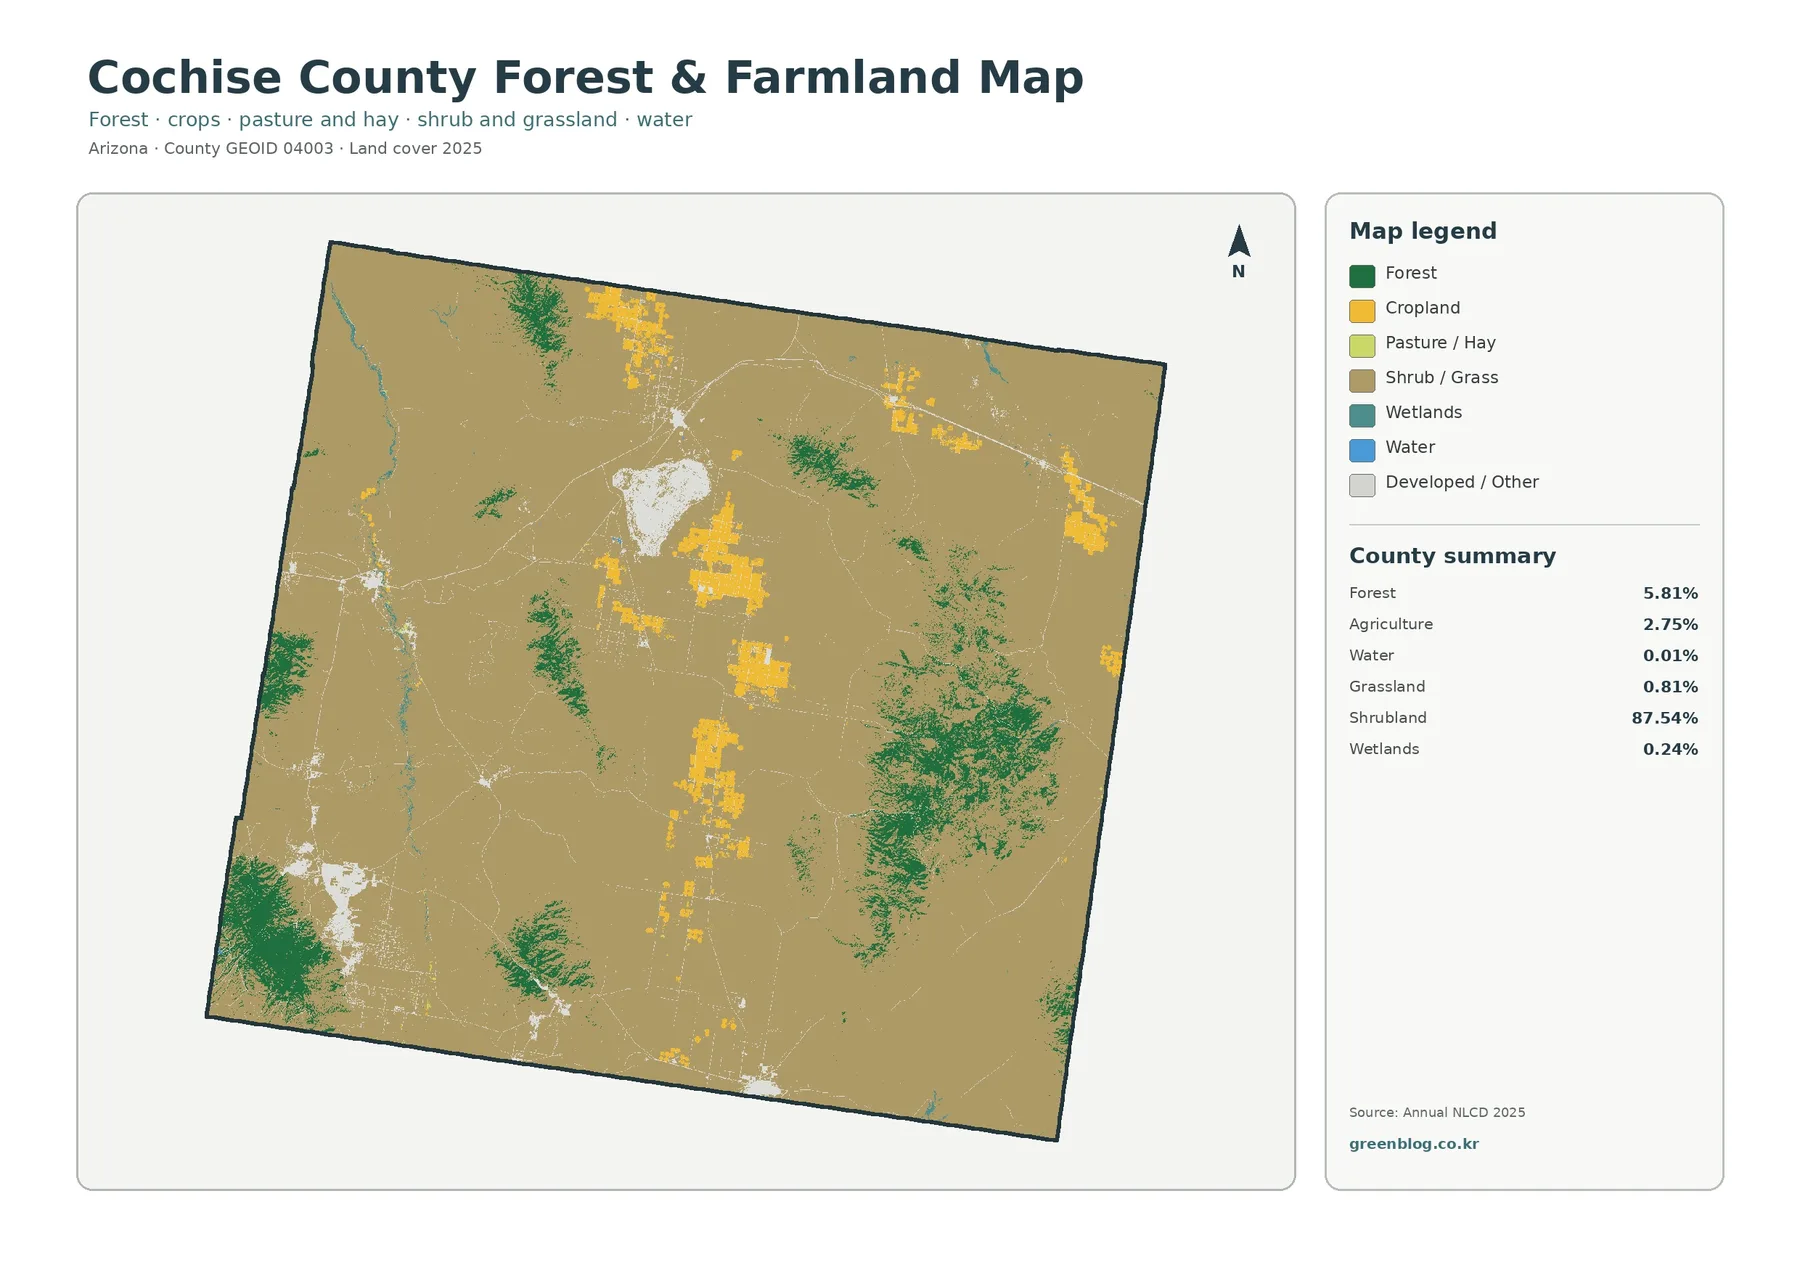
Removing much of the general-map detail makes the contrast between forest and agricultural cover easier to follow. Forest forms irregular clusters that correspond to mountainous parts of the county, while agriculture tends to appear in more geometric blocks. The two classes rarely produce the same visual pattern, so this view is especially useful for explaining why a countywide percentage is only one part of the story.
A good example is the San Pedro Riparian National Conservation Area. The Bureau of Land Management describes a protected upper San Pedro River corridor in Cochise County extending from the international border toward St. David. That context helps explain why narrow riparian features deserve attention even when the countywide water and wetland percentages are small.
The 7.27% class difference is not a development rate
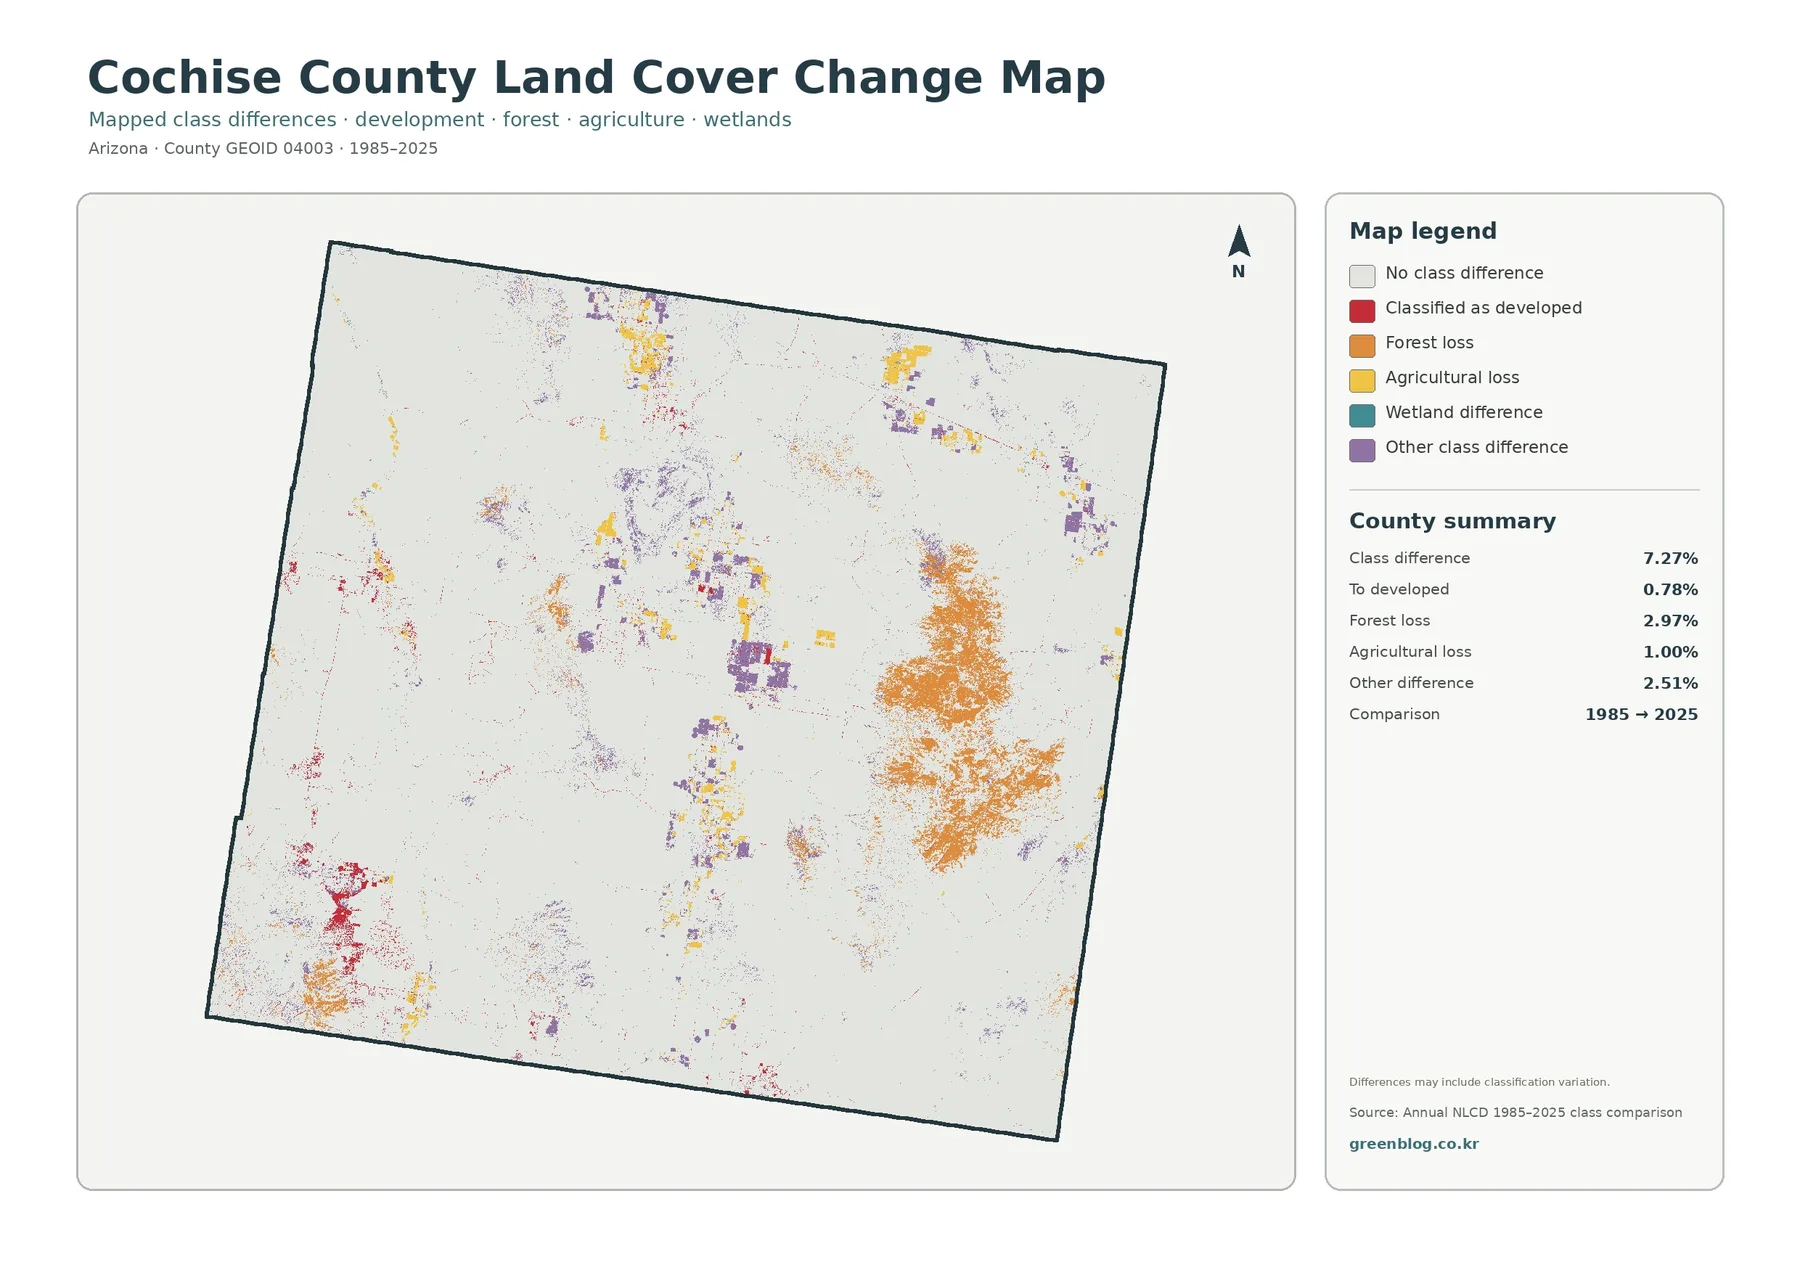
Orange forest-loss cells are especially noticeable in the large eastern forest complex, while yellow agricultural-loss cells are more common around some of the agricultural blocks. Red developed-change cells cluster near existing developed areas, and purple marks other class differences. Because these colors occupy different parts of the county, the map is more informative when read by category than when the 7.27% total is treated as a single kind of change.
The map itself warns that differences may include classification variation. A change in spectral response, season, mixed pixels, or the way a boundary cell is assigned can alter a class without documenting a single obvious event on the ground. For that reason, a colored cell is a place to investigate, not proof of a specific cause. Repeated clusters are generally more useful for county-scale interpretation than isolated individual pixels.
Why a thin river corridor can matter in a dry county
The BLM San Pedro source gives that pattern real county context without turning the land-cover map into a hydrology or habitat map. It describes the upper San Pedro River corridor as a protected riparian ecosystem in Cochise County. The land-cover image can locate a narrow surface-cover pattern, while the BLM page supplies the conservation meaning. Keeping those roles separate avoids attributing ecological functions to every blue or wetland-colored pixel.
A practical way to use the four maps together
For a classroom or presentation, start with the general map so viewers understand the overwhelming shrubland share. Move next to the impervious map, where the sparse built clusters become obvious against an almost empty background. The forest-and-farmland map then restores the mountain and agricultural contrasts, and the change map can finish the sequence by separating stable areas from several kinds of 1985–2025 class difference.
- County reference: compare the broad shrubland background with isolated forest, agriculture, and developed patches.
- Watershed or environmental discussion: use the impervious map for hard-surface concentration and the forest/farmland map for narrow water and wetland features.
- Change screening: use the 1985–2025 map to find clusters worth checking with imagery or field information rather than treating every colored cell as a confirmed event.
- Printing and presentation: use the matching county boundary across all four maps to build a consistent visual sequence.
What the 30-meter classification cannot answer
Annual NLCD is a raster classification built for consistent regional comparison. At 30-meter spatial resolution, one cell represents an area roughly 30 meters on each side. Small roads, buildings, stream edges, and mixed vegetation may therefore be generalized, and one cell can contain more than one surface type even though the final land-cover product assigns a representative class.
The current land-cover views on this page are labeled 2025, while the change map compares 1985 with 2025. Construction, wildfire, vegetation recovery, farming changes, or water conditions after the observation year may not be represented. When current conditions matter, check the latest release at MRLC Annual NLCD Data and use current local or field information as well.
Download the four original JPG maps
The WebP images in the article are optimized previews. The download archive contains the four original JPG maps at 2480 × 1754 pixels each: general land cover, forest and farmland, impervious/developed land, and the 1985–2025 change map. That size works well for documents, slides, and many ordinary print uses, but anyone preparing a large poster should check the intended print dimensions and resulting pixel density first.
Frequently Asked Questions
What is the dominant land-cover class in Cochise County?
Shrubland is the dominant 2025 class at 87.54%. Forest is 5.81%, agriculture 2.75%, developed land 2.06%, and grassland 0.81%. These are land-cover classification percentages, not legal land-use or ownership shares.
Why is developed cover 2.06% when mean imperviousness is only 0.49%?
Developed land is a land-cover class that can include vegetation and other permeable surfaces. Imperviousness estimates the fraction of pavement, rooftops, and similar hard surfaces within the cell. A low-density developed area can therefore count as developed while still having a low impervious percentage.
Does 7.27% class difference mean 7.27% of the county was developed?
No. The 7.27% figure combines all mapped class differences between 1985 and 2025. The portion classified to developed is 0.78%. Forest loss, agricultural loss, wetland difference, and other changes are separate categories, and the map notes that some differences may reflect classification variation.
What is included in the download ZIP?
The archive contains four original JPG files at 2480 × 1754 pixels: the general land-cover map, forest-and-farmland map, impervious/developed-land map, and 1985–2025 land-cover change map. The WebP previews used in the article are separate display files.
Map File Information
Cochise County Land Cover Map Files
- Included Files: Use only the versions confirmed in the article and supplied images
- File Type: Use the confirmed download contents
- Intended Use: Printing, education, presentations, and map-based projects
Related Maps
- Apache County Arizona Land Cover Map
- From Mohave to Cochise: Reading an Arizona State Map
- Albany County Land Cover Map
Sources
- MRLC Annual NLCD Data — access to annual land-cover data including the 2025 product used for the maps
- USGS Annual NLCD Land Cover Classification — definitions and classification context
- U.S. Census Bureau TIGER/Line Shapefiles — county boundary and GEOID reference
- Cochise County Planning & Zoning Division — official zoning and comprehensive-planning context
- BLM San Pedro Riparian National Conservation Area — official context for the upper San Pedro River corridor in Cochise County
Green Map creates custom-edited map images using open geographic data sources such as geoBoundaries, Natural Earth, OpenStreetMap, and government open data.
These maps are edited visual materials, not raw data files, and are provided for education, documents, presentations, and graphic reference.